xauusd setup"🌟 Welcome to Golden Candle! 🌟
We're a team of 📈 passionate traders 📉 who love sharing our 🔍 technical analysis insights 🔎 with the TradingView community. 🌎
Our goal is to provide 💡 valuable perspectives 💡 on market trends and patterns, but 🚫 please note that our analyses are not intended as buy or sell recommendations. 🚫
Instead, they reflect our own 💭 personal attitudes and thoughts. 💭
Follow along and 📚 learn 📚 from our analyses! 📊💡"
Xauusdupdates
XAUUSD Structural Analysis & Confluence - 16 July 2025 4-Hour Bias & Structural Context
Gold has recently broken above a key structure level at $3,320, confirming a bullish market environment on the 4‑hour timeframe. This follows a Change of Character (CHOCH) around $3,300, signifying a shift from consolidation to an upward trend. The swing from the late-June low ($3,244) to mid-July’s high ($3,374) sets our Fibonacci context:
38.2% retrace ≈ $3,318
50% retrace ≈ $3,309
61.8% retrace ≈ $3,300
These fib levels also align with prior structure and key ICT/SMC zones, signaling strong areas of interest.
🧭 Key 4-Hour Confluence Zones
Demand / Order Block → $3,300 – 3,305
Multi-method support: BOS, CHOCH, 50–61.8% fib convergence.
Fair Value Gap (FVG) → $3,320 – 3,325
Volume deficient zone post-BOS, primed for a retest.
Supply / Resistance Area → $3,360 – 3,370
High-timeframe supply, likely to cap further upside.
🧠 Smart Money Concepts
BOS above $3,320 confirms bullish structure.
CHOCH at ~$3,300 marks structure flip.
Liquidity grab zones found between $3,335–3,340, validating the presence of institutional activity.
Order Block at $3,300–3,305 supports buy-side interest.
📊 1-Hour Intraday Trade Setups
🔸 Setup #1 – FVG Re-Test
Entry: At ~$3,325 on pullback into $3,320–3,325 zone
SL: Below $3,320
TP1: $3,345, TP2: $3,360
🔸 Setup #2 – Demand OB Bounce (“Golden Setup”)
Entry: In the $3,300–3,305 range
SL: Below $3,298
TP1: $3,325, TP2: $3,345, TP3: $3,360
Edge: Tight risk, high confluence (SMC + fib + structure)
🌟 The Golden Setup
Zone to Watch: $3,300–3,305
Why It Rates Highest:
BOS, CHOCH, fib, and OB all align
Offers tight stop placement and strong upside
Risk-to-reward ~1:3
📌 Daily Watchlist Summary
Directional Bias: Bullish (BOS above $3,320 intact)
Primary Entry Zones:
$3,300–3,305 (Demand OB + structure)
$3,320–3,325 (FVG retest for continuation)
Key Target Zones:
$3,345–3,350 – realistic intraday exit
$3,360–3,370 – major supply cap
Invalidation Level: 4‑hour candle close below $3,298 negates bullish outlook
Final Commentary
Stay disciplined—only trade reactive signals at these levels: clean bounces, pinbars, or bullish engulfing patterns. The $3,300–3,305 zone stands out as the prime ‘Golden Setup’ entry.
CPI triggers sell-off, 3330 can be short-term long📰 News information:
1. Focus on tomorrow's CPI data
2. Bowman's speech at the Federal Reserve
3. Tariff information outflows and countries' responses to tariff issues
📈 Technical Analysis:
The short-term trend flag pattern has been formed, and our short-selling strategy perfectly hits the TP. According to current news, Trump has once again urged the Federal Reserve to cut interest rates. While there is almost no possibility of a rate cut this month, there is a high probability that a 25 basis point rate cut will be completed in September, which is also in line with our previous prediction of market trends.
The big negative line in 4H pierced the middle Bollinger band. Although the CPI data is bullish, it has little impact based on the announced value. Market expectations have been digested in advance, so there is no room for a big drop. The upper points still focus on the short-term resistance of 3355-3365. If it rebounds to this area first in the short term, you can consider shorting again. Focus on the strong support of 3330 below. As long as the retracement entity does not fall below 3330, gold will rise again and touch the resistance line of 3375-3385.
🎯 Trading Points:
BUY 3335-3325
TP 3355-3365
In addition to investment, life also includes poetry, distant places, and Allen. Facing the market is actually facing yourself, correcting your shortcomings, facing your mistakes, and exercising strict self-discipline. I share free trading strategies and analysis ideas every day for reference by brothers. I hope my analysis can help you.
OANDA:XAUUSD PEPPERSTONE:XAUUSD FOREXCOM:XAUUSD FX:XAUUSD TVC:GOLD FXOPEN:XAUUSD
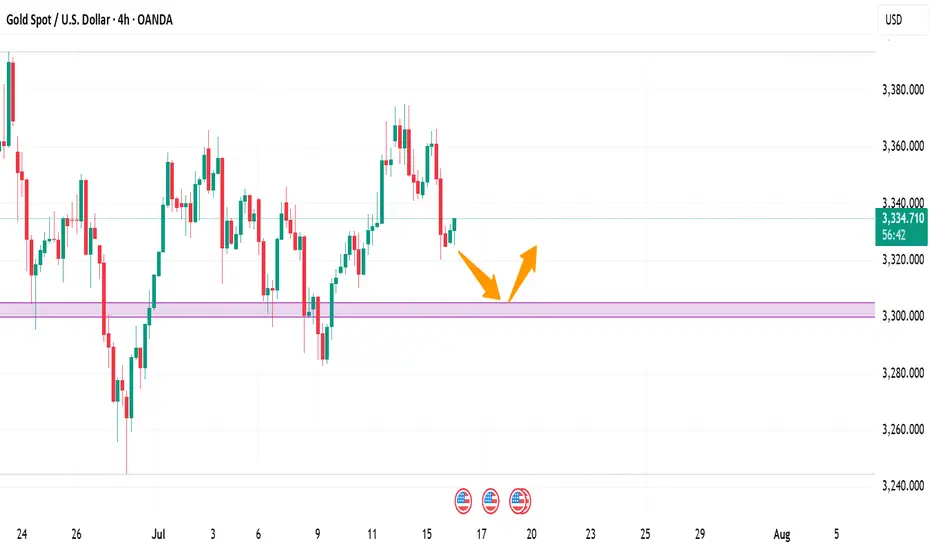
Gold Pullback in Play – Still Aiming for 3450 📌 In yesterday’s analysis, I argued that bulls likely won the battle and that a new leg up toward 3450 could be next from a swing trade perspective. I also mentioned that buying dips remains the preferred strategy.
And indeed – we got that dip.
📉 Price pulled back to 3340 and bounced,
but it hasn’t yet touched my key area of interest: 3330–3335.
What now?
My view stays the same –I still expect a move toward the 3450 zone,but I also believe a deeper dip toward support is still on the table – likely a liquidity grab before the next leg up.
Trading Plan:
✅ Buying dips remains the core strategy
🚫 Invalidation only comes on a break below 3305–3310
🎯 Upside target remains well above 3400, aiming for 1000+ pips
Let’s stay focused and let price come to us.
🚀
Disclosure: I am part of TradeNation's Influencer program and receive a monthly fee for using their TradingView charts in my analyses and educational articles.
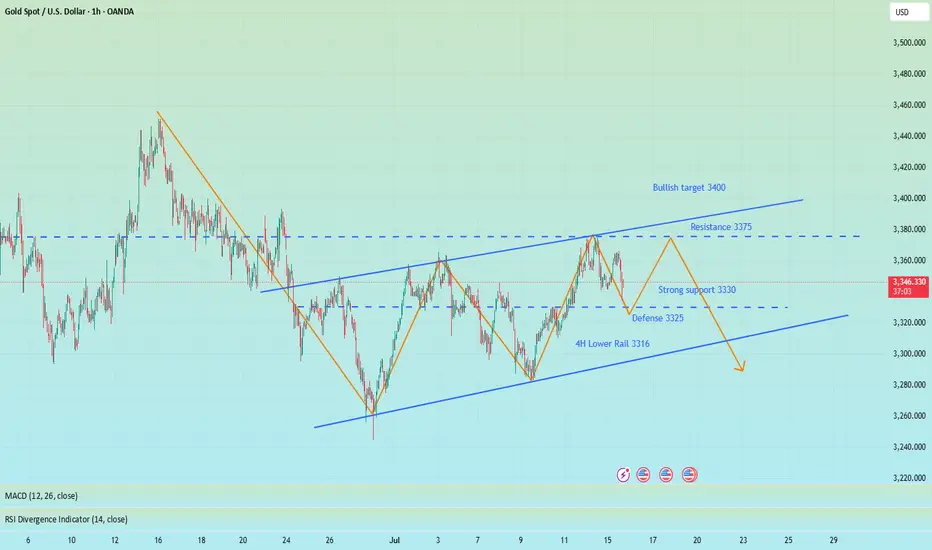
Diving through support, gold's downward space opens up!Gold reached a high of 3366. Although it broke through slightly, it failed to form an effective breakthrough and was only a false break. Subsequently, the bears led the market to continue to decline, breaking the key support of 3330 to 3320 at the end. The daily line closed with a medium-sized Yin line, directly breaking the short-term moving average support, ending the previous three-day positive trend. After the single Yin retreat, the upward trend failed to continue, and the risk of technical pattern reversal increased. The bears chose to break down, indicating that the market may fall further. The first test below is the support of the previous starting point of 3300. If this position is lost, the bearish target will point to the area near the previous low of 3270. The current market atmosphere is bearish, and the key pressure above has moved down to the 3340 line. It is expected that the rebound will be difficult to reach.
In terms of operation strategy: It is recommended that if gold rebounds first, it can be considered to continue to short near 3336-3338, stop loss 3347, and the target is 3310-3300 and below, and strictly stop loss to control risks. The overall bearish view is maintained.

Gold is coming to our target✏️ OANDA:XAUUSD As analyzed on Monday, the market touched the BUY zone at 3345 and continued the bullish wave structure, heading toward the 3400 level. If gold breaks above 3373, it will likely continue its strong upward momentum. Therefore, it is advised to avoid trading against the trend once the 3373 level is broken.
On the other hand, if gold breaks below the key support level at 3343 (yesterday's U.S. session barrier), the current uptrend may temporarily pause. In that case, gold will need to find new momentum to establish a fresh market trend.
📉 Key Levels
SUPPORT: 3343 - 3330 - 3313
RESISTANCE: 3373-3387-3400
Hold BUY order 3345 with target 3400
SELL trigger: Rejection of prices 3373, 3387 with confirmation from sellers
SELL 3400 Strong resistance zone
Leave your comments on the idea. I am happy to read your views.
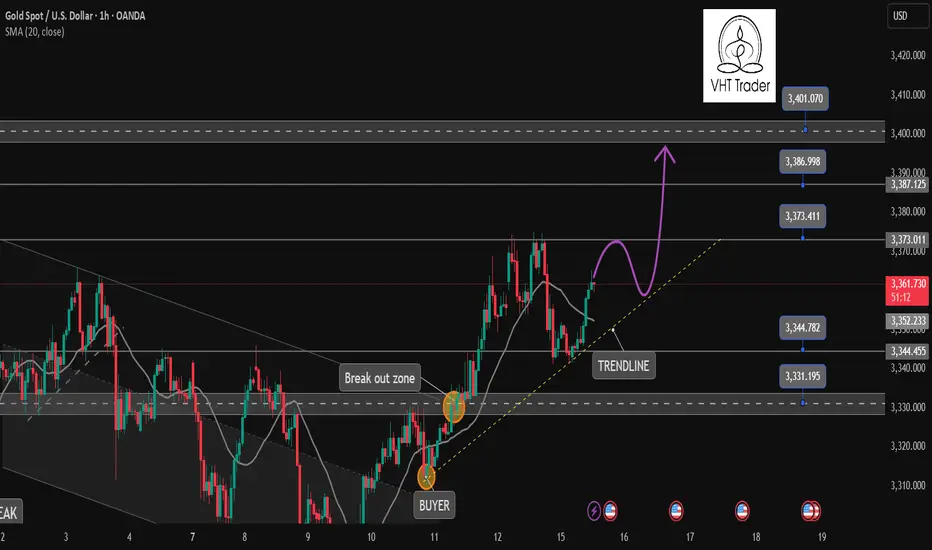
GOLD...Hello friends
Due to the entry of buyers and the strong breakdown of the indicated resistance, the price is expected to move to the indicated targets.
*Trade safely with us*

XAUUSD: Time For Swing Sell, 1 Hour Timeframe! Gold is currently trading at crucial level where we have witnessed a strong bearish presence. This is a small time frame overview and price may not complete the target fully, so close when you think it is the time. Good luck and trade safe!
Team Setupsfx_

Gold: Data, Tariffs & Trading LevelsThis week is packed with market news and economic data 😣. Key focuses include the US CPI, PPI, retail sales data, and the University of Michigan's preliminary consumer sentiment index. Additionally, former US President Trump plans to make a "major announcement" on Russia; the Federal Reserve will release the Beige Book (Economic Conditions Survey); and the CFTC's weekly positioning report is also worth monitoring 📊.
Over the weekend, Trump imposed tariffs on the EU and other regions, prompting a strong counterattack from the EU. The subsequent evolution of the situation requires continuous tracking, as it has triggered sharp market volatility pushing toward the 3400 mark 😱. Trump has recently announced frequent tariff policies (e.g., 30% tariffs on the EU and Mexico, and threats of 100% tariffs on Russia), amplifying market uncertainty. While this theoretically benefits gold's safe-haven demand, the actual impact requires close observation of institutional capital flows 🤔.
Gold prices consolidated at the bottom after a sustained pullback last night and extended their rebound this morning. Key pressure levels have undergone a support-resistance flip. The current gold rebound is merely a secondary confirmation of the 30-minute top structure, and after surging to 3365 in the afternoon, short-term signs of pressure have emerged 😕. In a volatile market, if prices start to consolidate sideways, it may signal the end of this oscillating upward trend, with a shift to a downward phase ahead.
Given market sensitivity ahead of the CPI data release, it’s advisable to focus on a volatile pullback trend 🧐. After today’s rebound, key attention should be on the 3363-3368 range as a shorting zone, with the long/short defensive level set at yesterday’s intraday high of 3375. Downside support is focused on the 3340-3335 range 🔍

It is expected to fluctuate and fall before CPI data📰 News information:
1. Focus on tomorrow's CPI data
2. Bowman's speech at the Federal Reserve
3. Tariff information outflows and countries' responses to tariff issues
📈 Technical Analysis:
The 1H chart shows that the gold price continued to pull back last night and then fluctuated at the bottom, and continued the rebound trend this morning. The key pressure level is the top and bottom conversion level. The current rebound in gold is only a secondary confirmation of the top structure at the 30-minute level. After reaching 3365, it has shown signs of short-term pressure. In a volatile market, if the price begins to consolidate horizontally, it may indicate the end of this round of volatile upward trend, and it will enter a downward phase later. Considering the market sensitivity before the release of CPI data, it is recommended to focus on the volatile decline trend. After today's rebound, it is necessary to focus on the 3365-3368 area as a short-selling range, and the long-short defense position is set at yesterday's intraday high of 3375. The support below focuses on the 3350-3340 range.
🎯 Trading Points:
SELL 3358-3368
TP 3345-3333
In addition to investment, life also includes poetry, distant places, and Allen. Facing the market is actually facing yourself, correcting your shortcomings, facing your mistakes, and exercising strict self-discipline. I share free trading strategies and analysis ideas every day for reference by brothers. I hope my analysis can help you.
FXOPEN:XAUUSD TVC:GOLD FX:XAUUSD FOREXCOM:XAUUSD PEPPERSTONE:XAUUSD OANDA:XAUUSD
GOLD Intraday Chart Update For 15 July 2025Hello Traders,
Welcome to the US CPI Day, as you can see that market is in tight range for now and all eyes on the breakout for now
Only clear breakout of 3380 we will consider market will be bullish towards 3400 & 3425
If markets sustains below 3335 it will move towards 3305 or even 3285
All eyes on US CPI
Disclaimer: Forex is Risky
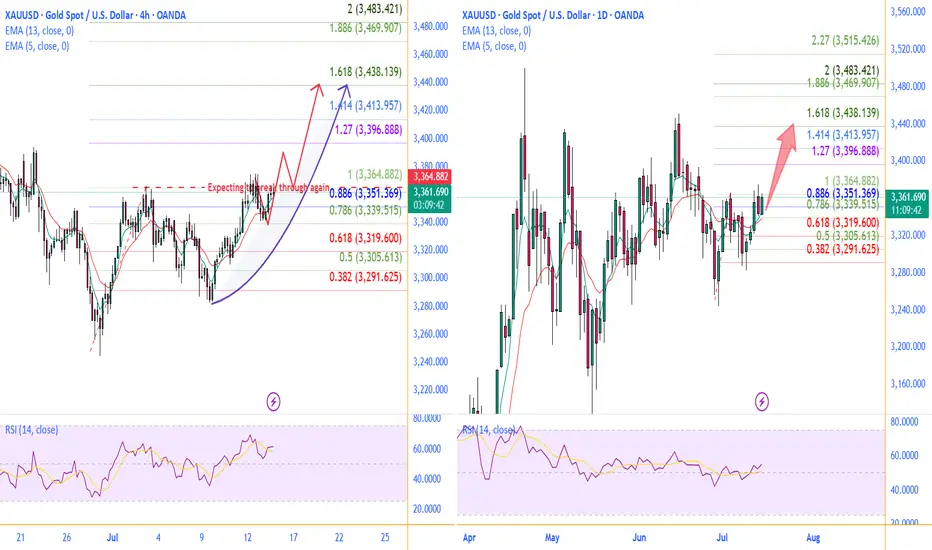
1507 a bull trend back to Gold Hello traders,
Gold has returned back above EMAs on daily chart.
On 4h chart, there is a chance for it to break through last top level to make a new high up to 3438 .
Take a good use liquidity of CPI of US today.
You could get a great result of that.
GOOD LUCK!
LESS IS MORE!
XAUUSD Analysis todayHello traders, this is a complete multiple timeframe analysis of this pair. We see could find significant trading opportunities as per analysis upon price action confirmation we may take this trade. Smash the like button if you find value in this analysis and drop a comment if you have any questions or let me know which pair to cover in my next analysis.

Gold CPI shocks and fallsThe hourly chart shows that the gold price fluctuated and consolidated at the bottom after a continuous correction, continuing the rebound trend. The key pressure level is the top and bottom conversion position. The current gold rebound is only a secondary confirmation of the top structure at the 30-minute level. After reaching 3365, the short-term has shown signs of pressure. In the volatile market, if the price begins to consolidate horizontally, it may indicate the end of this round of volatile upward trend, and it will enter a downward phase later. Considering the market sensitivity before the release of CPI data, it is recommended to focus on the volatile decline trend. After today's rebound, it is necessary to focus on the 3363-3368 area as a short-selling range, and the long and short defense position is set at yesterday's intraday high of 3375. In terms of operation, it is recommended to maintain the idea of rebounding and shorting, and pay attention to the 3340-3335 range for support below.
Operation strategy:
1. It is recommended to short gold near the rebound of 3363-3368, with a stop loss at 3375 and a target of 3350-3340.

XAU/USD 15 July Intraday AnalysisH4 Analysis:
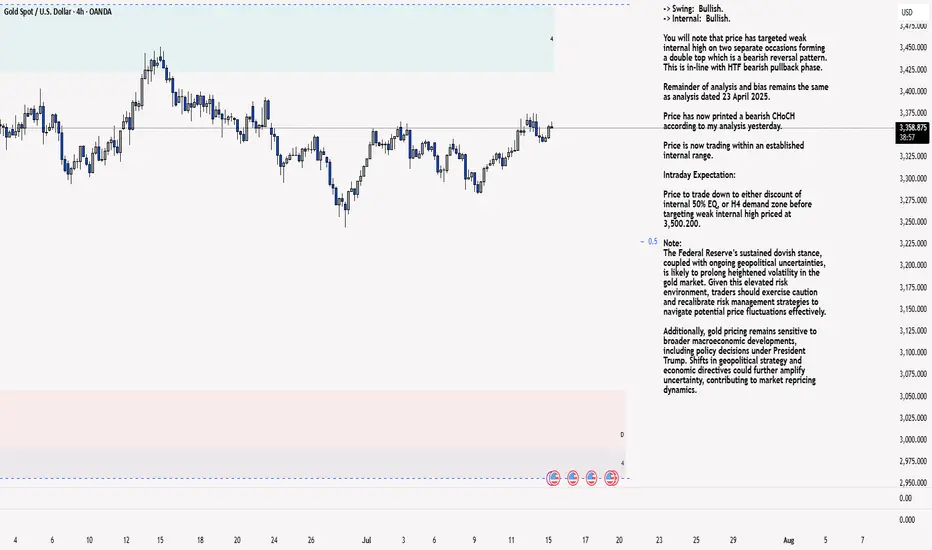
-> Swing: Bullish.
-> Internal: Bullish.
You will note that price has targeted weak internal high on two separate occasions forming a double top which is a bearish reversal pattern. This is in-line with HTF bearish pullback phase.
Remainder of analysis and bias remains the same as analysis dated 23 April 2025.
Price has now printed a bearish CHoCH according to my analysis yesterday.
Price is now trading within an established internal range.
Intraday Expectation:
Price to trade down to either discount of internal 50% EQ, or H4 demand zone before targeting weak internal high priced at 3,500.200.
Note:
The Federal Reserve’s sustained dovish stance, coupled with ongoing geopolitical uncertainties, is likely to prolong heightened volatility in the gold market. Given this elevated risk environment, traders should exercise caution and recalibrate risk management strategies to navigate potential price fluctuations effectively.
Additionally, gold pricing remains sensitive to broader macroeconomic developments, including policy decisions under President Trump. Shifts in geopolitical strategy and economic directives could further amplify uncertainty, contributing to market repricing dynamics.
H4 Chart:
M15 Analysis:
-> Swing: Bullish.
-> Internal: Bullish.
H4 Timeframe - Price has failed to target weak internal high, therefore, it would not be unrealistic if price printed a bearish iBOS.
The remainder of my analysis shall remain the same as analysis dated 13 June 2025, apart from target price.
As per my analysis dated 22 May 2025 whereby I mentioned price can be seen to be reacting at discount of 50% EQ on H4 timeframe, therefore, it is a viable alternative that price could potentially print a bullish iBOS on M15 timeframe despite internal structure being bearish.
Price has printed a bullish iBOS followed by a bearish CHoCH, which indicates, but does not confirm, bearish pullback phase initiation. I will however continue to monitor, with respect to depth of pullback.
Intraday Expectation:
Price to continue bearish, react at either M15 supply zone, or discount of 50% internal EQ before targeting weak internal high priced at 3,451.375.
Note:
Gold remains highly volatile amid the Federal Reserve's continued dovish stance, persistent and escalating geopolitical uncertainties. Traders should implement robust risk management strategies and remain vigilant, as price swings may become more pronounced in this elevated volatility environment.
Additionally, President Trump’s recent tariff announcements are expected to further amplify market turbulence, potentially triggering sharp price fluctuations and whipsaws.
M15 Chart:
Elliott Wave Analysis – XAUUSD | July 14, 2025
🔍 Momentum Analysis
D1 Timeframe: Momentum is currently reversing to the upside, indicating that the bullish trend may continue into early next week (Monday).
H4 Timeframe: Momentum has entered the overbought zone, suggesting that a short-term correction is likely to bring momentum back down into oversold territory.
🌀 Elliott Wave Structure
On the H4 chart, we observe a contracting triangle pattern (abcde) approaching its final stages.
In the Friday trading plan, we anticipated that the corrective phase had ended and price was entering a new impulsive wave. However, there are two irregularities worth noting:
A pin bar candle with high volume has appeared at the resistance zone near 3365, while H4 momentum is overbought. This signals a likely short-term correction — something that ideally should not happen if price is already in wave 3. Ideally, price should have surged to 3402 on Friday to strengthen the bullish case.
On the H1 chart, bullish candles are small and overlapping, reflecting weak bullish momentum and a lack of conviction from buyers.
These two signs suggest that the market may still be within the correction phase, and the 3402 level will serve as a key confirmation zone to determine whether the correction has truly ended.
💡 Trading Outlook
The bullish momentum on the D1 chart still supports BUY positions for the coming week.
However, since the H4 chart is overbought, a short-term pullback is likely.
We will look to buy on dips toward lower support zones, targeting a move toward 3393 – 3402, which remains the target area as outlined in Friday’s plan with the original entry at 3332 – 3330.
📊 Trading Plan
BUY Zone: 3342 – 3340
Stop Loss (SL): 3330
Take Profit 1 (TP1): 3370
Take Profit 2 (TP2): 3393
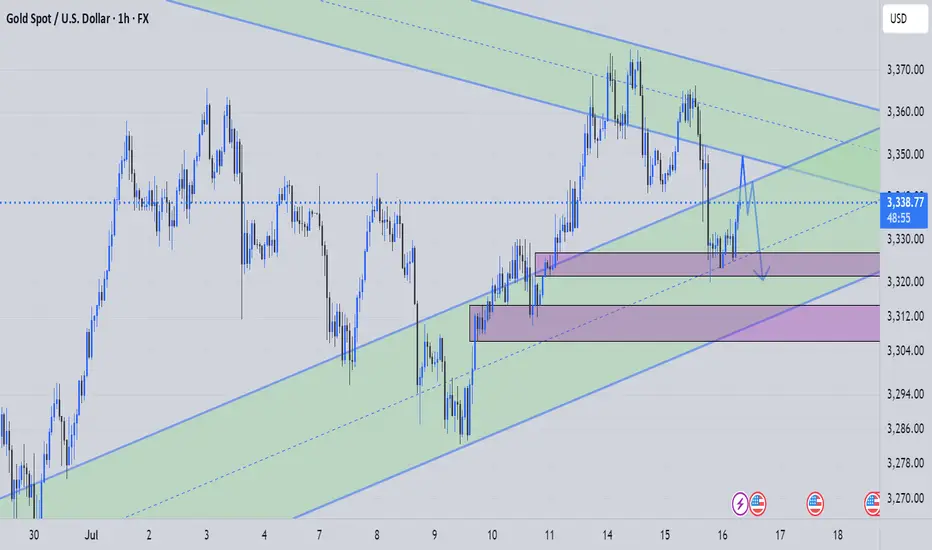
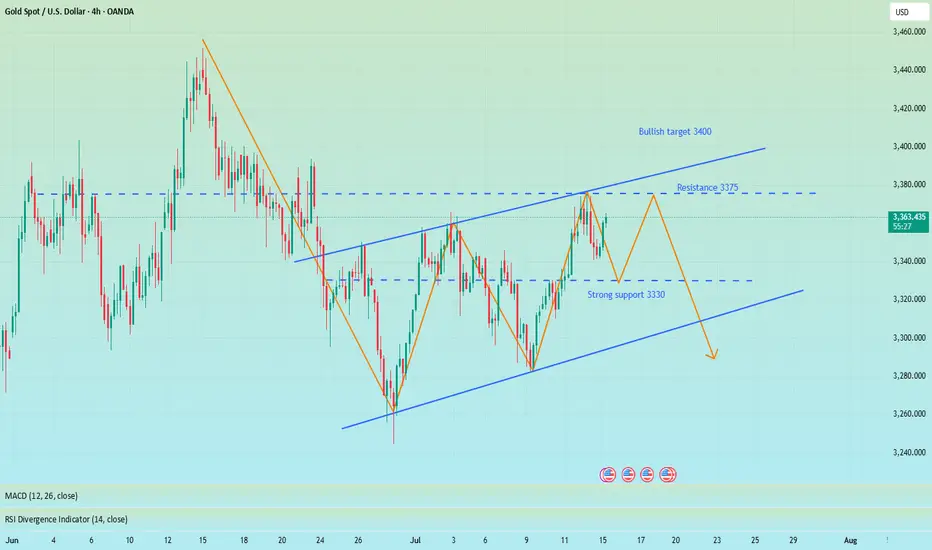
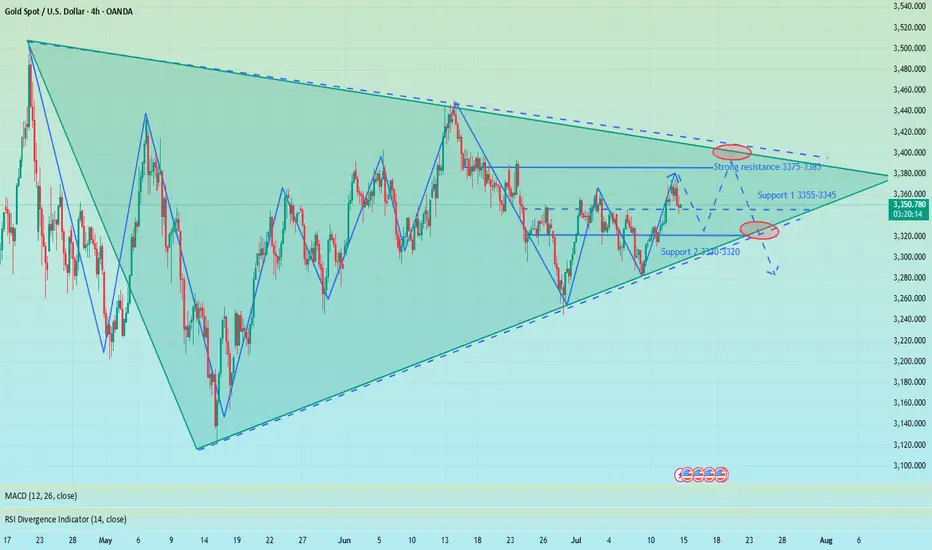
Converging triangle, may rise again in the short termUnder the influence of recent tariffs and the Federal Reserve's interest rate cuts, the main trend of the gold market remains bullish, but from the weekly and monthly level analysis, there is a high probability that it will pull back again after this round of highs and maintain a large range of fluctuations at a high level. Technical analysis shows that gold currently does not have the conditions for a unilateral surge at the daily level. Although the key level of 3345 has been broken, the continuity of the market is extremely poor, and volatility is still the main theme. At present, the trend of gold has formed a converging triangle pattern, and it may rise again in the short term. However, we need to be vigilant that the weekly line may form a high-rise and fall pattern, and the price of gold may fall back to 3300! Therefore, in today's late trading, you can consider retreating to the 3335-3330 area to go long
OANDA:XAUUSD
XAUUSD 4H – Break & Retest With Bullish Continuation | SMC🚨 Gold (XAUUSD) is setting up for a potential bullish move after a successful break and retest of a key resistance zone at 3346 – 3348, now turned into fresh support.
🔍 Technical Breakdown:
📌 Structure:
Gold previously formed a strong resistance near 3346, which aligned with multiple rejections in past sessions. After a liquidity sweep and break above this level, price retraced for a textbook break-and-retest setup.
📌 CHoCH & BOS (Break of Structure):
The market showed a bullish Change of Character followed by a clean Break of Structure to the upside, confirming bullish intent.
📌 Smart Money Perspective:
Institutional demand was respected at 3296–3305 zone.
Liquidity below this zone has been taken.
Current bullish candles are printing higher highs and higher lows.
📌 Confluences:
✅ Break & Retest of major structure
✅ Clean demand zone below
✅ Imbalance filled
✅ Bullish market structure
✅ SMC confirmation (CHoCH + BOS + Mitigation)
📈 Trade Idea (Long Setup):
💰 Buy Entry: 3359
🔻 Stop Loss: 3305 (below demand + structure)
🎯 Take Profit 1: 3400
🎯 Take Profit 2: 3440 – 3442 (major resistance)
🧮 Risk-to-Reward: 1:2+
This setup provides a strong bullish continuation opportunity targeting the upper resistance zone. Monitor candle confirmations and session volume for more precise entries.
📢 💬 Like this idea? Follow for more Smart Money trades on Gold, US30, NAS100, and V75!

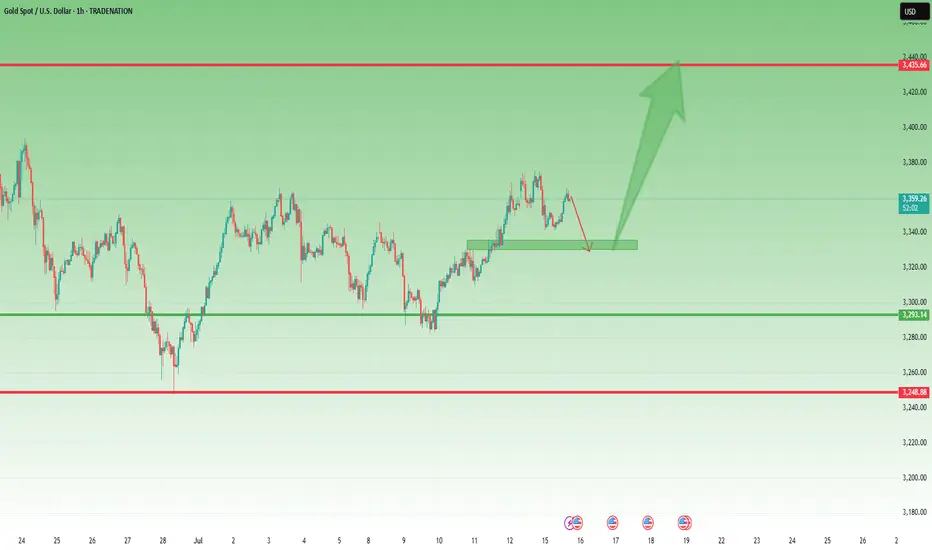
Gold Aiming Higher: Bullish Momentum Toward Key S&D ZoneHello guys!
The main bullish trend remains intact on Gold. After forming a solid base near the QML level, price has been respecting the ascending channel structure and is now pushing toward the upper boundary of that channel.
The current price action shows strength and momentum, and with the recent breakout above the midline of the channel, it signals that buyers are likely to push price toward the next key area of interest.
The target is clearly defined: the supply zone around 3409–3423, which has previously acted as a major resistance area.
Core idea:
Main trend: Bullish
Structure: Ascending channel
Support confirmed: QML zone bounce
Current behavior: Price moving along the top of the channel
Target: 3409–3423 supply zone

Gold Short Term OutlookGold has extended its recovery after holding above the Pullback Support Zone and is now trading around 3,359, attempting to build momentum toward higher resistance levels.
The structure remains bullish with price trading above both the 50MA and 200MA , which are starting to slope upward and act as dynamic support.
A confirmed break and hold above 3,354 would open the path toward the next resistance cluster at 3,383 and potentially 3,400, with 3,416 and 3,440 as higher-timeframe resistance targets.
If price fails to hold above 3,354 and begins to fade, watch the Pullback Support Zone (3,335–3,305) closely for signs of renewed buying interest.
A clean break below that zone would shift focus to the deeper Support Zone (3,289-3,267) and potentially the HTF Support Zone (3,241–3,208) if selling pressure builds.
📌 Key Levels to Watch
Resistance:
‣ 3,364
‣ 3,383
‣ 3,400
‣ 3,416
Support:
‣ 3,354
‣ 3,335
‣ 3,305
‣ 3,289
‣ 3,267
‣ 3,241
‣ 3,208
🔎 Fundamental Focus
All eyes are on today’s U.S. CPI release

XAUUSD: Trading Strategy Before the US SessionAhead of the release of key US session data, gold is oscillating in a narrow range between $3340 and $3375. The daily chart shows a balance between bulls and bears. On the 4-hour chart, $3375, which coincides with the 61.8% Fibonacci retracement level, serves as a critical watershed for the market trend.
In terms of trading strategy, it's advisable to trade within the aforementioned range and follow the trend once there is a clear breakout. If gold stabilizes above $3360 and breaks through $3375, it could rally towards $3400. Conversely, if it falls below $3340 and loses the $3310 - $3320 range, it may test $3300. It's essential to confirm the direction in conjunction with fundamental news and avoid blind trading.
I am committed to sharing trading signals every day. Among them, real-time signals will be flexibly pushed according to market dynamics. All the signals sent out last week accurately matched the market trends, helping numerous traders achieve substantial profits. Regardless of your previous investment performance, I believe that with the support of my professional strategies and timely signals, I will surely be able to assist you in breaking through investment bottlenecks and achieving new breakthroughs in the trading field.

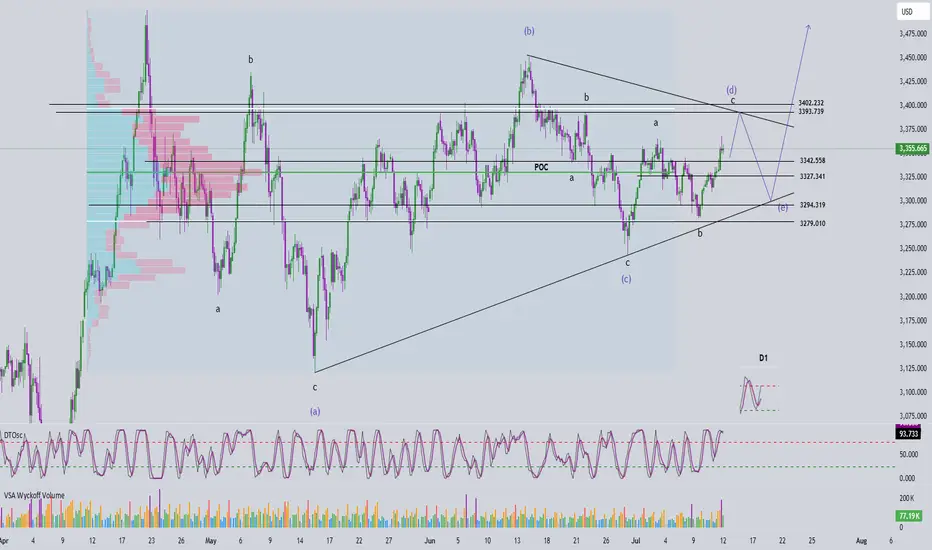
Elliott Wave Analysis – XAUUSD | July 15, 2025🟢 Trade Update
The BUY order at the 3342 – 3340 zone was triggered at 3341. As of now, price has moved up by 140 pips, and the market is still following the planned scenario from the previous analysis.
📊 Momentum Analysis
D1 Timeframe: Momentum is in the overbought zone, and indicator lines are showing signs of crossing — a warning signal of a potential reversal on the daily chart.
H4 Timeframe: After a 6-candle decline from 3377 to 3342, H4 momentum has reversed upward. With 2 bullish candles already formed, we expect another 3–5 bullish candles, aiming toward the 3390 zone.
🌀 Elliott Wave Update
Price action is currently moving toward the end of the abcde contracting triangle. We are monitoring two potential scenarios:
Scenario 1 – Ongoing Triangle Correction
If price returns to the lower boundary of the triangle, it is likely forming wave e, which would present a buy opportunity for the final leg of the triangle.
Scenario 2 – 5-Wave Impulse Extension
The current structure shows a 5-wave impulsive move, with wave 4 completed and wave 5 now beginning.
The projected target for wave 5 aligns with the resistance zone at 3398 – 3402.
After completing wave 5, the market could enter a corrective phase, consistent with the idea that wave d ends at this resistance.
🔔 If the price breaks above 3402, it would likely confirm that the abcde correction is complete and that a new impulsive bullish wave has started.
🎯 Trade Plan
📍SELL Zone: 3396 – 3398
⛔️ Stop Loss: 3406
🎯 TP1: 3376
🎯 TP2: 3327
📍BUY Zone: 3295 – 3293
⛔️ Stop Loss: 3285
🎯 TP1: 3327
🎯 TP2: 3365
🎯 TP3: 3402
✅ Note: Prioritize entries only after confirmation from price action and momentum at key levels.

XAUUSD Trade Plan | 15 July 2025After observing the recent low breakdown and a clear liquidity grab, we saw a strong direction confirmation breakout. This suggests that the market is likely to continue its upward momentum.
🔄 Breakdown/Seller Trap triggered the reversal
🔹 Last Important Low respected
📈 Breakout confirms bullish direction
✅ Plan:
I’ll be watching for a pullback into the grey demand zone (highlighted area) for a potential long entry.
🕵️♂️ No FOMO — I’ll only enter after price shows clear bullish behavior in this zone.
🎯 Target: 3,365.89 resistance
📍 Entry Zone: Grey box (based on previous structure)
Let me know your thoughts — are you also watching this zone?
#XAUUSD #GoldAnalysis #LiquidityGrab #SmartMoneyConcepts #PriceAction #TradingPlan #TradingView
