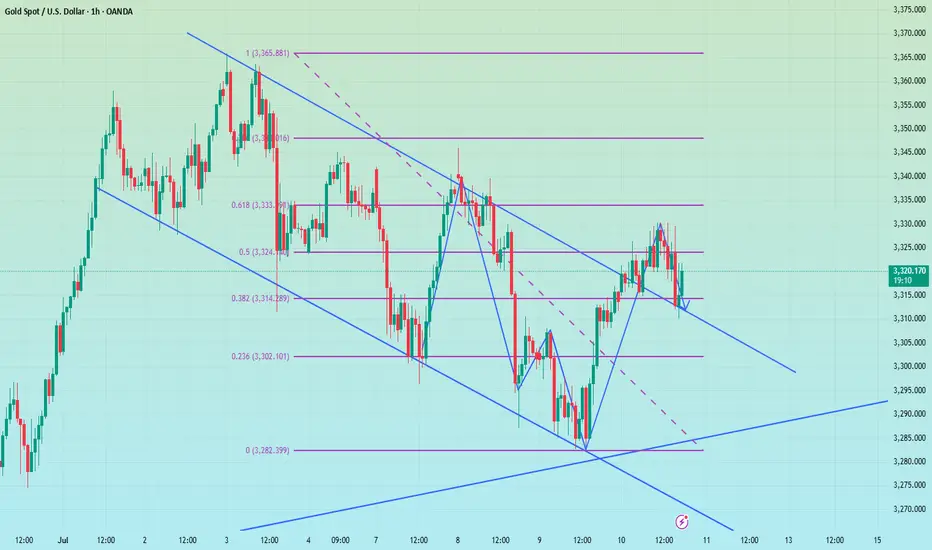
Gold is in the bullish direction after correcting the supportHello Traders
In This Chart GOLD HOURLY Forex Forecast By FOREX PLANET
today Gold analysis 👆
🟢This Chart includes_ (GOLD market update)
🟢What is The Next Opportunity on GOLD Market
🟢how to Enter to the Valid Entry With Assurance Profit
This CHART is For Trader's that Want to Improve Their Technical Analysis Skills and Their Trading By Understanding How To Analyze The Market Using Multiple Timeframes and Understanding The Bigger Picture on the Charts
Xauusdupdates

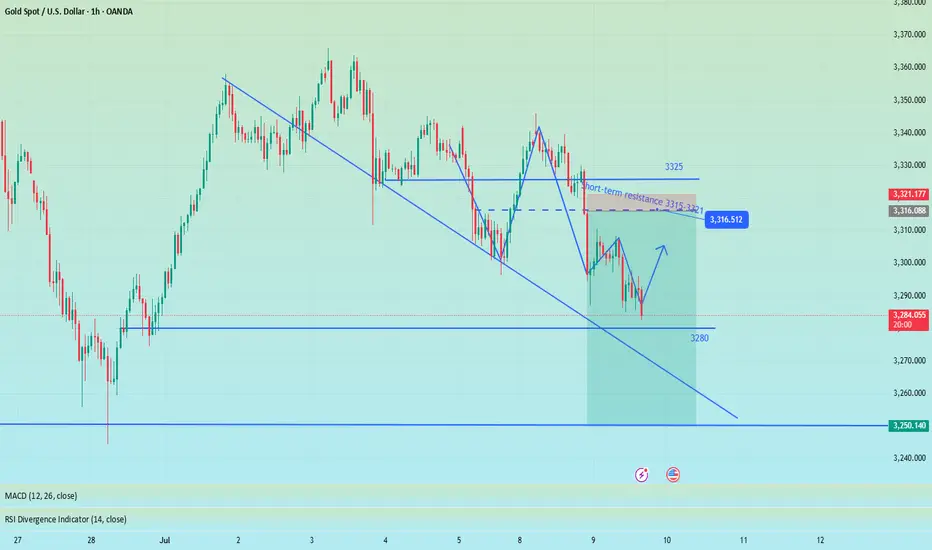
Gold is in the Bearish direction from a Support levelHello Traders
In This Chart GOLD HOURLY Forex Forecast By FOREX PLANET
today Gold analysis 👆
🟢This Chart includes_ (GOLD market update)
🟢What is The Next Opportunity on GOLD Market
🟢how to Enter to the Valid Entry With Assurance Profit
This CHART is For Trader's that Want to Improve Their Technical Analysis Skills and Their Trading By Understanding How To Analyze The Market Using Multiple Timeframes and Understanding The Bigger Picture on the Charts

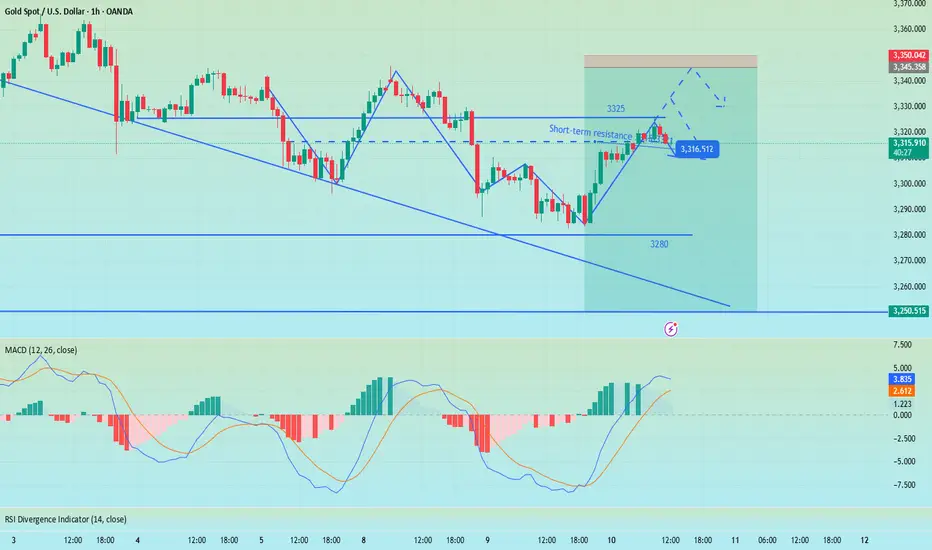
Gold is in the Bearish DirectionHello Traders
In This Chart GOLD HOURLY Forex Forecast By FOREX PLANET
today Gold analysis 👆
🟢This Chart includes_ (GOLD market update)
🟢What is The Next Opportunity on GOLD Market
🟢how to Enter to the Valid Entry With Assurance Profit
This CHART is For Trader's that Want to Improve Their Technical Analysis Skills and Their Trading By Understanding How To Analyze The Market Using Multiple Timeframes and Understanding The Bigger Picture on the Charts

XAU/USD 1H Outlook
FVG Fill (3320–3318)
Price is expected to drop into the unfilled Fair Value Gap between 3320 and 3318.
London/NY Liquidity Hunt
After filling the FVG, look for a swift bullish impulse during the London and New York sessions to trigger stop-runs and collect liquidity.
Downward Correction to 3305 & 3298
Once the liquidity grab completes, expect a retracement:
First target: 3305
On a break below 3305, next target is the unfilled FVG at 3298
Summary:
Drop → FVG fill (3320–3318) → Bullish liquidity hunt (London/NY) → Retracement toward 3305 (then 3298)

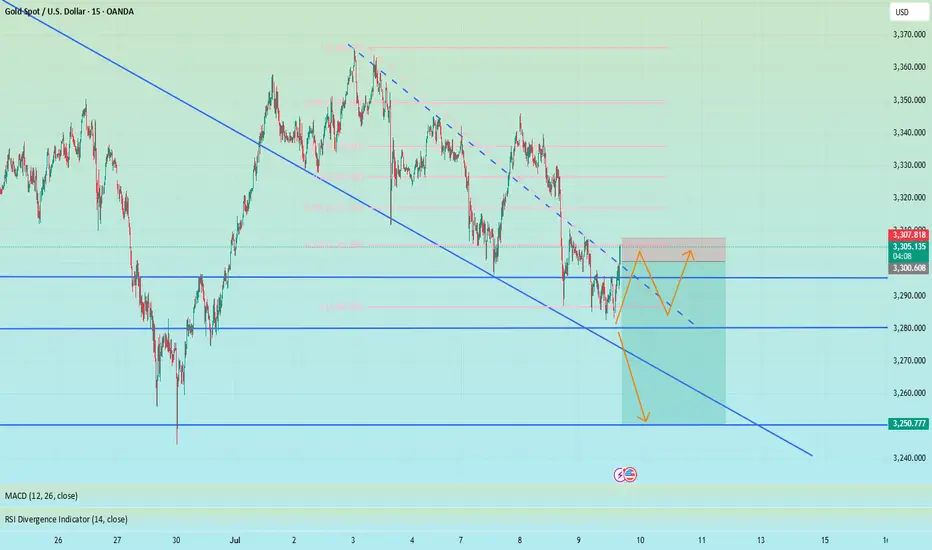
XAUUSD - Intraday SMC Bearish Setup | 15m ChartGold is currently reacting to a visible 15m supply zone after a bullish retracement. Price failed to break above the short-term supply (highlighted in red), showing signs of potential short-term reversal.
🔍 Key SMC Insights:
Supply Zone at 3318.47 – 3320 area is holding firm, with price showing clear rejection and lower highs forming.
Internal CHoCH already confirmed — suggesting short-term bearish order flow is active.
Liquidity Grab and rejection around the supply confirms smart money may be offloading positions.
Imbalance Below near 3303.96, with further inefficiency down to 3272.64.
📍Trade Idea:
Sell Entry: After a retest or failure to break above the 3318.47 zone.
Target 1: 3303.96 (near-term support and minor liquidity)
Target 2: 3272.64 (major liquidity zone + possible demand area)
Invalidation: Bullish break and close above 3320 would shift intraday bias.
⚠️ Monitor lower timeframes (1m–5m) for confirmation before executing trades. This setup aligns with the 4H bearish structure, enhancing confluence.

XAUUSD - 4H Bearish Rejection from Supply Zone | SMC AnalysisGold is showing signs of weakness after reacting strongly from a 4H Supply Zone around the 3331.72 level. Price tapped into the red supply zone, failed to break above, and is now forming lower highs — suggesting bearish momentum is building.
🔍 Key SMC Observations:
Supply Zone: Price rejected the 3331.72 level, which acted as a clear supply area based on past liquidity grabs and bearish institutional moves.
Change of Character (CHoCH): We saw a CHoCH around July 5th–6th, indicating a shift from bullish to bearish order flow.
Lower High Formation: Price failed to make a new high after tapping supply, showing signs of distribution.
Imbalance + Target Zone: Clean imbalance exists down to 3288.73 and potentially to the green demand zone around 3260–3270.
📍Trade Setup Idea:
Sell Opportunity: If price continues to reject the supply zone, look for bearish confirmation on the lower timeframes (e.g., 1H) to enter.
Target 1 (TP1): 3288.73 (near-term liquidity level)
Target 2 (TP2): 3260–3270 demand zone
Invalidation: A break and close above 3331.72 would invalidate the short-term bearish bias.
🔴 Watch for reaction around 3288.73 – if it holds, expect a possible bounce. If broken, further downside is likely.

Night range operation, technical outlook is still bearishGold fell as expected after repeated battles at 3330. Currently, gold has returned to around 3320. This shows that the rebound was mainly driven by short-term risk aversion. As market news calms down and sentiment stabilizes, the market will most likely return to the technical trend. If it unexpectedly breaks through 3330, it is expected to touch the 3345 line I mentioned this morning. The short-term 3310 line currently has certain support. From a technical point of view, I prefer to short. Once it falls below 3310, the subsequent support will move to 3295-3285. Therefore, I think it is a good choice to short again at 3320-3330.
OANDA:XAUUSD
Bearish is still the main trend, first test 3250 supportYesterday, as the market expected a trade agreement to be reached between the US and its trading partners, risk sentiment was boosted. The strengthening of DXY and the rise in US Treasury yields put some pressure on gold.
On Monday, gold rebounded to 3320, and on Tuesday it touched above 3320 and began to fall sharply. In the short term, 3320 is a key trading position that we need to pay attention to. From the daily chart, the support line of 3320 has been completely broken, and the two major support points below are 3250 and 3200 respectively. Judging from the 4H chart, the decline may have just begun. Next, we may first face a test of the 3250 support line. If the 3250 support can be maintained, gold will maintain a volatile consolidation in the short term. Otherwise, if it falls below 3250, it will test the 3200 mark.
OANDA:XAUUSD
Gold fluctuates, continue to short at 3345 during the dayTrump's trade policy continues to stimulate risk aversion. Although the Federal Reserve's meeting minutes are neutral, they can potentially provide support for gold. Yesterday we gave the short positions of 3321 and 3333, which have generated profits so far. At the same time, it should be noted that the 4H MACD indicator has the potential demand to form a golden cross. In the short term, there is a certain suppression force at 3330-3335. If the Asian and European sessions repeatedly test this position but fail to break through effectively, you can go short without hesitation. If you want to go short again during the day, you can consider 3340-3345 and defend 3350. The lower 3310-3305 is a relatively strong support area during the day. If the Asian session retreats to this point, you can consider going long, with the target looking at 3330-3335.
OANDA:XAUUSD
Perfect prediction, pay attention to the high short entry pointTrump extended the tariff agreement to August 1 and began to collect tariffs again. Although it eased market tensions, his remarks will not be extended after the expiration, and he issued a tariff threat, which increased global trade uncertainty and pushed up risk aversion. There was no clear direction coming out of the Fed's meeting minutes last night, but the potential bias was bullish.
At the beginning of the Asian session this morning, I also indicated that gold would rise and then fall. At present, it has reached the highest point near 3325 and then began to retreat, but the 4H golden cross has just been formed. There is still a certain pressure above 3333. If the gold price repeatedly competes for this position, we can continue to short without hesitation. The second short position today is near 3340-3345. There is potential momentum for the bulls in the short term. If the European session continues to fluctuate below 3333, then the entry of short positions will be slightly more stable. Yesterday, short orders were given at the key points of 3321 and 3333, and TP looked at 3310. If the bulls re-emerge below 3310-3305, you can consider short-term long positions and target 3330-3335.

Gold rebounds as expected, NY focuses on the Fed meeting📰 News information:
1. Federal Reserve meeting minutes
📈 Technical Analysis:
Gold fell into a narrow range of fluctuations during the European trading session. As I said this morning, gold is expected to rebound in the short term and the bullish momentum needs to be released. From a technical perspective, the overall market is still in a volatile pattern. The support at the 3280 level below is still a key point that needs attention in the short term. The European session has repeatedly tested this area. If it falls below this support, it is expected to touch the 3250 level as I said. While guarding against gold diving during the NY session, the upper resistance of 3315-3321 cannot be ignored to prevent bullish retaliation.
🎯 Trading Points:
SELL 3315-3321-3333
TP 3300-3290-3280-3250
In addition to investment, life also includes poetry, distant places, and Allen. Facing the market is actually facing yourself, correcting your shortcomings, facing your mistakes, and exercising strict self-discipline. I share free trading strategies and analysis ideas every day for reference by brothers. I hope my analysis can help you.
OANDA:XAUUSD PEPPERSTONE:XAUUSD FOREXCOM:XAUUSD FX:XAUUSD FXOPEN:XAUUSD TVC:GOLD
Key point layout suggestionsThe current gold market is showing a weak rebound pattern. Although there was a small rebound on Wednesday, if it cannot stand above 3330, the overall trend will still be weak.
From the daily level, the support level is 3300 and the resistance level is 3335. The price is oscillating between the middle and lower tracks of the Bollinger Bands, and there is a possibility of upward or downward breakthrough.
Focus on the H4 cycle trend: if the rebound can stand above 3330, the price may further rise to 3335 US dollars;
Once it stands at 3335, it can be basically confirmed that the callback is over, and the subsequent challenge of 3345 resistance level may be repeated.
It is recommended to adopt a long-on-dip strategy near the support level, focusing on the support strength of the 3310-15 area below; the resistance level of 3335-3340 should be paid attention to above.
In terms of specific operations, if the price rebounds to the 3335-3340 range, short selling can be considered; if it pulls back to the 3310-3315 range, long selling can be considered.

7/9: Focus on Selling Gold on ReboundsGood evening, everyone!
Apologies for the late update today—I had some matters to attend to. I hope your trades are going smoothly.
Yesterday, gold found support around 3284 and continued to rebound during today’s session, reaching as high as 3330. The key resistance at 3321 has now been broken and is currently acting as a short-term support level. However, based on the current price structure, this level is likely to be retested multiple times, and some consolidation may follow.
The next major resistance lies between 3337 and 3343. In the absence of strong bullish momentum, the preferred short-term strategy remains selling on rebounds, especially near resistance zones.
⚠️ Additionally, the U.S. Initial Jobless Claims data will be released during the New York session tonight, which may cause increased volatility and potentially whipsaw price action. Be cautious with position sizing, and avoid emotional trades or chasing price action during news releases. Patience and discipline will be key.

XAUUSD Analysis todayHello traders, this is a complete multiple timeframe analysis of this pair. We see could find significant trading opportunities as per analysis upon price action confirmation we may take this trade. Smash the like button if you find value in this analysis and drop a comment if you have any questions or let me know which pair to cover in my next analysis.

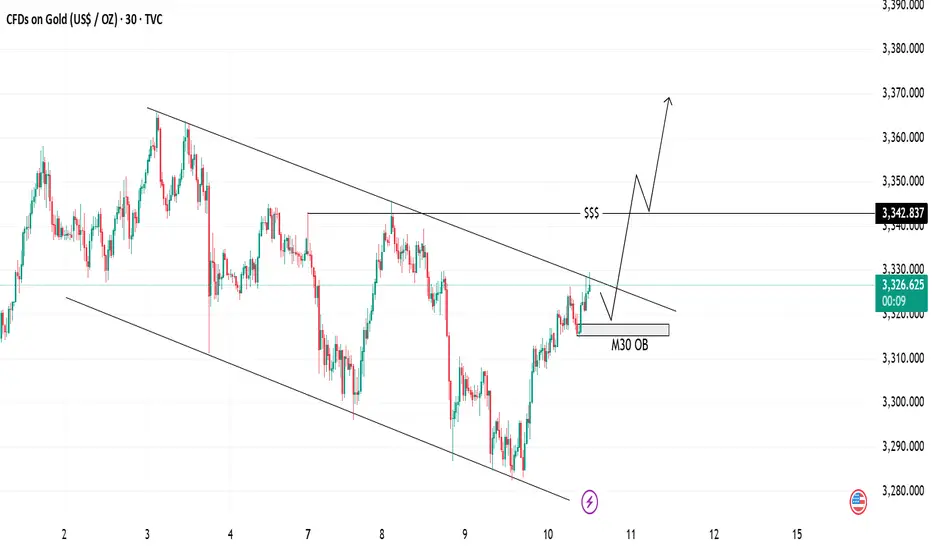
Gold Analysis Bullish Breakout | Trendline & OB Setup📈 Gold Analysis
We are currently seeing price action within a descending channel, testing key support at the M30 OB (Order Block). The price is pushing higher after bouncing off the support level, and the trendlines suggest a potential breakout to the upside.
💡 Key Levels:
Support Zone: 3326
Resistance Zone: 3342
The market is primed for a possible rally, indicated by the upward momentum and price breaking out above the trendline. Watch for confirmation as we approach the liquidity level for further bullish movement.
⚡ Trade Idea: Look for a long entry if price closes above the trendline for a continuation towards the next resistance.
GOLD Intraday Chart Update For 10 July 25Hello Traders,
as you can see that GOLD is stuck in tight range between 3300-3330 all eyes on clear breakout for now
further only market will break clearly 3345 level then we will consider market will move further advance below 3300 GOLD will move towards 3250
Scalping Range 3300 - 3330 for the short time period
Disclaimer: Forex is Risky

XAUUSD:Stay long
Today's Shock Trading strategy:
Day traders can buy long positions at 3318-23 with a target range of 3340-45
Median traders please refer to the previous thinking unchanged.
More detailed strategies and trading will be notified here ↗↗↗
Keep updated, come to "get" ↗↗↗

XAUUSD Idea: 4H Trendline First Breakout - Liquidity PlayFOREXCOM:XAUUSD
🔍 Analysis Overview:
Price has just broken above a 4H descending trendline for the first time. However, I remain cautious due to the following key observations:
📌 NOTES:
The broader market sentiment is still bearish due to recent tariff-related news, which often fuels risk-off behavior.
Historically, the first breakout of a strong trendline often fails, trapping early buyers.
This breakout is likely attracting buy-side liquidity, giving institutions an opportunity to hunt stops.
My observation shows buying interest started around the 3308–3313 range, suggesting smart money accumulation and a possible trap.
📉 I'm watching for a fake breakout and potential reversal targeting the liquidity zones marked below around 3307 and possibly lower.
The liquidity sweep below equal lows could offer a better risk-reward setup.
💡 Conclusion:
If price fails to hold above this breakout and shows signs of rejection, I will be anticipating a return towards the previous demand zone for a liquidity grab.
#XAUUSD #GoldAnalysis #SmartMoneyConcepts #LiquidityGrab #ForexTrading #TrendlineBreak #MarketPsychology #TradingSetup #SMC #PriceAction

XAUUSD Sell Nowthis is gold pairs and my analysis say gold down soon possible, like my analysis and share.

Elliott Wave Analysis – XAUUSD July 10, 2025
🌀 Elliott Wave Structure
On the H4 timeframe, price has returned to test the upper boundary of the converging triangle – currently acting as dynamic resistance. Based on the current wave count, wave e (purple) may have completed at the 3279 low, and price is potentially starting a breakout move.
👉 A confirmed breakout above the triangle would validate the end of the abcde correction and mark the beginning of a new upward trend.
🔋 Momentum Analysis
D1 timeframe: As forecasted yesterday, momentum is entering oversold territory and showing early signs of a reversal. This suggests that an upward trend could dominate over the next 5 days.
H4 timeframe: The two momentum lines are sticking together, indicating a weakening upward drive. A minor pullback may be needed before the next leg up. Key nearby resistance levels to watch are 3330 and 3342.
🎯 Key Price Levels & Validation Zones
The following support zones are crucial for identifying potential entries:
Support Zone 1: 3306 – 3308
Support Zone 2: 3294 – 3297
‼️ Important: A break below 3294 would invalidate the current wave structure, and a new count would be required.
📌 Trade Plan
Scenario 1 – Buy at higher support:
Buy Zone: 3308 – 3306
SL: 3303
TP1: 3342
TP2: 3366
TP3: 3390
Scenario 2 – Buy at deeper support (if stronger correction occurs):
Buy Zone: 3297 – 3294
SL: 3287
TP1: 3342
TP2: 3366
TP3: 3390
Scenario 3 – Safer option (breakout confirmation):
Wait for a breakout above the triangle, then enter on the retest (around 3325–3330)
SL: Based on structure formed during the retest
TP range: 3366 – 3390
📌 Preferred strategy: Wait for H4 to reach oversold or wait for a confirmed breakout and retest to enter safely in alignment with the new uptrend.

XAUUSD Idea: 4H Trendline First Breakout - Liquidity PlayFOREXCOM:XAUUSD
🔍 Analysis Overview:
Price has just broken above a 4H descending trendline for the first time. However, I remain cautious due to the following key observations:
📌 NOTES:
The broader market sentiment is still bearish due to recent tariff-related news, which often fuels risk-off behavior.
Historically, the first breakout of a strong trendline often fails, trapping early buyers.
This breakout is likely attracting buy-side liquidity, giving institutions an opportunity to hunt stops.
My observation shows buying interest started around the 3308–3313 range, suggesting smart money accumulation and a possible trap.
📉 I'm watching for a fake breakout and potential reversal targeting the liquidity zones marked below around 3307 and possibly lower.
The liquidity sweep below equal lows could offer a better risk-reward setup.
💡 Conclusion:
If price fails to hold above this breakout and shows signs of rejection, I will be anticipating a return towards the previous demand zone for a liquidity grab.
#XAUUSD #GoldAnalysis #SmartMoneyConcepts #LiquidityGrab #ForexTrading #TrendlineBreak #MarketPsychology #TradingSetup #SMC #PriceAction

Waiting for the Perfect Entry: XAUUSD Market Structure Breakdown🔍 Taking a look at XAUUSD today: it’s clearly in a downtrend 📉 on the 4H chart, with consecutive lower highs and lower lows 🔽.
📌 My bias is bearish, and I’m patiently waiting for price action to set up for an entry 🎯.
If we get a break of market structure 🧱, followed by a retest and failure of the current range high 🚫, that could present an opportunity 👀 — not financial advice ⚠️.

Market Structure Break & Bearish Reaction from Supply Zone.🔍 GOLD – Market Structure Break & Bearish Reaction from Supply Zone
Gold has recently broken its market structure (MSS), which is a significant shift in momentum and a potential indication of a change in the prevailing trend. Following this break, price retraced into a key supply zone, where it was rejected sharply—this rejection came in the form of a strong bearish engulfing candle, highlighting aggressive selling interest.
Interestingly, the market has now printed a second consecutive bearish engulfing from the same zone. This is a powerful signal that sellers are active and defending this level, making it a valid and confirmed short-term resistance zone. The repeated rejection suggests that smart money or institutional sellers may be positioned here.
Given this price action, we can anticipate a potential retracement from the current levels. The most probable downside target for this retracement would be the Fair Value Gap (FVG) that has been marked on the chart. If price respects the FVG and reacts bullishly from there, we may then see a resumption of the uptrend, possibly taking price higher again.
This setup presents a good opportunity for both short-term intraday traders and swing traders to watch for confirmation signals before entering the trade.
📌 Key Takeaways:
MSS indicates shift in trend
Consecutive bearish engulfing candles from supply zone
Sellers likely active in this area
Potential retracement toward marked FVG
Possible bullish continuation from FVG zone
🚨 As always, Do Your Own Research (DYOR) and manage your risk accordingly before making any trading decisions.
