The trend has not changed, go long and look for new highs#XAUUSD
Gold fluctuated at a high level in the Asian session, and the market has not yet taken a clear direction. Despite the current market conditions being extremely flat, caution remains regarding the potential for wider volatility after a breakout above key levels. The current short-term resistance area above gold is 3400-3410. With the breakthrough of yesterday's high today, the short-term support level will also move up. The middle track of the Bollinger band at the hourly level below has also risen to around 3390. The focus of the European session is whether gold can effectively break through the short-term suppression. If the European session is under pressure and encounters resistance, then gold may have a correction. It can be considered to retreat to the 3390-3378 area below and stabilize before lightly long gold to see new highs. Be wary of potential black swan events on Friday.
Xauusdupdates
Gold (XAU/USD) 4H Institutional Outlook — August 8, 2025Overview
As of writing, XAU/USD is trading around $3,392.30 in the 4-hour session, holding firmly above the $3,370–$3,380 support shelf. The recent price action reflects ongoing bullish momentum, driven by escalating geopolitical risks, weak U.S. labor market data, and renewed safe-haven flows after the announcement of U.S. tariffs on gold bars.
This analysis outlines the primary institutional Buy and Sell Zones for the day, based on Smart Money Concepts (SMC), ICT methodology, Order Block/FVG confluence, and 4H price structure. All zones presented are execution-ready and supported by multi-layered validation from institutional frameworks.
✅ Current Price Context
Live Price (XAU/USD): $3,392.30 (as of ~03:00 UTC)
Structure: Bullish (Higher Highs and Higher Lows)
Bias: Bullish, with continuation toward $3,420+ likely if key support holds
Recent High: ~$3,410
Key Support Base: $3,375–$3,385
The bullish market structure remains intact with strong institutional displacement legs to the upside and well-defined liquidity targets still in play above $3,420.
🔍 Institutional Trade Zones (4H)
🟩 Primary Buy Zone (Execution-Ready Long Setup)
Entry Range: $3,375 – $3,385
Stop Loss: Below $3,370 (beneath liquidity shelf and unmitigated OB)
Target 1: $3,420 (1.272 Fib extension)
Target 2: $3,450 (1.618 Fib extension)
Confluence Factors:
Unmitigated Demand Order Block (RBR)
Embedded Fair Value Gap following impulsive buy-side displacement
0.705–0.79 OTE retracement zone from latest swing
Liquidity sweep under equal lows at ~$3,370
Volume imbalance supports continuation from this zone
Located within Discount territory of internal swing
Overlaps with Asia–London Kill Zone
➡️ This zone offers the highest confluence of institutional logic today and is nominated as the Golden Zone.
🟥 Primary Sell Zone (Countertrend Reversal Setup)
Entry Range: $3,415 – $3,425
Stop Loss: Above $3,430
Target 1: $3,380
Target 2: $3,350
Confluence Factors:
Fresh Supply Order Block (DBD) at premium pricing
Presence of FVG following sell-side displacement
0.705–0.79 OTE retracement from bearish leg
EQH liquidity resting just above entry
Strong rejection wicks during NY session
Volume imbalance confirms sell-side aggression
New York Kill Zone alignment
⚠️ Consider only if price cleanly enters the upper premium zone and shows rejection or sweep behavior.
🟨 Fallback Buy Zone (Contingency Setup)
Entry Range: $3,365 – $3,370
Stop Loss: Below $3,360
Target: $3,385 → $3,395
Confluences:
Secondary Demand OB
Partial FVG
In Discount territory
Liquidity resting just below $3,365
Volume tapering indicates absorption
Use only if Primary Buy Zone is invalidated via strong stop-run or displacement.
🟥 Fallback Sell Zone (Contingency Setup)
Entry Range: $3,430 – $3,435
Stop Loss: Above $3,440
Target: $3,400 → $3,380
Confluences:
Lower timeframe mitigation zone
FVG within premium zone
Above EQH liquidity
Fulfills repricing logic after overextension
Valid only if the primary sell zone is invalidated by sweep and reversal pattern confirmation.
🌐 Institutional Sentiment Confirmation
Reuters confirms gold reached multi-month highs due to tariff-induced safe-haven flows
FXStreet reports gold holds above the 20-day EMA with a bullish intraday structure
FXEmpire technicals target $3,450–$3,500 extension zones if bullish pressure sustains
COT positioning and fund flows show continued institutional interest in gold longs
🔔 Final Notes for Execution
Allow price to retest and react within the zone before entering.
Prefer entries during Asia-London or London-NY Kill Zones
Avoid market chasing — wait for confirmations such as sweep → displacement → mitigation

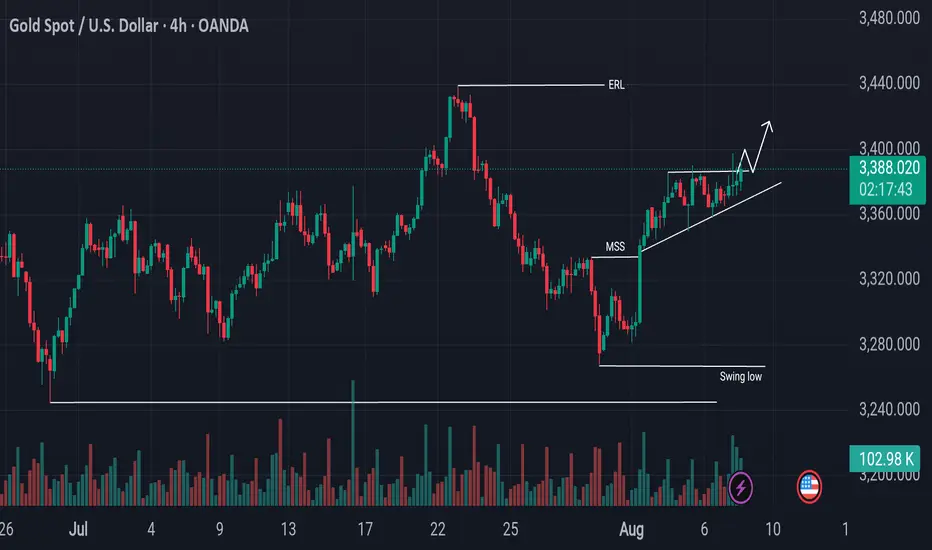
Bullish Shift in Gold Breakout in Sight?The gold market has recently confirmed a Market Structure Shift (MSS), signaling a bullish transition in the current trend. Price action is currently moving upward but has entered a key engulfing sell zone, where sellers have previously shown strong interest. The market is now testing a significant resistance level around 3385, which has temporarily capped further upside momentum.
If a decisive candlestick closes above the 3385 resistance zone, it could confirm bullish strength and open the door for a potential continuation to the upside. In such a scenario, a retest of the broken level may provide a high-probability entry point for further bullish targets, as the market aims to sweep higher liquidity levels.
As always, Do Your Own Research (DYOR) before making any trading decisions. Market conditions can shift rapidly, and risk management remains essential.
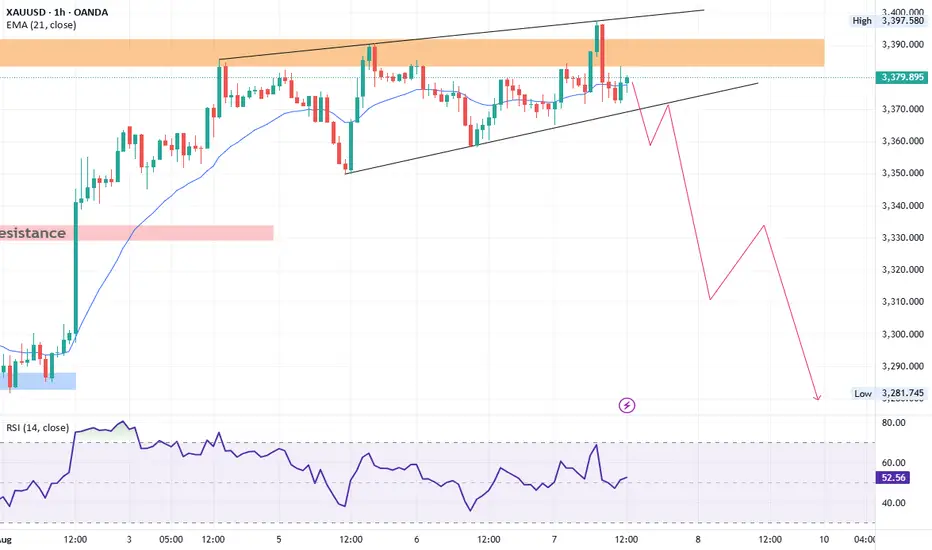
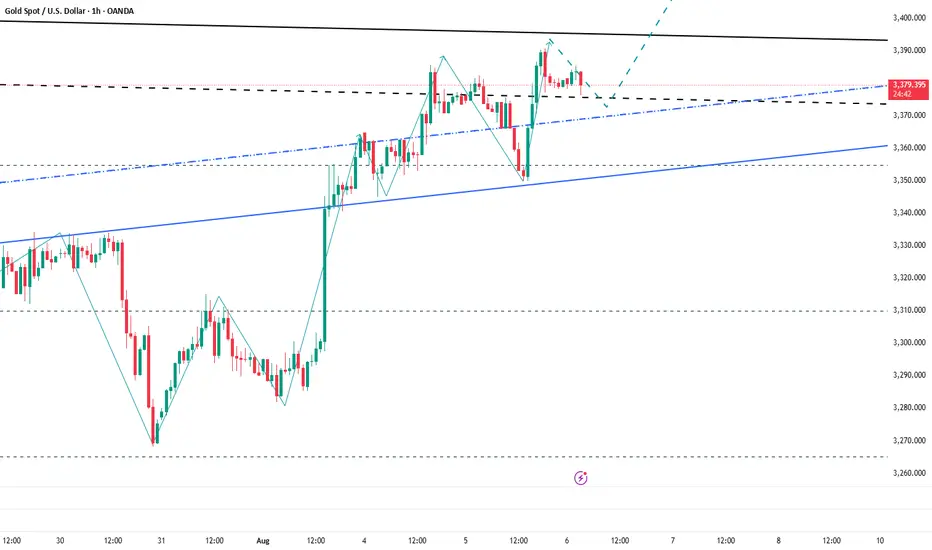
XAUUSD Technical AnalysisGold is currently trading within a rising wedge pattern on the 1-hour chart. The price recently touched the upper trendline of the wedge and faced a strong rejection, indicating bearish pressure. If the price breaks below the lower boundary of the wedge, it will likely trigger a sharp bearish move.
Key downside targets after a confirmed breakdown are:
3340
3300
3270
If Gold drops below 3270, the next significant support lies at 3250 on the daily chart. A daily close below 3250 will confirm a shift in the medium-term trend, opening the path toward the 3000 psychological level.
OANDA:XAUUSD
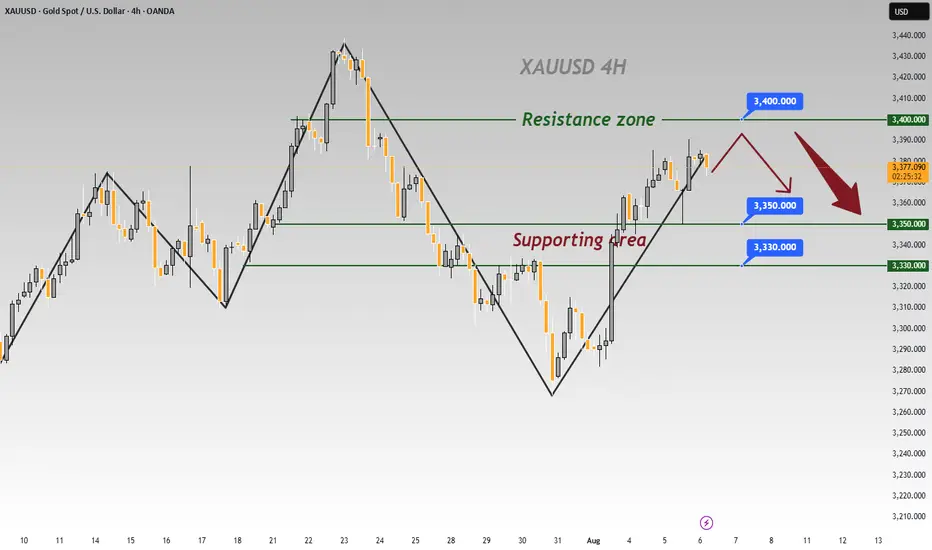
8/7: Continue to Focus on SellingGood afternoon, everyone!
During today’s session, gold successfully moved into the anticipated resistance zone of 3386–3398, and encountered significant selling pressure near 3398, resulting in a retracement to around 3372. While the price action aligned with prior expectations, the delayed timing has led to a bearish shift in the technical structure, which may hinder further upside momentum for the bulls.
That said, important economic data will be released during the US session later today. We’ll need to observe whether bulls can leverage the potential catalyst to break through the current resistance levels.
⚠️ Trading Strategy Recommendation:
Regardless of the data outcome, it is advisable to maintain a bearish bias in subsequent trades.
From a technical standpoint, the higher the price climbs, the greater the probability of a pullback, making short positions relatively less risky.
📌 Reference Range:
Continue to monitor and trade within the key zones outlined yesterday, adjusting entries and exits as per intraday developments.

Gold (XAU/USD) - 2H Wave Setup + Scalp Opportunities# 🔻 Gold (XAU/USD) - 2H Wave Setup + Scalp Opportunities Ahead
**By: Mohsen Mozaffarinezhad**
📅 August 7, 2025 | ⏰ Valid through August 8 (End of NY Session)
⏱ Timeframe: 2H
📌 Method: Elliott Wave + Supply/Demand + SSL Hybrid Confirmation
---
## 🧠 Market Context:
Price has completed a **strong bullish leg** and is currently forming a classic **(a)-(b)-(c)** corrective pattern. We are now between **point (b)** and the potential completion of **(c)**. The broader market is expected to **retest the lower demand POI**, possibly before resuming the uptrend.
---
## 🔎 Technical Highlights:
- 📉 Bearish correction in progress: (b) → (c)
- 📦 Major **Supply** above 3,390 – acted as rejection point
- 🟦 Strong **Demand Zone**: 3,345 – 3,320
- 🔁 Price forming a potential **ABC correction**
- 🔔 **Point of Interest (POI)** near 3,350 may offer entry confirmation
- 💠 **SSL Channel**: Currently bearish crossover
- 🔄 **RQQ, HT, MACD, RSI**: Bearish/neutral, waiting for reversal signals
- 📊 **Volatility (Vol %ile)**: 67%
- 🎯 **ATR**: 13.52 (2H – medium range)
- 🧯 **Risk Level:** Normal
---
## 🟢 Scalp Strategy:
Scalp traders can take advantage of both micro-swings at **points (a) and (b)** using lower TF (M5/M15) confirmations:
### 🎯 Scalp Buy:
- 📍 Entry: Near 3,345–3,350
- 🛑 SL: Below 3,340
- 🎯 TP: 3,365–3,370 (short-term liquidity sweep)
- ⚠️ Only on bullish SSL + RSI divergence (M5)
### 🎯 Scalp Sell:
- 📍 Entry: Near 3,375–3,380 (**point b rejection**)
- 🛑 SL: Above 3,385
- 🎯 TP: 3,360 then 3,350
- ⚠️ Use Heikin-Ashi reversal + SSL confirmation
---
## 📌 Mid-Term Outlook (Swing):
If price reaches **point (c)** around the **lower demand zone** and reacts with bullish structure (BOS, CHoCH), we anticipate a strong rally toward:
- **TP1:** 3,385
- **TP2:** 3,400
- **TP3:** 3,420 (next macro supply)
---
## ⚠️ Notes:
> This setup remains **valid until the end of NY session, August 8**.
> Wait for **clear confirmation** before execution.
> All scalps are suggested with **tight risk management**.
_Analysis by Mohsen Mozaffarinezhad | Educational Purposes Only_
---
#gold #xauusd #elliottwave #supplydemand #sslhybrid #scalping #smartmoney #tradingview #forexanalysis

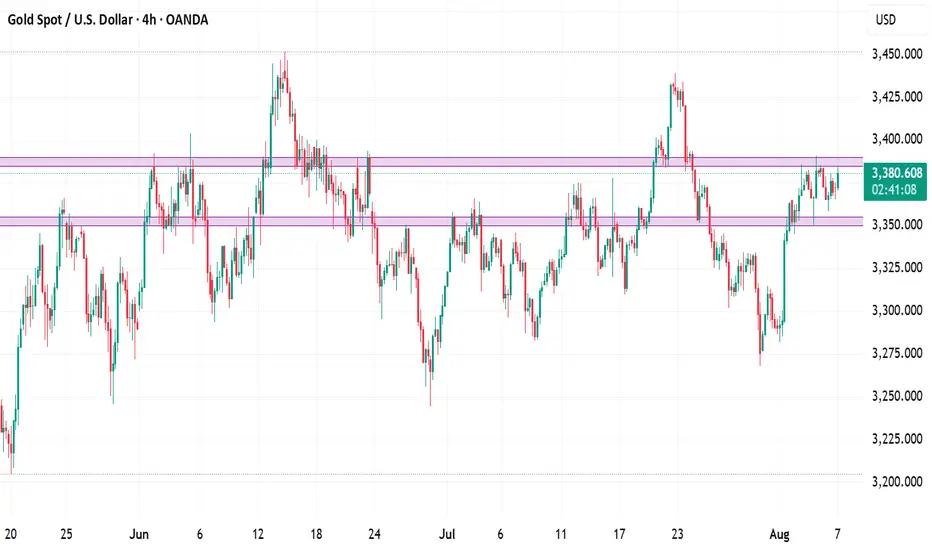
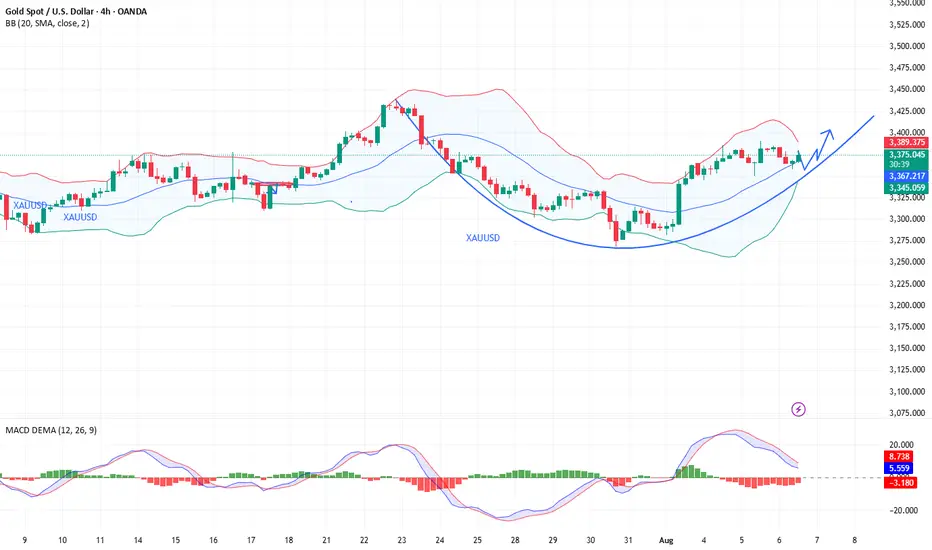
XAUUSD - 3400Technical picture
Bullish momentum is strengthening: US jobs shortage has caused an influx into safe havens, which has contributed to gold's growth
A reversal signal is forming: a bounce from the lower line of Bollinger Bands is observed, and a bullish cross of EMA-8 and EMA-21 is also forming, plus a moderately positive MACD - a classic "buy on dip" entry pattern
Key levels:
Support: around $3,330 - a support zone coinciding with the 21- and 50-day SMAs. Below — potential for decline to $3,297-$3,283
Resistance: $3,380 — resistance, breakout of which could open the way to $3,440-$3,450
Structural pattern: breakout from triangle to the downside could signal a deeper correction
Industry consensus: Citi has revised its target range up to $3,300-$3,600 in the next three months, based on a weak US economy and rising geo-risk
Meanwhile, HSBC warns of possible weakness — forecast for 2025-2026 from $3,215 to $2,350 in a more bearish scenario

Quarterly Shit Analysis - Sept - Dec 2025 - XAUUSDMy last three quarterly analysis proved correct. In the last analysis, I predicted that gold will move within a range, it did happen.
For the new quarter, here is my new analysis. Between 14 Aug 2025 to 01 Sept 2025, I expect the following:
1- Scenario 1: Bullish Trend
Since May 2025, #XAUUSD has created good bullish indications on the Daily and Weekly Charts. Therefore, it could start a new trend.
Conditions: Gold must close a strong bullish daily candle above 3452 first , then another strong daily bullish candle above 3500. The closure of a strong daily candle above 3452 should happen between 14 Aug to 01 Sept. The closure of the daily candle above 3500 is fine to happen after September 1st.
Targets: If the conditions above are met, Gold will start a new bullish trend. The targets will be: 3668, 3750, 3840 and 4,000 or 4043.
If Gold closes a strong daily candle above 3500, the ideal support lines to buy gold will be 3451, 3400, 3364, 3330 and 3300. The best support line, if Gold makes deep retracements will be 3228 and 3162.
2- Scenario 2: Expanded Range (Likely Scenario)
The range for the previous quarterly analysis was from 2956.5 to 3500, but for most of the past months since May 1st, Gold has been moving between 3262 to 3452. It is possible that Gold remains in the wider range (2956.5 to 3500), but makes wider moves. This scenario is possible because gold already reached a historic high in April and then entered a wide range, therefore it is possible to remain in the same range for the rest of the year.
This means gold could make deeper retracements into 3228, 3168, 3092, and 3024 and then go up towards, 3330, 3364 and 3452. When it reaches 3300, 3364 and 3452, then it starts new bearish moves again.
Conditions: Gold fails to close daily bullish candles above 3500 and fails to close daily bearish candles below 2956.5. The ideal condition is if gold closes a strong daily bearish candle below 3228 or 3162 between 14 Aug to 01 Sept 2025.
3- Scenario 3: Bearish Move (Unlikely Scenario):
If Gold closes a strong daily candle below 2956, then it will start a surprising bearish trend and will move towards: 2812, 2640 and 2550. This is not a likely scenario.

Strike with precision and win in the gold trading market!Gold continues to fluctuate in an upward structure, with lows gradually rising, showing that the bulls are still in a dominant position. The current key support has moved up to the 3360 line. Before this position is effectively broken, the overall idea is to maintain a low-long strategy. It should be noted that the current market has been consolidating at a high level for three consecutive days, and has the basis for further strengthening. It is not advisable to wait for a sharp pullback at this time, but to pay attention to the continuity opportunities of direct pull-ups. It is recommended to seize the strong continuation opportunities in the current period in terms of operations, and strategically postpone it to the European and American trading sessions for simultaneous execution. Specifically pay attention to the long order layout opportunities in the support area of 3375-3360, and the upper resistance is around 3390-3405. Overall, we should flexibly participate in the high-altitude and low-long rhythm in this range. It is recommended to wait and see in the middle position, chase orders cautiously, and wait patiently for key points to enter the market.

The bullish trend remains unchanged, seize the opportunityAfter today's opening, gold continued the bullish trend of yesterday. Judging from the daily line, gold has continued to rise, and it may only be a matter of time before it reaches a higher level. Judging from the 4H chart, the technical indicators are dead cross and shrinking, and the flexible indicators are repairing upward. The short-term middle track support is around 3372, and the upper side pays attention to the short-term pressure of 3395-3405. If the European session fails to effectively break through the short-term resistance, it will give the opportunity to test the 3380-3370 support again. If it is not broken, you can consider continuing to go long.
OANDA:XAUUSD

Bullish Momentum Builds: Gold Set to Challenge 3400 and BeyondAlthough gold encountered resistance again near 3385 in the short term, the retracement has not been effectively continued so far, and the downward momentum is not particularly strong. Gold has always remained above the 3375-3365 area, with strong buying support below and the market bearish sentiment is not serious. In comparison, the bulls still have a considerable advantage!
The current gold price structure clearly maintains a strong bullish trend. With gold reclaiming the 3375-3365 area yesterday, bullish sentiment has further strengthened. As gold's center of gravity shifts upward, multiple strong support areas have formed below, limiting any potential pullbacks and further supporting its upward trajectory. Therefore, as long as gold can maintain above the 3375-3365 area, I believe that gold will definitely refresh the short-term high of 3390 again, and is expected to launch a strong impact on the 3400 mark, and may even continue to the 3420-3430 area.
So for short-term trading, I don’t have much desire to short gold for the time being. I am happy to watch for opportunities to enter long positions after gold retreats to the 3375-3365 area!
Gold – Bulls Hold the Line, Pressure Builds for Upside BreakoutIn yesterday’s analysis, I argued that following Tuesday’s reversal — which printed a strong continuation bullish Pin Bar — buyers had regained control despite the intraday pullback.
For this reason, I suggested looking to buy dips, as the structure remained constructive.
And once again, during yesterday’s session, the scenario repeated itself.
The drop toward the 3360 zone was met with renewed buying interest, keeping the bullish structure intact.
________________________________________
🔍 Technical Context – Higher Lows Building Pressure
At the time of writing, Gold is trading around 3380, a short-term resistance area that has capped gains so far.
However, the technical picture remains bullish:
Starting with Monday’s low at 3340, which came after a strong impulsive leg up, price has printed a clear succession of higher lows.
This behavior strongly suggests increasing buying pressure and builds the case for a potential breakout to the upside.
________________________________________
🎯 Trading Bias – Holding My Long Position
My bias remains bullish.
In fact, I’m currently holding a long position, entered yesterday, which is now running with a 150 pips unrealized profit.
I’m sticking with the trade, anticipating that a confirmed break above 3380–3390 could trigger upside acceleration toward my final target — a 750 pips profit objective.
________________________________________
🔄 What to Watch Next
• Daily close: A close above 3380=3385 zone would add confirmation to the bullish thesis.
• Key support: The zone around 3360 is now support.
• Breakout trigger: A move above 3380–3385 could unleash momentum buying and open the path to higher levels.
________________________________________
Let’s stay patient and let the market confirm the breakout.
Until then, the structure favors the bulls. 🚀
Disclosure: I am part of TradeNation's Influencer program and receive a monthly fee for using their TradingView charts in my analyses and educational articles.

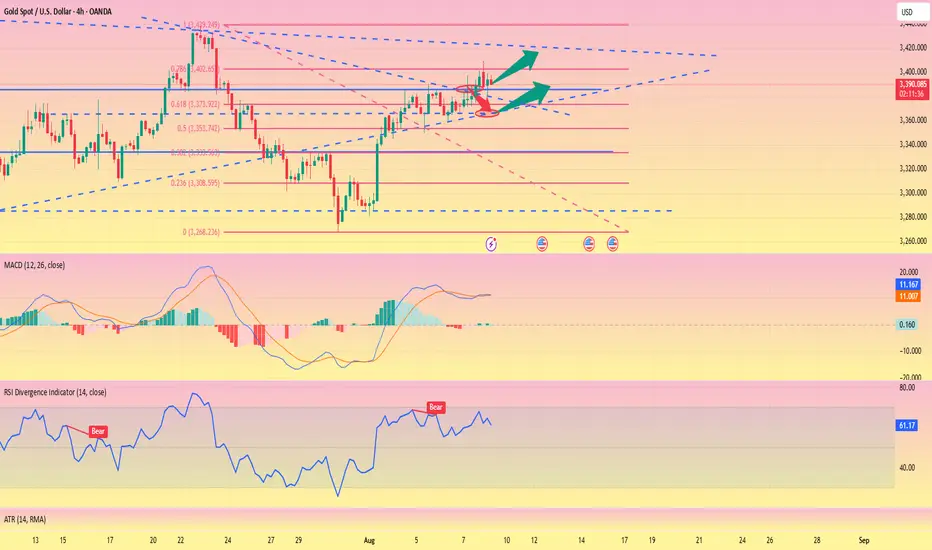
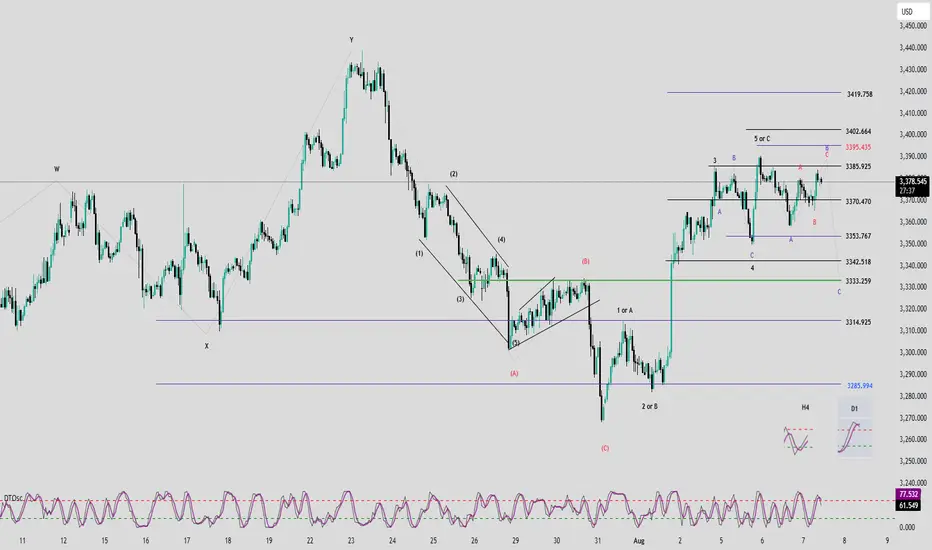
Elliott Wave Analysis – XAUUSD | August 7, 2025📊
________________________________________
🔍 Momentum Analysis:
• D1 Timeframe: Daily momentum is turning bearish, signaling that a medium-term downtrend may have already started and could last until mid-next week.
• H4 Timeframe: Momentum is rising, but the slope of the two momentum lines is relatively flat → indicating weak bullish strength. We should closely watch the overhead resistance zones.
• H1 Timeframe: Momentum has entered the overbought zone → a short-term reversal is likely, especially near the 3386 level.
________________________________________
🌀 Elliott Wave Structure:
• Based on the bearish momentum shift on the D1 chart, we expect the market is entering an ABC corrective pattern (in green).
• Currently:
o Wave A is completed.
o Wave B is in progress.
• Since Wave A appears to be a 3-wave structure, Wave B may unfold as a flat correction. In that case, potential target zones for Wave B are:
o 3385
o or 3395 → these are the key resistance levels to monitor.
• Within Wave B (green), we observe an internal 3-wave ABC structure (in red), where:
o Wave C (red) may reach:
3386
or extend toward 3395
→ In alignment with the D1 momentum signal, 3386 is considered a potential entry point for a short position.
________________________________________
📈 Trade Plan:
• SELL Zone: 3386 – 3389
• Stop Loss: 3397
• Take Profits:
o TP1: 3370
o TP2: 3353
o TP3: 3333
Institutional Gold Strategy Note – August 7, 2025🔍 Executive Summary
Gold (XAU/USD) continues to hold firm above the $3,370 handle, supported by a bullish macro narrative and confirmed technical structure on the 4-hour chart. Amid dovish expectations from the Fed and soft labor market data out of the U.S., bullion maintains its premium as a hedge, attracting institutional flow in line with the rate-cut narrative for Q3–Q4.
Today’s market profile suggests a high-probability long setup, anchored in a fresh demand structure just below current price, supported by unmitigated institutional order flow, premium discount levels, and clear liquidity sweeps.
🎯 Directional Bias: Bullish–Transitional
While price is consolidating around $3,378, the underlying structure favors a bullish continuation. A Change of Character (CHoCH) has been confirmed on the 4H chart, suggesting a shift from corrective to impulsive intent. Liquidity remains stacked below recent equal lows, and the premium-to-discount array strongly favors buy-side execution.
🟩 Primary Buy Zone (GOLDEN ZONE)
Entry: $3,350–$3,355 | Stop-Loss: < $3,340 | Targets: $3,400 / $3,430
This zone represents the highest institutional quality setup of the day. It aligns with:
A fresh unmitigated Rally-Base-Rally Demand Zone
A refined Bullish Order Block within optimal trade entry (OTE) discount range
A Fair Value Gap (FVG) aligned with internal BOS leg
Equal Lows (EQL) sweep below $3,355, targeting liquidity
Overlap with volume imbalance, suggesting a clean institutional leg
Clear CHoCH confirming bullish structure
Kill Zone Alignment: Asia–London overlap, pre-London accumulation
This zone is statistically favored for execution by both Smart Money and legacy institutions, given its confluence density and asymmetrical risk profile.
🟥 Primary Sell Zone
Entry: $3,385–$3,390 | Stop-Loss: > $3,400 | Targets: $3,350 / $3,320
A valid counter-trend liquidity sweep opportunity, located above short-term equal highs near the psychological $3,400 level. Key confluences include:
Drop-Base-Drop Supply Zone
Overlapping FVG + OB in premium zone
Alignment with OTE premium retracement
Liquidity cluster near recent EQH
Structural resistance + round-number magnetism
Execution window during London–NY overlap
This zone is valid only for short-duration scalps or short-term reversal positioning.
🟢 Fallback Buy Zone (If Primary is invalidated)
Entry: $3,320–$3,325 | SL: < $3,310 | TPs: $3,400 / $3,430
A deeper mitigation zone with reduced confluence but adequate historical support. This zone captures:
A mitigated OB inside Demand
0.618 Fib retracement from internal BOS
Liquidity sweep potential of a broader EQL stack
Minor structure support
Use only if the market sweeps the primary zone and rebalances deeper.
🔻 Fallback Sell Zone (If Primary Sell fails)
Entry: $3,410–$3,415 | SL: > $3,420 | TP: $3,350
Set well above prior resistance, this extended zone aligns with:
Extended Supply + Unmitigated OB
FVG inside premium OTE zone
Recent accumulation liquidity trap (potential fakeout zone)
Session mispricing during NY–Asia rollover
Use only if price impulsively breaches the $3,400 psychological barrier and stalls near the top of an exhaustion leg.
🌐 Institutional Cross-Validation
Citi Group has upgraded its 3-month Gold forecast to $3,500, citing weakening U.S. macro data and elevated inflation expectations as bullish catalysts.
Reuters and FXStreet confirm Gold's hold near 1-week highs with sentiment strongly skewed toward continued demand amid Fed rate-cut odds exceeding 90%.
TradingView pro charts show confluence with OB/FVG zones at both $3,355 and $3,390, validating both primary zones technically.
📌 Final Notes
Action Bias:
Aggressively long from $3,350–$3,355 with tight structure-defined invalidation.
Hold shorts only from $3,385–$3,390 under strict reversal logic.
Risk Reminder:
All zones are built from 4H structural flow only. Intraday volatility outside kill zones may distort price behavior — wait for displacements and internal breaks before entering. Manage partials at 1.272 extension and hold runners toward 1.618 only if structure confirms.
XAUUSD LONG SETUPhere we go again⏰
Analysis
>Monday price closed in breakout off previous week Friday's high making it day 2 of breakout.(friday was day 1 of breakout)
>Tuesday price closed as a fake out high.
>Wed price closed inside Tuesday price range (inside bar/day) 💰
>The fib retracement is based off Tues range and shifted to have its center at tues high.The values are based off hipoplaka's goldbach values with a little twist
anticipating the continuation of the bull trend: previous month high or all time high?

Gold Price Trend Analysis and Trading Guidance (Exclusive)📣📣📣A technical analysis of gold's recent performance reveals that it has formed a four-day winning streak, demonstrating the strength of the upward trend and indicating that short-term upside potential has not yet been exhausted. Of note, the upper Bollinger Band at 3430 on the daily chart is acting as a key resistance level, and this level is likely to be tested this week. However, when it comes to a sharp rise in the market, there is no clear signal at present. We need to wait for the opening pattern of the daily Bollinger band to be confirmed before we can open up a new round of upward space.🧐🧐🧐🤔🤔🤔
Switching to the H4 cycle for observation, the unilateral upward trend continues to consolidate, the moving average system shows a perfect upward divergent arrangement, the Bollinger Bands simultaneously maintain an open state, and a short-term high pressure is formed near the upper rail of 3415. Based on this, the bullish logic for gold remains unchanged on Wednesday, with the intraday high range likely to be between 3415 and 3430. There's no need to overestimate whether the price will break through previous highs at this point, and trading strategies should be adjusted dynamically based on real-time market performance. From a short-term perspective, intraday support should focus on two key levels: 3360 and 3350.
👊👊👊On the operational level, it is recommended to adopt a strategy of placing long orders in batches when the price falls back to the 3365-3360 range, relying on the support level to seize the opportunity of trend continuation.⭐️⭐️⭐️
⚠️⚠️⚠️The market is risky, so participate rationally. If you need real-time trading references and trading advice, please leave a message to Charlie.🛫🛫🛫 FOREXCOM:XAUUSD VELOCITY:GOLD PEPPERSTONE:XAUUSD CMCMARKETS:GOLD ICMARKETS:XAUUSD CMCMARKETS:GOLD FXOPEN:XAUUSD
XAUUSD – Bears Gave It a Shot, But Bulls Still in Control1. Quick recap of yesterday
In yesterday’s analysis, I highlighted the possibility of a short-term correction on Gold and noted that, although risky, a short trade could be justified. Acting on that conviction, I took a short with a sniper entry, capturing over 250 pips in floating profit. However, Gold found strong support around 3350 and reversed aggressively. I closed the trade with a more modest +140 pips gain.
2. Key development: NY session reversal
Despite early signs of weakness, the New York session flipped the script, sending Gold back toward the top of the daily range. The daily close near highs tells us one thing:
➡️ The bulls aren’t done just yet.
3. Technical outlook
• Resistance remains firm at 3375–3380+ zone
• A clear breakout above this zone opens the door for 3400+, with a likely magnet at 3430
• As long as the market holds above this week’s low, dips are buyable opportunities
4. Trading plan
For now, the bias shifts back to the long side. I’m watching for intraday dips to build longs, with invalidation below this week’s low. The structure favors continuation — but only if 3380 gives way we have confirmation.
5. Final thoughts
Gold may have teased the bears, but the real power still lies with the bulls. If momentum kicks in above 3380, we could be on our way to test 3430 soon. 🏹
Disclosure: I am part of TradeNation's Influencer program and receive a monthly fee for using their TradingView charts in my analyses and educational articles.

Gold (XAU/USD) 4H Institutional Analysis — August 6, 2025As of August 6, 2025 (12:23 UTC), Gold (XAU/USD) is trading around 3,367.60, according to Kitco’s live spot price feed. After a sustained bullish recovery from the 3,320–3,330 demand zone, gold finds itself at a structural inflection point. Institutional footprints across the board — from order blocks to liquidity maps — are signaling one dominant message: the bulls are setting the stage.
In today’s breakdown, we deliver a high-conviction execution plan using a fusion of Smart Money Concepts (SMC), ICT methodology, and 4H structural dynamics — isolating only the strongest Primary Buy and Sell zones, along with their fallback counterparts. At the center of this framework is our Golden Zone, the most institutionally-aligned, high-probability area of the day.
🔍 Market Structure & Directional Bias
The 4-hour chart has shown a clear Change of Character (CHoCH) to the upside after a bullish Break of Structure (BOS) above the 3,355 level. This signals a phase shift from consolidation into accumulation and potential expansion, likely aiming toward the 3,400 psychological magnet and beyond.
The presence of volume imbalances, fair value gaps, and unmitigated order blocks across multiple structural layers further supports a bullish directional bias. Liquidity has been swept below previous equal lows (EQL), creating an environment ripe for institutional accumulation.
Directional Bias: Transitional → Bullish
🎯 Primary Execution Zones
✅ Primary Buy Zone (Golden Zone) — 3,355 to 3,360
This zone represents the highest-quality long opportunity on the chart today. Sitting in the discount array (below 50% of recent swing), the zone is built on a fresh Rally-Base-Rally (RBR) demand structure formed after a decisive CHoCH.
The 3,355–3,360 range aligns with a valid unmitigated Order Block, an embedded Fair Value Gap, and an OTE retracement between 0.705–0.79 Fib levels. Beneath this zone lies a sweepable liquidity pocket just under 3,350, further increasing the magnetism of the area.
Entry: 3,355–3,360
Stop Loss: Below 3,350 (liquidity invalidation)
Take Profits:
TP1: 3,395–3,400 (1.272 extension)
TP2: 3,420 (1.618 extension)
Confluences: RBR Demand, OB, FVG, OTE, Volume Imbalance, EQL Sweep, Discount Array, Structural Support
Kill Zone Timing: London-NY Overlap
✅ Golden Zone of the Day
✅ Primary Sell Zone — 3,395 to 3,400
While the broader bias is bullish, gold remains capped by a strong Drop-Base-Drop (DBD) supply zone around 3,400 — also the 1.272 fib extension from prior bullish legs. A pocket of equal highs (EQH) just above 3,405 serves as a liquidity magnet and stop-loss hunting zone — making this supply level extremely attractive for short-term reversion plays.
Entry: 3,395–3,400
Stop Loss: Above 3,405
Take Profits:
TP1: 3,360
TP2: 3,350
Confluences: DBD Supply, OB, FVG, OTE Retrace, EQH Sweep, Premium Array, Structural Resistance
⚠️ Secondary Execution Zones (If Primary Fails)
🟢 Fallback Buy Zone — 3,325 to 3,330
If the market manipulates lower and invalidates the primary buy zone with a deep liquidity sweep, this deeper zone offers a second chance. It contains a secondary demand block, a valid FVG, and lies cleanly within a deep discount retracement.
SL: Below 3,320
TPs: 3,360 and 3,380
🔴 Fallback Sell Zone — 3,445 to 3,450
If gold breaks cleanly above 3,405, likely invalidating the primary sell idea, the next institutional level of interest is 3,445–3,450 — sitting on a higher timeframe premium OB and major liquidity shelf.
SL: Above 3,455
TPs: 3,395 and 3,370
🌐 Institutional Consensus: Bullish Convergence
Institutional analysts across major platforms confirm a bullish bias, with targets hovering around the 3,400–3,420 area:
Reuters reports that gold is near a one-week high, supported by weaker U.S. data and increased rate-cut bets.
MarketPulse highlights the “return of the bulls” amid sustained momentum and light CPI expectations.
Citi has raised its medium-term gold target to $3,500, citing negative U.S. macro headwinds.
TradersUnion confirms support at 3,320 and resistance at 3,400 — mirroring our execution levels.
There is no significant divergence in sentiment or structure, validating today's trade zones with confidence.
📌 Final Thoughts
In a liquidity-driven market, price is engineered — not discovered. Today, that engineering points to one thing: 3,355–3,360 is the Golden Zone — the strongest execution area, supported by eight institutional confluences, favorable structure, and widespread sentiment confirmation.
Gold has re-entered its institutional kill-box. The next move? Likely engineered to deliver smart money profits while trapping the uninformed. Don’t chase price. Let it come to your zone. Execute with discipline.

The bullish outlook remains unchanged, go long with the trend!Yesterday, the gold bulls refreshed the high point, and the daily line closed in the form of a medium-sized Yang line with a long lower shadow. The idea of continuing to be bullish in the short term remains unchanged, and what needs to be paid attention to is the strength of the retracement, which is similar to yesterday. The current support below is maintained at the 3355-3350 line of yesterday's rise. This position is also today's key support level, and the key suppression point above is maintained at the integer level of 3390-3400. This position may not be the end point. It was also mentioned yesterday that under the range of the previous large range of fluctuations, if either side does not break through, it will likely continue to fall into fluctuations. The current bullish trend is still relatively obvious, so we still maintain the idea of low-long operations. If your current operation is not ideal, I hope I can help your investment avoid detours. Welcome to communicate!
From the 4-hour analysis, the important support below is the 3355-3350 line. If the daily level stabilizes above this position, the bullish rhythm of falling back to lows and buying on the trend will remain unchanged. Before the daily level falls below the 3350 mark, you need to be cautious about shorting against the trend. I will provide you with the specific operation strategies at the bottom, please pay attention to them in time.
Gold operation strategy: Go long on gold when it retraces to around 3360-3350, target 3375-3385 area, and continue to hold if it breaks through.

gold awaiting breakout#XAUUSD we wait for breakout below 3363-61 to sell, expected target 3335.
Below 3363-61 on m15-m30 closure holds bearish continuation, target 3335, stop loss 3373.94.
Possible move above 3378 then we await for 2 times breakout to buy, target 3399.

Gold - Intraday Long Setup (5M TF) | Smart Money + Elliott Struc# 🟢 Gold - Intraday Long Setup (5M TF) | Smart Money + Elliott Structure
**Pair:** Gold Spot / USD
**Timeframe:** 5M
**Session:** London / NY Overlap
**Type:** Intraday Long Idea
**Concepts:** Smart Money, Supply & Demand, Wave Analysis, SSL Confirmation
---
## 🔍 Market Context
The market is currently reacting inside a **key Demand Zone** on the 5-minute timeframe, following a strong bearish move during the London session. The structure suggests a corrective **ABC wave formation**, where the **(c) point** appears to be forming a potential higher low at demand.
- Point **(a)**: Marked the first impulse down
- Point **(b)**: Rejection at minor **Supply Zone**
- Point **(c)**: Retest of **POI at Demand**, showing signs of exhaustion in selling pressure
---
## 📈 Technical Confluences
- 🟦 **Demand Zone** active and respected
- 📏 Potential BOS (Break of Structure) upon break of the recent high
- 📊 **Vol %ile** = 83% → Above average participation
- ⚠️ Risk Level: High (tight structure, requires confirmation)
- 🧭 Entry Distance: Near
---
## 🔧 Indicators Status (SSL Hybrid)
| Indicator | Status |
|--------------------------|----------|
| SSL Channel | ✅ Bullish cross (supporting reversal)
| RSI (50) | ✅ Holding above midpoint
| MACD | ✅ Bullish crossover (early signal)
| BB Oscillator / HT / RQK | ❌ Still bearish (lagging)
---
## 🎯 Trade Idea
**Bias:** Long
**Trigger:** Break above **minor Supply** and formation of BOS
**Target Zones:**
1. **TP1:** 3,370
2. **TP2:** 3,378 (supply edge)
3. **TP3:** 3,385 (upper supply zone)
**SL:** Below point (c) @ **~3,357**
---
## 🧠 Notes
This setup is valid as long as price holds above the Demand Zone and confirms a bullish shift via BOS. Wait for clear confirmation before entering.
_This is an educational idea based on Smart Money + Elliott Wave principles – not financial advice._
---
#gold #smartmoney #supplydemand #elliottwave #sslhybrid #intraday #5mtf #tradingview

The market trend is still there, go long on the pullback#XAUUSD
Yesterday, gold experienced a V-shaped reversal: it was blocked at the 3382 line in the morning and then fluctuated and fell, then it fell to the support near 3349 and stabilized and rebounded, then rebounded to near 3390 in the evening and closed with a doji on the daily line. Judging from the overall trend, the bullish pattern has not changed.
Gold has limited room for decline in the short term, and a sharp drop is unlikely. Today's market tends to adjust and correct first before continuing to rise. The adjustment is only short-term, and is more to give everyone enough opportunities to get on board. The focus of the market below is 3375-3360, with the target looking at yesterday's high around 3390-3395. A break is expected to extend to the 3400-3420 area.
🚀 BUY 3375-3360
🚀 TP 3390-3395

Gold: Yesterday’s Surge & Today’s Session StrategyDuring yesterday’s U.S. trading session, gold surged to around 3390 🚀, driven by a series of tariff-related remarks from Trump, Fed personnel changes, and market expectations that the probability of a September rate cut has risen to 91% ⚡️. We successfully took profit near 3355 yesterday, locking in close to maximum gains 💰.
Today’s trading strategy:
Go short at highs during the Asian session 📉
Go long at lows during the European session 📈
Go short at highs again during the U.S. session 📉
⚡️⚡️⚡️ XAUUSD ⚡️⚡️⚡️
🚀 Sell@ 3390 - 3380
🚀 TP 3375 - 3366 - 3356
Daily updates bring you precise trading signals 📊 When you hit a snag in trading, these signals stand as your trustworthy compass 🧭 Don’t hesitate to take a look—sincerely hoping they’ll be a huge help to you 🌟 👇