Gold is still in rangeGold, the general trend is as described in the continuous analysis. The price has fallen from the historical high of 3500 to 3120 in the first round this year. After rising to 3452, it is currently in the second round of downward cycle. The mid-term top idea is maintained, and the operating target is 3120;
The non-agricultural data at the end of last week was under pressure at 3365, and it dropped to 3296 on Monday and rebounded. It broke the high overnight, and the daily chart closed positive. The K-line combination is in a volatile arrangement. In the short term, it will maintain consolidation below 3365; short-term support is 3330-3326, and strong support is 3320-3316; short-term resistance is 3350-3358, and strong resistance is 3365;
Xauusdupdates

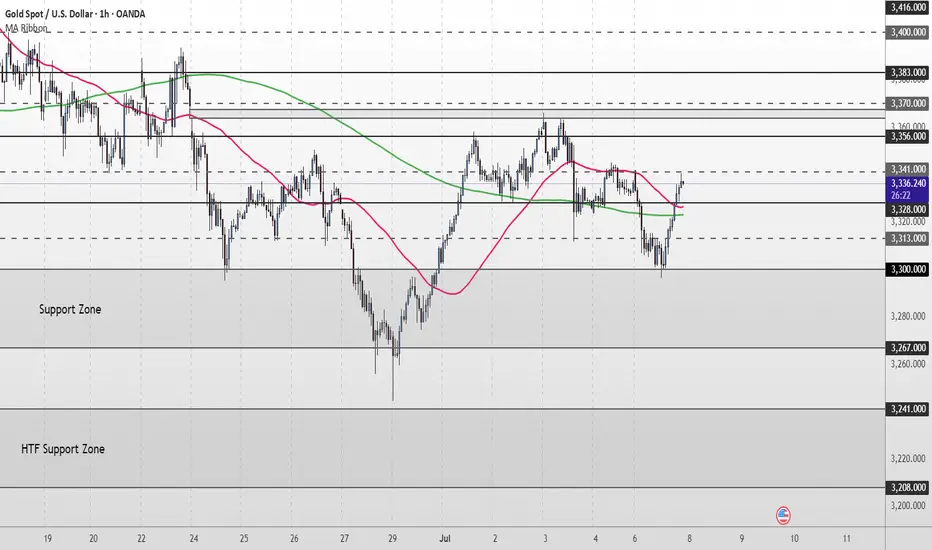
Gold Short Term OutlookGold dipped earlier in the session as the $3,328 support level failed, pushing price into the upper boundary of the broader Support Zone. From there, we’ve seen a strong bounce, with price now trending around the $3,341 minor resistance.
Price has reclaimed both the 50MA and 200MA, suggesting bullish momentum may be returning. A clean break and hold above $3,356 would likely open the path toward higher resistance levels, including $3,370 and $3,383.
However, failure to break and hold above $3,356 could lead to another pullback toward the Support Zone. If that zone fails to hold, we may see a deeper move into the higher timeframe (HTF) support area below $3,300.
📌 Key Levels to watch:
Resistance:
$3,356 ‣ $3,383 ‣ $3,400 ‣ $3,416
Support:
$3,328 ‣ $3,300 ‣ $3,267 ‣ $3,241 ‣ $3,208 (HTF Support)
Tuesday Outlook on Gold (XAU/USD)
After Monday’s move into the 4H Fair Value Gap and rejection near the trendline and Asia High, I’m expecting a corrective move to start Tuesday.
I’m currently watching two possible downside targets:
🔸 Scenario 1: A short-term drop into the upper part of the 4H FVG (around 3320–3310) – this zone could act as intraday demand and cause a quick bounce.
🔸 Scenario 2: A deeper retracement toward the unfilled imbalance around 3290–3280, lining up with the London Low and completing the 4H FVG.
This would be a more significant liquidity sweep before a potential bullish reaction.
From both zones, I’ll be looking for price action to confirm a possible long setup back toward the trendline and above.
Let’s see how Tuesday plays out.

90-day tariffs expire, how to position gold next week📰 News information:
1. 90-day tariffs are about to expire
📈 Technical Analysis:
With the Trump administration's massive tax cut and spending bill officially implemented, the U.S. Treasury may start a "supply flood" of short-term Treasury bonds to make up for the trillions of dollars in fiscal deficits in the future. Concerns about the oversupply of short-term Treasury bonds have been directly reflected in prices. The yield of 1-month short-term Treasury bonds has risen significantly since Monday this week. Slowing wage growth, falling total work hours, stagnant wage income growth and concerns about consumer spending are all signs that support gold.
From a technical perspective, Friday's closing long shadow small candle body, the price closed at a high of 3345 and a low of 3224. The overall idea for next week is to follow the trend and rely on the first short-term support of 3323 below to participate in long positions. Secondly, 3315-3305 is given below. If the support point is lost, then 3300 below is also in danger, and there is no need to overly insist on continuing to do more at low levels in the short-term rhythm. The key pressure above is 3340-3350, and the limit is the pressure of 3360 above.
🎯 Trading Points:
BUY 3325-3323
TP 3333-3340-3350
BUY 3315-3305
TP 3325-3333-3340
In addition to investment, life also includes poetry, distant places, and Allen. Facing the market is actually facing yourself, correcting your shortcomings, confronting your mistakes, and strictly disciplining yourself. I hope my analysis can help you🌐.
FXOPEN:XAUUSD PEPPERSTONE:XAUUSD FOREXCOM:XAUUSD FX:XAUUSD OANDA:XAUUSD TVC:GOLD

GOLD TODAYHello friends🙌
🔊Due to the weakness of buyers and the strength of sellers, the price continues to fall...
We have identified two supports for you that will not be seen if the price continues to fall, and if the selling pressure increases, we will update you.
🔥Join us for more signals🔥
*Trade safely with us*

Gold: update hello friends✋️
According to the recent growth of gold, you can see that it is constantly resisting and forming a falling pattern.
For this reason, it can be a warning that the fall can continue and the price will fall to the specified limits.
🔥Follow us for more signals🔥
*Trade safely with us*

XAU/USD – 45-Minute Chart Breakdown **Date:** July 7, 2025 # 📊 XAU/USD – 45-Minute Chart Breakdown
**Date:** July 7, 2025
**Current Price:** $3,326.97
**Bias:** 📈 Bullish Breakout
---
## 🔹 Key Market Structure:
- **Trendline Breakout**: ✅
Price broke cleanly out of the descending trendline that had held since the $3,362 high.
- **LL → HL Shift**:
The structure is transitioning from Lower Lows to potential Higher Lows (HL) – a strong sign of **reversal**.
- **BOS Zone** (Break of Structure):
BOS has been confirmed; further upside is now **probable**.
---
## 🔸 Trade Zone:
| Type | Level | Description |
|------------|------------|--------------------------|
| **Entry** | ~$3,326 | Breakout confirmation 🔓 |
| **SL** | ~$3,319 | Below recent HL 🛡️ |
| **TP1** | $3,362 | Top of previous range 🎯 |
| **TP2** | $3,385+ | Momentum extension 📈 |
---
## 📌 Indicators & Labels:
- **Structure:** `Bullish` 🟢
- **Efficiency:** `Efficient` ✅
- **MSU:** Bearish (short-term countertrend, being invalidated)
- **VTA:** Active ⚡️
---
## 🧠 Strategy Note:
This breakout is occurring **after a full liquidity sweep** and a **strong bullish reaction** off the $3,290s. Volume is supporting the move and **confluence** builds toward continuation.
> 💬 *"The best trades come when structure, liquidity, and timing converge."* – Let's ride this wave with confidence.
---
### 👑 For Persian Princes of the Market 🇮🇷
We don’t guess. We **track, adapt, and lead**.
---
## 🟢 Potential Breakout from the Descending Channel
As observed in the **45-minute timeframe**, Gold (XAU/USD) has been respecting a classic **descending channel** formed by a sequence of Lower Highs (LH) and Lower Lows (LL), leading to an overall bearish structure.
However, in the latest candles, price has **broken above the upper boundary of the channel**, signaling a potential shift in market structure.
---
### 🔍 Technical Highlights:
- ✅ **Breakout above the channel** = First sign of bullish reversal
- ✅ **Formation of Higher Low (HL)** after a strong rally = Added confirmation
- ✅ **Efficient bullish move** with momentum pushing toward previous Highs
---
### 🎯 Forecast Scenario:
If price holds above the breakout zone (around **$3,327**), we can expect a bullish continuation toward:
- 🥇 **Target 1:** $3,362
- 🥈 **Target 2:** $3,385+
A **successful retest** of the broken channel would serve as a powerful confirmation for this setup.
---
> ⛳️ *This move reflects not just a breakout — but a disciplined journey through structure, liquidity, and price behavior. Pure technical elegance.*
> — *Mohsen Mozafari Nejad*
---
📈 **Structure:** Bullish
⚡️ **Momentum:** Efficient
🕰 **Timeframe:** 45 Min
💰 **Current Price:** ~$3,327

7/7: Key Zone – 3320 to 3350Good morning, everyone!
Due to the U.S. market closure on Friday, price movement remained relatively subdued, and the week concluded with modest gains. As of this morning, gold opened higher but has since pulled back, and the price remains in a consolidation phase.
Key technical levels for today:
Resistance: around 3350
Support: near 3321
Short-term traders may focus on range-bound strategies between these levels. If a breakout occurs, follow the trend accordingly:
If price breaks above and stabilizes above 3338, the market may shift its focus toward the 3400 psychological level;
If price drops below and holds under 3332, there’s potential for a retest of the 3260 support zone.
In terms of broader trend analysis, the MA20 and MA60 on the daily chart should be watched closely, as they currently serve as key dynamic resistance and support levels.
Lastly, stay alert to any developments related to trade tariffs, as such news may significantly impact market sentiment and gold price direction.

Gold fluctuates, beware of rebound caused by new tariffs📊 Gold Day Trading Strategy (Recommendation index ⭐️⭐️⭐️⭐️⭐️)
📰 News information:
1. 90-day tariffs are about to expire
2. New unilateral tariffs
3. Geopolitical situation
📈 Technical Analysis:
As I said this morning, shorting gold is divided into two times, the first time is near 3324, and the second time is at 3340 or 3345. If there is a short-term retracement after breaking through 24, you can follow up with a long order to look at 3335-3340. If gold is in a very weak state, you can consider shorting near 3315 and look at 3300. Because during the European session, 3300 has strong support, and the European session repeatedly tests this support. If it falls below 3300, we will go to 3295-3285, or even 3250. But at the same time, we need to pay attention to the rebound of gold that may be caused by tariff policies and geopolitical situations.
🎯 Trading Points:
SELL 3315-3325-3335
TP 3305-3295-3285
BUY 3290-3285
TP 3300-3310-3320
In addition to investment, life also includes poetry, distant places, and Allen. Facing the market is actually facing yourself, correcting your shortcomings, facing your mistakes, and being strict with yourself. I share free trading strategies and analysis ideas every day for reference by brothers. I hope my analysis can help you.
TVC:GOLD OANDA:XAUUSD FX:XAUUSD FOREXCOM:XAUUSD PEPPERSTONE:XAUUSD FXOPEN:XAUUSD

The bears will take the 3290-3280 area stronglyGold started to fall from 3342 during the day and fell below 3300 at one point. Gold is in an obvious short position, and during the London market, gold continued its downward momentum without any decent rebound. Gold is in an extremely weak state. In the absence of a rebound in the London market, I think New York is very likely to continue to fall.
According to the current structure, gold is facing technical suppression of the head and shoulders in the short term, which greatly limits the rebound space of gold and suppresses the rebound limit within 3335. As the center of gravity of gold moves down, the resistance in the short term moves down to the 3315-3325 area. After breaking through 3330, the downward space has been opened up to a certain extent. So don’t be fooled by the false bullish candle that appear near 3330. Gold will inevitably continue to fall to the 3290-3280 area.
The 3290-3280 area is bound to be won, so shorting gold is still the first choice for short-term trading. You can consider shorting gold with the 3315-3325-3335 area as resistance, and look to the target area: 3295-3285-3275.

Gold bottomed out and rebounded to fluctuateGold, the price opened at 3342 in the morning and then fell back. The article emphasizes the bearish structure of the 4H chart, and the bearish trend continued to 3311-3295 in the afternoon; the actual price fell to 3296 and then rebounded in the evening, and the 4H chart closed at 22:00 and turned into a big positive, and it will rebound and fluctuate at night;
Short-term support 3306-3300, strong support 3296; short-term resistance 3322-3326, strong resistance 3330-3340;

Gold falls below 3300, will it rebound or continue to fall?Gold opened lower in the morning today and then rebounded and fell again. This kind of jump market fluctuates quickly but is mostly short-term. I usually remind you to avoid chasing orders to prevent being washed. Gold rebounded weakly and failed to touch 3320 and began to fall continuously. This weak signal alerted me - it failed to rebound strongly after the gap and instead remained at a low level, suggesting that the downward momentum was very strong and fully released, and there was a risk of further weakening. In the afternoon, the gold price was still hovering around 3312-3307, confirming its weak pattern. Combined with the repeated pressure on the key support 3300, I judged that the trend has clearly turned to short.
Gold recommendation: short in the 3312-3315 range, stop loss 3320, target 3280

New tariffs are coming. How should gold respond?📰 News information:
1. 90-day tariffs are about to expire
2. New unilateral tariffs
3. Geopolitical situation
📈 Technical Analysis:
On July 4th local time, there were constant turmoil in American politics and trade. Trump declared that the US government would send letters to trading partners that day to set new unilateral tariff rates, which would most likely take effect on August 1. He also revealed that the new tariff rates could soar to 70%. At the same time, Japan-US trade negotiations encountered obstacles, India planned to impose retaliatory tariffs on the United States, and the China-EU tariff war had also begun. At present, the news seems to be more favorable to the bulls.
From a technical point of view, gold closed higher last week, showing that there is still upward momentum this week. In the short term, we need to pay attention to the pressure in the 3365 and 3375 - 3380 areas, and the 3400 mark is a key position where bulls and bears are fighting fiercely. Before breaking through this position, we must be alert to the risk of falling back after a high rise. Pay attention to the support of 3310-3305 and 3295-3285 below. If effective support is obtained, we can consider going long. If it breaks, it may go to 3270-3260. Gold jumped to 3342 at the opening of the Asian session and then fell back. 3345 is the key in the short term. The news may affect its subsequent trend. In the short term, pay attention to the suppression of 3345 on the upper side, and further to the strong resistance area of 3365-3380. If there is resistance and pressure, you can short at a high level. The impact of recent news is erratic, so enter the market with caution and be sure to set TP and SL strictly.
🎯 Trading Points:
SELL 3330-3345
TP 3320-3310-3295
BUY 3310-3305
TP 3320-3330-3345
In addition to investment, life also includes poetry, distant places, and Allen. Facing the market is actually facing yourself, correcting your shortcomings, confronting your mistakes, and strictly disciplining yourself. I hope my analysis can help you🌐.
TVC:GOLD OANDA:XAUUSD FX:XAUUSD FOREXCOM:XAUUSD PEPPERSTONE:XAUUSD FXOPEN:XAUUSD

NFP continues to ferment, short-term trend dominated by bears📰 News information:
1. 90-day tariffs are about to expire
2. New unilateral tariffs
3. Geopolitical situation
📈 Technical Analysis:
Good morning, bros. From a technical point of view, the overall trend of the daily line is a head and shoulders top. If the bulls do not recover 3360, the bears will still be the medium-term trend. The 4H MACD indicator is dead cross running. The best position for the day to deploy the short position again is 3330-3335, and the 1H chart keeps testing the 3305 first-line support, which may be broken in the short term. At present, 3295-3285 below is a relatively important short-term support. Once it falls below, it is expected to reach 3250, which is also the point I repeatedly emphasized in the morning. The intraday operation suggestion is to rebound shorting as the main, and to go long at lows as the auxiliary. Pay attention to the 3325-3335 support area on the upper side and the 3295-3285 support on the lower side.
🎯 Trading Points:
SELL 3325-3335
TP 3315-3305-3295
BUY 3295-3285
TP 3305-3315-3325
In addition to investment, life also includes poetry, distant places, and Allen. Facing the market is actually facing yourself, correcting your shortcomings, confronting your mistakes, and strictly disciplining yourself. I hope my analysis can help you🌐.
FXOPEN:XAUUSD PEPPERSTONE:XAUUSD FOREXCOM:XAUUSD FX:XAUUSD OANDA:XAUUSD TVC:GOLD

Gold shock pattern breaksGold prices rose rapidly at the opening of the morning, reaching a high of 3342 before falling back. This early morning sharp pull-up market needs special attention, because from the perspective of short-term trading, this is the trend pattern that needs the most vigilance. Looking back at the trend of last Thursday, there was also a situation where the early morning surge could not continue. Historical data shows that this kind of morning pull-up often lacks sustained momentum and has limited room for subsequent increases. Combined with the recent trend, although the price rebounded on Monday and Tuesday, it basically maintained a volatile pattern in the following trading days, but the fluctuation range changed. After repeated struggles in the 3345-3322 range on Friday, the gold price rose again in this trading day and fell below the key support level of 3322. This important change means: 1. The original 3322-3345 oscillation range has been broken; 2. After the range moves down, 3322 changes from a support level to a resistance level; 3. The short-term trend weakens, and it is recommended to adopt a high-sell strategy. It is recommended to short at highs near 3322, and focus on the 3295-3293 support area below.

#XAUUSD: Early Mitigation Or Sellers Trap! Let's See Gold dropped after touching 3365 taking price to 3318.Currently ranging market showing confusion over how gold would react to NFP data which is coming out tomorrow. At this moment we are quite certain that price would drop tomorrow either from entry one or entry two. Please use accurate risk management while trading.
Good luck and trade!
Team Setupsfx_
XAUUSDGold continued to fall at the opening today, currently hitting the lowest level of 3300, with a high and low range of 40 US dollars, but the overall market is still volatile, so don't chase shorts at low points
Short-term needs to wait for a rebound before shorting, pay attention to the 3318/3323 resistance

Trade Breakdown: XAUUSD 15-Min | Liquidity Grab + Reversal PlayOANDA:XAUUSD
Psychological Setup
This trade is rooted in the psychology of smart money and retail behavior. After a sharp drop in price, most retail traders expect continuation (trend-following). However, institutions often manipulate liquidity zones — hunting for stop-losses before a true reversal. This trade capitalizes on that behavior.
🔍 Technical Explanation:
🔻 1. Market Structure:
Price was previously in a downtrend, forming lower highs and lower lows.
A falling wedge pattern (red lines) formed after a strong bearish move, signaling potential bullish reversal.
Price broke the wedge to the upside — a classic reversal signal.
🔁 2. Liquidity Concept:
Below the wedge: The market grabbed liquidity by taking out stop losses of buyers who entered too early.
Above the wedge (TP Areas):
TP 1 Area (red box): This is the first logical resistance where previous supply sits — many sellers will enter here, providing buy-side liquidity.
Next Target Liquidity (grey box above): This is a major imbalance zone and likely where stop-losses of early short sellers are stacked.
Price is expected to grab liquidity from that area (marked by the red arrow).
✅ Entry & Trade Logic:
Entry Zone: After liquidity was swept at the bottom of the wedge, a bullish engulfing candle formed near demand — signaling institutional interest.
Risk-Reward Setup:
Targeting 0.80% move (approx. 26.48 points).
Trade is based on reversal from demand zone + wedge breakout + liquidity grab confirmation.
🎯 Target Projections:
TP1 Area: Conservative target, just above recent structure.
Final Target: High-probability liquidity zone where market is drawn to clean up resting orders (grey zone).
🧠 Why This Trade Matters (Trading Psychology Insight):
Most retail traders get trapped in emotional entries — entering shorts after a drop or longs too early in a wedge.
Smart money waits for liquidity sweeps before moving price in the desired direction.
This setup shows the importance of patience, structure, and understanding market psychology rather than reacting emotionally to price action.
📌 Key Takeaways:
📉 Trap: Falling wedge builds false bearish confidence.
🧠 Psychology: Stop hunts create fuel for reversal.
📈 Reaction: Smart money absorbs liquidity, moves price toward next inefficiency.
Hashtags:
#XAUUSD #SmartMoney #LiquidityHunt #TradingPsychology #GoldTrade #PriceAction #WedgeBreakout #FXOpen #TechnicalAnalysis #SupplyDemand

GOLD H2 Intraday Chart Update For 7 July 2025Welcome to the new week traders
as we have FOMC meeting minutes report due this week so firs market is fell down from 3350 Psychological level now is testing 3300 psychological level
all eyes on breakout of 3300 level for now if market breaks 3300 level then it will move towards 3280 then 3350
only clear breakout of 3335 will clear path for towards 3368 level
Disclaimer: Forex is Risky

Where will the price of gold go under such strong pressure?From the 4-hour analysis, the support line of 3295-3301 is concerned below, the short-term resistance above is concerned about 3316, and the suppression line of 3345-50 is focused on. The overall main tone of high-altitude low-multiple cycle participation remains unchanged. In the middle position, watch more and do less, and follow orders cautiously, and maintain the main tone of participation in the trend. Wait patiently for key points to participate.

XAUUSD – Fresh Bearish Setup After TP HitWelcome to Velatrix Capital.
Last week’s short position on Gold has just hit Take Profit.
Based on current structure and momentum, we remain bearish-biased and have already entered a fresh short trade from a key resistance level.
This setup aligns with our internal system’s confluence logic and is now active.
🔍 Trade Parameters
• Timeframe: 1H
• Direction: Sell
• Entry: 3310.11
• Take Profit: 3266.76
• Stop Loss: 3324.51
• Risk/Reward: 1:3
Note: This is not financial advice. This is a real trade taken by our team based on a structured, repeatable trading model.
Use it as insight. Not as instruction.
🔔 Follow Us
We don’t chase hype.
We build edge.
Follow for raw setups, structured strategies, and institutional-grade breakdowns.

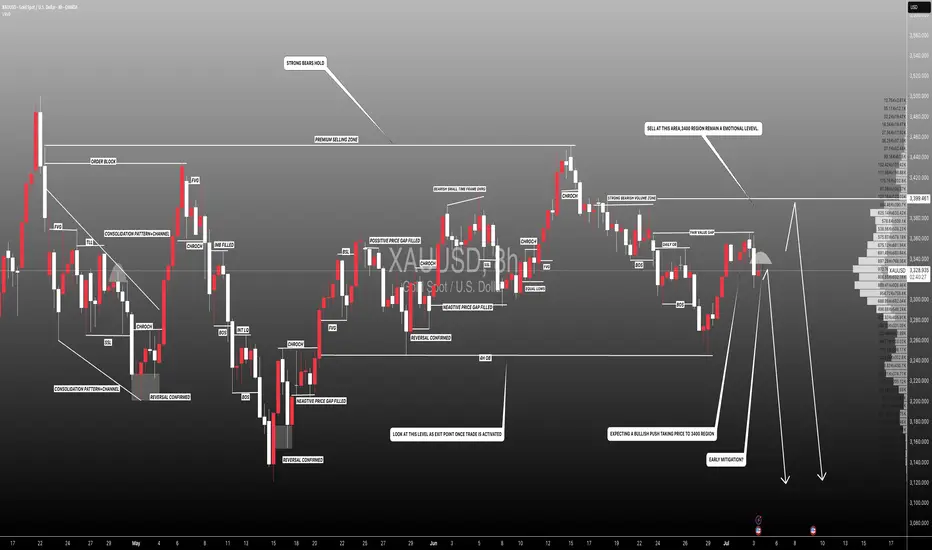
Elliott Wave Analysis – XAUUSD – June 8, 2025🌀 Elliott Wave Structure Timeframe: H4
Currently, price action is overlapping with multiple abc correction patterns. To reduce noise and gain a clearer perspective, I’ve shifted the analysis to the H4 timeframe.
From the 3500 level down to now, the entire corrective move has been composed of overlapping abc patterns rather than sharp, impulsive rallies. This suggests we are likely forming a contracting triangle correction in the form of abcde (green) as shown on the chart.
At the moment, price appears to be in wave d (green), which is unfolding as a wxy structure (red).
Trading during triangle corrections is particularly challenging due to the complex interweaving of corrective waves. Additionally, price is consolidating within the Volume Profile’s high-liquidity zone, as shown on the chart. Therefore, it is best to remain patient and wait for the triangle pattern to complete.
📉 Momentum
Daily (D1) momentum: Currently showing signs of a bearish reversal → suggesting that price may move sideways or lower this week. (Toward the end of a triangle, price tends to compress and lose clear directional bias.)
H4 momentum: Also shows reversal signals, and a strong bearish candle has recently formed. Thus, a short-term bearish bias is preferred until H4 momentum reaches the oversold region.
🎯 Price Targets
Since the market is currently forming overlapping abc structures, setting precise wave targets is difficult. Therefore, I rely on Volume Profile zones to define key levels:
3342 Resistance Zone: Marks the boundary between high and low liquidity areas → This is a Sell Zone, supported by confluence with D1 and H4 momentum signals.
3294 Support Zone: Represents the lower boundary of high liquidity → This is the projected end of wave X (red) and serves as our Buy Zone.
🧭 Trade Plan
🔻 Sell Zone:
Entry: 3340 – 3342
SL: 3350
TP1: 3320
TP2: 3300
🔺 Buy Zone:
Entry: 3295 – 3293
SL: 3285
TP1: 3312
TP2: 3342
TP3: 3390
📌 Personal Note:
At this stage, I prefer to wait for the abcde triangle to complete or for more structural confirmation. If you decide to trade, focus on short-term setups with reduced position size to manage risk during this complex correction phase.

XAUUSD – High-Precision Sell Setup with 1:2.70 R/RGreetings, traders.
After a brief tactical pause, we’ve identified a **high-conviction short setup** on **XAUUSD**.
Despite the U.S. Independence Day holiday, structural momentum suggests there’s still room for meaningful movement in gold during today’s session. The risk-to-reward profile on this setup is exceptional — clocking in at **1:8.70**, it meets our highest-tier execution standards.
If momentum stalls or price consolidates excessively, the trade will be manually closed by **23:00 (UTC+4)**, regardless of outcome.
🧠 Trade Parameters:
• **Timeframe:** 1-Hour (H1)
• **Direction:** Sell
• **Entry:** 3337.09
• **Take Profit:** 3312.16
• **Stop Loss:** 3345.63
• **Risk/Reward Ratio:** 1:2,70
• **Trade Management Note:** Will be closed manually by 23:00 (UTC+4) if momentum conditions are not met.
🔗 Signal Source
All trade setups are published directly by Velatrix Capital — a high-discipline trading desk focused on FX, crypto, and global indices.
No opinions. No hype. Just statistically-grounded execution.
All signals are posted via our TradingView desk:
👉 (www.tradingview.com)
📈 **We don’t chase hype. We build edge.**
🔔 **Subscribe for future setups and institutional-grade trade intelligence.**
**Velatrix Capital**
