Elliott Wave Analysis – XAUUSD, March 7, 2025🌀 Elliott Wave Structure
On the H1 chart, wave 3 appears to have completed, and price is now entering a phase with an unusual structural behavior.
Wave 3 previously showed strong momentum, moving steeply and continuously, with no clear internal pullbacks – a classic impulse wave. Following this, we observed a corrective abc pattern in black, suggesting the end of wave 3.
Interestingly, although yesterday's ADP report was extremely bullish, gold only managed a mild breakout above the wave 3 high before pulling back this morning. Notably, the upward move followed a 3-wave abc structure in green, and price action is now showing overlapping waves with no clear directional momentum.
🧩 These signs suggest a high probability that:
🔹 Wave 5 is forming as an Ending Diagonal – a 5-wave structure with a 3-3-3-3-3 pattern.
🔹 This is typically seen at the end of a bullish cycle and often precedes a sharp reversal.
Although it's too early to confirm, we should patiently observe the upcoming price action. If the ending diagonal completes, it may present a strong sell opportunity.
🎯 Target for wave 5: around 3395, provided all 5 sub-waves within the diagonal complete.
⚠️ If price breaks below 3324, we must consider that the full 5-wave structure is already done, and a new abc corrective phase may have begun.
🔍 Momentum Analysis
Daily (D1): Momentum is about to turn bearish from overbought territory → suggests a weakening uptrend.
H4: Momentum is turning upward → likely a mild rally or sideways movement today before H4 reaches overbought again.
📌 Trading Plan
Given the current wave behavior and overlapping structure, it is best to remain patient and wait for confirmation before taking a strong position. If the Ending Diagonal structure is confirmed, it could signal a major reversal.
SELL Zone: 3392 – 3395
Stop Loss: 3403
Take Profits:
• TP1: 3368
• TP2: 3340
• TP3: 3324
Xauusdupdates

Who will be the winner in the battle between bulls and bears?From the analysis point of view, the short-term resistance above is around 3295-3301, and the pressure at 3315-3316. Focus on the pressure at 3324, the long-short watershed. In terms of operation, the rebound will continue to be the main short and look for a decline. The short-term support below is around 3250-3255. Relying on this range, the main tone of high-altitude participation remains unchanged.

XAUUSD:Today's Trading Strategy
Gold retreated in the sub-session, I have personally increased my long position near 3331, the overall trend is bullish unchanged, the median strategy is patient to rise. If you are trading short, you can go long at 3325-3330 and leave at 3340-45. The same can be said if you want to solve the problem; Trade according to your trading preferences and risk tolerance.
More detailed strategies and trading will be notified here ↗↗↗
Keep updated, come to "get" ↗↗↗

Gold trend analysis and layout before NFP data📰 News information:
1. Initial jobless claims and NFP data
2. The final decision of the Federal Reserve
📈 Technical Analysis:
Due to the Independence Day holiday this week, the NFP data was released ahead of schedule today, while the policy differences within the Federal Reserve have brought uncertainty to the market. Judging from the market trend, the 4H level shows that the gold price tested the upper track yesterday and then turned to high-level fluctuations after coming under pressure. In the short term, the structure still has bullish momentum after completing the accumulation of power. Although there was a correction in the US market yesterday, it stopped falling and rebounded near 3335, further confirming the strength. At present, the upper resistance in the European session is at 3365-3375, and the short-term support is at 3345-3335 below. Intraday trading still requires good SL to withstand market fluctuations. In terms of trading, it is recommended to mainly go long on callbacks
🎯 Trading Points:
SELL 3365-3375
TP 3350-3340-3335
BUY 3335-3330-3325
TP 3350-3360-3375
In addition to investment, life also includes poetry, distant places, and Allen. Facing the market is actually facing yourself, correcting your shortcomings, confronting your mistakes, and strictly disciplining yourself. I hope my analysis can help you🌐.
FXOPEN:XAUUSD PEPPERSTONE:XAUUSD FOREXCOM:XAUUSD FX:XAUUSD OANDA:XAUUSD TVC:GOLD

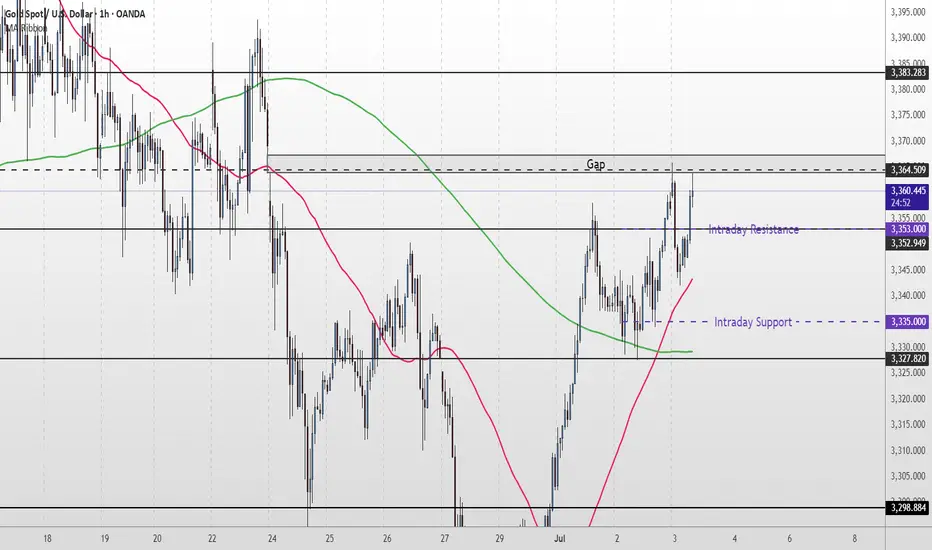
Gold Short Term OutlookYesterday, we highlighted that gold had reclaimed the 200MA and that the $3,327 support level needed to hold for further upside. Since then, price has steadily climbed and is now testing the $3,364 resistance — a level that also aligns with an unfilled gap.
Price action remains bullish for now, with price holding firmly above both the 50MA and 200MA.
If buyers manage to clear and hold above $3,364, we could see further upside toward $3,383 and $3,400, with possible extension into $3,418.
However, if price fails to break above $3,364, we may see a pullback into the $3,335–$3,327 zone. A break below there could open the door for a deeper drop into $3,298 or even $3,270.
📌 Key Levels to Watch:
Resistance:
$3,364 • $3,383 • $3,400 • $3,418
Support:
$3,352 •$3,335 - $3,327 • $3,298 • $3,270
🧠 Fundamental Focus:
📌 ADP Non-Farm Employment Change
📌 Initial Jobless Claims
📌 ISM Services PMI
📌 ISM Non-Manufacturing PMI
⚠️ With multiple red folder events on the calendar, expect elevated intraday volatility. Manage risk accordingly.
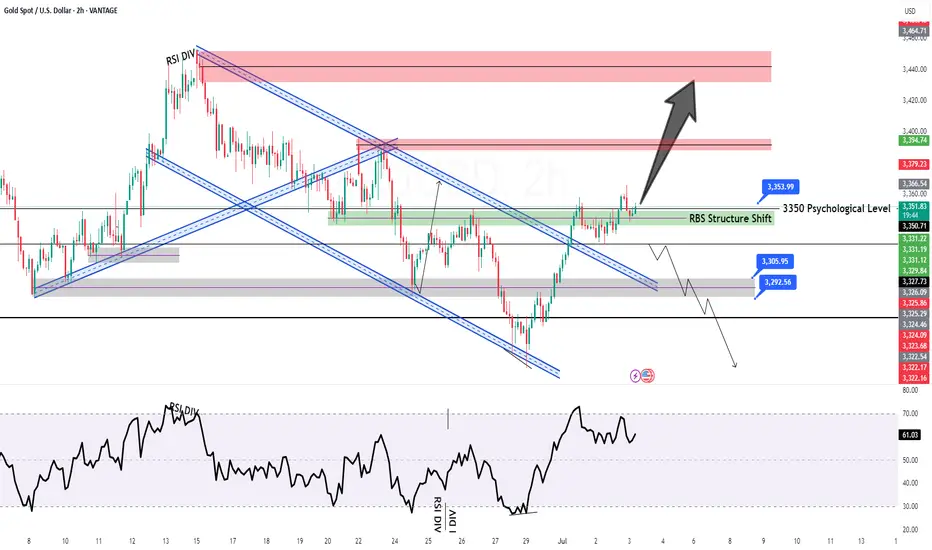
GOLD H2 Intraday Chart Update For 3 July 2025Hello Traders,
Main event of is day NFP and all eyes on 3400 Psychological for now, right now market sustains around 3350 Psychological level for downward move GOLD still need to break 3324 level in order to go further down above 3324 LEVEL GOLD is still remains Bullish
Remember: It's NFP day
Disclaimer: Forex is Risky
GOLD LOND TRADE IDEA We Are Looking Gold Bullish Today ,
TL BUY AREA : 3347 💡
1ST SUPPORT BUY : 3336, 3333 💡
2ND SUPPORT BUY: 3329, 3325 💡
If Gold Break The Trendline Then We See Gold Bearish Price Then We Buy At Support The Target Will Be ATH Liquidity 3390
If Gold Breaks Also 2nd Support Then Continue Bearish Trend Then We Trade Sell On a2nd Support Break
Manage Trades Properly Dont Forget To Follow Us For More Free Trades

XAUUSD Technical Analysis – 02/07/2025On the 1-hour chart, Gold (XAUUSD) has just confirmed the completion of corrective wave (4) around the 3,328.3 zone, which aligns with the 1.0 Fibonacci level and EMA9 support. Currently, price is rebounding with increasing volume, signaling that buying momentum is returning.
Key Technical Highlights:
Elliott Wave Structure:
Wave (4) found support at 3,328.3.
Wave (5) targets are forming, with Fibonacci extensions pointing to:
0.618: 3,360.05
1.0: 3,380.07
=> These are critical resistance zones to watch.
Fibonacci Retracement Zones:
The current rebound is heading toward the 0.5 and 0.618 retracement levels of the previous down leg, located at 3,362.4 and 3,354.4 – short-term upside targets.
Volume Analysis:
Rising volume on bullish candles confirms a legitimate buying interest, supporting the upward movement.
EMA9 Breakout:
Price has broken above the EMA9 at 3,338.2, shifting short-term trend bias to bullish.
Suggested Trading Strategy:
Favor Buy on Dip entries near the 3,340–3,342 zone if a minor pullback occurs.
Short-term targets: 3,354 – 3,362
Extended target: 3,380
Suggested stop loss below 3,328.0 to manage risk.
Conclusion:
A bullish impulse is forming following the end of wave (4). If price holds above 3,340 and breaks through the nearby Fibonacci resistance levels, wave (5) could extend towards the 3,380 area. This is a pivotal moment to watch for a confirmed short-term uptrend.

ADP data has been released, how to position gold in the future📰 News information:
1. ADP data, for reference of tomorrow's NFP data
2. Interest rate cuts and Powell's dovish comments
3. Geopolitical impact on the gold market
📈 Technical Analysis:
The ADP data was significantly bullish after it was released, but gold did not rise sharply in the short term. Instead, it touched the resistance of 3350 that we gave and then fell back. I also saw a lot of fake traders in the market who immediately told their brothers to go long and look towards 3380 after the ADP data was released. To be honest, I think these people are typical hindsight experts. If everyone is like this, then anyone can be called a trader, right?
Back to the topic, I still hold short orders at 3340-3350. In the short term, gold will fluctuate and be bearish to seek restorative support, so the best place to go long is to look at the retracement below, which will at least touch 3333-3323. If it falls below this support, it will go to 3315-3305. On the contrary, if it gets effective support at 3333-3323, then gold will rebound as expected to form a head and shoulders bottom.
🎯 Trading Points:
SELL 3340-3350-3355
TP 3333-3323-3315-3295
BUY 3335-3325
TP 3345-3355-3375
In addition to investment, life also includes poetry, distant places, and Allen. Facing the market is actually facing yourself, correcting your shortcomings, confronting your mistakes, and strictly disciplining yourself. I hope my analysis can help you🌐.
FXOPEN:XAUUSD PEPPERSTONE:XAUUSD FOREXCOM:XAUUSD FX:XAUUSD OANDA:XAUUSD TVC:GOLD
#XAUUSD: +2000 Swing Sell In Making! Get ReadyGold has dropped to the 3330 region but has now reversed and is currently trading at 3350. The next potential move could be at 3380, followed by 3400. Our sell entry is at 3400, where we believe the price will reverse. Our long-term view is that gold will head towards 3100, but our first target will be 3200. Please use accurate risk management when trading gold, as it can cause serious financial issues if not planned properly. This analysis does not guarantee any price movement.
Good luck and trade safely!
Team Setupsfx!

Mozafari Nejad ### Multi-Timeframe Analysis: 15min + 30min + 2# XAU/USD | Gold Market Outlook by Mohsen Mozafari Nejad
### Multi-Timeframe Analysis: 15min + 30min + 2h | July 2–3, 2025
---
## 🔍 Technical Overview:
| Timeframe | Structure | Efficiency | Context |
|-----------|-----------|------------|---------|
| 15min | Bullish ✅ | Efficient ✅ | Reverse H&S complete – price entering neckline zone |
| 30min | Bullish ✅ | Inefficient ❌ | Clean BOS – ready for potential continuation |
| 2H | Bullish ✅ | Inefficient ❌ | HL confirmed – clear bullish delivery range ahead |
---
## 🧠 Key Insights:
- **Left Shoulder - Head - Right Shoulder** clearly visible and now validated with neckline break
- Price is reacting from **last TLQ + ILQ zones** with MSU
- Strong **liquidity gap** above 3,380–3,405 likely to be targeted
- **Highs around 3,420–3,440** may act as liquidity magnet if clean break happens
- **BOS and CHoCH** confirmed across all LTFs — strong bullish intent
- Structure remains **bullish** as long as 3,312–3,320 HL holds
---
## 🎯 Price Zones to Watch:
| Zone | Action |
|--------------|----------------|
| 3,335–3,340 | OB Flip Support / Demand (Retest Possible) |
| 3,368–3,375 | Reaction Zone / Short-Term Take Profit |
| 3,404–3,420 | Major Liquidity Above / SH Grab |
| 3,428–3,440+ | Stop-Hunt Potential for Final Exit |
---
## 📌 Trade Scenarios:
### 🟢 Long Setup
- **Entry:** 3,340–3,348 (OB retest or continuation)
- **SL:** below 3,328
- **TP1:** 3,375
- **TP2:** 3,400
- **TP3:** 3,420+
### 🔴 Caution for Short
Only valid if price shows **CHoCH + strong rejection** from above 3,420–3,440.
Otherwise, trend continuation is dominant.
---
## 🧭 Summary:
> Gold continues its bullish structure in all LTFs.
> Reverse H&S has broken neckline cleanly.
> Momentum + inefficiency zones above = clear drive to liquidity.
> Patience is key – reentry on OB retest = high R/R setup.
---
🖋️ Prepared by: **Mohsen Mozafari Nejad**
*Smart Money | Liquidity Zones | Order Blocks | MSU/MSD Framework*

Elliott Wave Analysis – XAUUSD | February 7, 2025🌀 Elliott Wave Structure (H1 Timeframe)
Looking at the current price structure, we can see that the price is moving sharply and steeply—this suggests the formation of a 5-wave impulsive structure.
Specifically:
- Waves 1, 2, and 3 (green) appear to have completed.
- Currently, wave 4 is forming as a 3-wave corrective structure (abc in black).
- Once wave 4 completes, we anticipate the next upward move as wave 5, which will complete the full 5-wave cycle (green).
🎯 Potential Price Targets for Wave 4
Based on the structure of the abc correction and support zones, we identify two key target areas:
+ Target 1: 3324
+ Target 2: 3311
When the price breaks above the top of wave b (black), it will serve as a strong confirmation that wave 4 has ended and wave 5 is beginning.
📈 Momentum Analysis
Daily (D1): Momentum is still rising and likely needs 2–3 more days to enter the overbought zone, supporting the continuation of the uptrend.
H4: Momentum is about to turn upward, signaling wave 4 may be nearing completion.
H1: Momentum is also preparing to turn up, suggesting the price is approaching the end of the wave 4 correction zone.
💼 Trading Plan
BUY ZONE: 3325 – 3322
STOP LOSS: 3215
TAKE PROFIT 1: 3345
TAKE PROFIT 2: 3368
TAKE PROFIT 3: 3395
📌 Wait for H1–H4 momentum alignment before triggering a BUY entry for wave 5.

As expected, it will fall and form a head and shoulders bottom📰 News information:
1. ADP data, for reference of tomorrow's NFP data
2. Interest rate cuts and Powell's dovish comments
3. Geopolitical impact on the gold market
📈 Technical Analysis:
Yesterday we expected gold to retreat to the 3330-3320 area. Today, gold hit a low of around 3328 during the Asian session, which is in line with our judgment of the market trend. In the short term, gold may still fall. First, it may test the 3323 support line. If it falls back to this position during the day, you can try to go long. In the short term, focus on the 3315-3305 long-short dividing line below. If gold gets effective support below, it is expected to form a head and shoulders bottom pattern. The short-term decline will accumulate momentum for the future rise. Pay attention to the ADP data during the NY period
🎯 Trading Points:
BUY 3323-3315-3305
TP 3340-3350-3360-3375
In addition to investment, life also includes poetry, distant places, and Allen. Facing the market is actually facing yourself, correcting your shortcomings, confronting your mistakes, and strictly disciplining yourself. I hope my analysis can help you🌐.
FXOPEN:XAUUSD PEPPERSTONE:XAUUSD FOREXCOM:XAUUSD FX:XAUUSD OANDA:XAUUSD TVC:GOLD

Exclusive trading strategy, short gold!From the current gold structure, we can see that gold still needs to continue to retest the 3320-3310, or even the 3305-3295 area; so in the short term, we can still seize the opportunity to consider shorting gold in batches in the 3340-3360 area.
Trading signal:
@3340-3360 Sell, TP:3325-3315-3305
A reliable trader must have an explanation for everything and respond to everything. I have always been committed to the market and insist on writing the most useful core strategies for traders. The transaction details can be seen in the channel!

gold on sell retrace#XAUUSD still on sell reverse, between 3347-3348 holds sell reverse. But if current H1 closes above 53 then bullish starts.
Sell limit 3347-3348, target 3320, stop loss 3356.
Above 3353 have bullish on H1 closure, target 3370

How do we plan before ADP and NFP?📰 News information:
1. ADP data, for reference of tomorrow's NFP data
2. Interest rate cuts and Powell's dovish comments
3. Geopolitical impact on the gold market
📈 Technical Analysis:
The market will continue to fluctuate before the ADP data, and the market will continue to rise after the adjustment. In the 4H cycle, the upper rail of the pressure is temporarily suspended, and the Bollinger Bands also close. This is why I emphasize the need to pay attention to the 3323 support line below. At present, gold rebounded, I think it will touch 3348 at most, that is, it rebounded to 50%. Therefore, before the ADP data, I still hold the position of 3340-3350 for shorting, and find support for long at 3325-3315 below. I have marked the pattern of head and shoulders bottom in the figure. I have been engaged in spot, futures, foreign exchange and other transactions for many years. My analysis ideas can be referred to by brothers
🎯 Trading Points:
SELL 3340-3350
TP 3330-3325-3315-3295
BUY 3323-3315-3305
TP 3340-3350-3360-3375
In addition to investment, life also includes poetry, distant places, and Allen. Facing the market is actually facing yourself, correcting your shortcomings, confronting your mistakes, and strictly disciplining yourself. I hope my analysis can help you🌐.
TVC:GOLD OANDA:XAUUSD FX:XAUUSD FOREXCOM:XAUUSD PEPPERSTONE:XAUUSD FXOPEN:XAUUSD

Will Gold Continue Its Strong Rally or Face a Pullback?XAUUSD 02/07: Will Gold Continue Its Strong Rally or Face a Pullback?
📉 Technical Analysis – Gold Faces Short-Term Pullback After Strong Rally
Gold has been experiencing a clear rally in recent days, but it’s currently undergoing a brief correction. The price has recently dropped slightly, prompting traders to keep a close eye on key levels for potential reversal or continuation of the bullish move.
🌍 Macroeconomic Context – Factors Impacting Gold's Price
USD Fluctuation: The weakness in the US Dollar continues to affect gold prices, creating opportunities for the precious metal to maintain its upward movement.
Geopolitical Tensions: Ongoing global tensions, including the US-Iran conflict, act as a safe-haven factor, supporting gold demand.
Interest Rate Expectations: The market is closely watching for any changes in interest rate policies. Any future rate cuts by the Fed could further bolster gold's price.
📊 Technical Outlook (H1 – H4 – D1)
Short-Term Trend: On the H1 timeframe, the price of gold touched a key level near 3340. From there, the price began to experience a pullback. However, the upward momentum remains strong on higher timeframes.
Key Support Levels: The 3300 level remains a crucial support. If the price stays above this, there’s a chance for gold to continue rising towards higher levels.
Key Resistance Levels: 3360 and 3380 are critical resistance levels. If breached, gold could move towards new highs.
📍 Important Support and Resistance Levels:
🔺 Resistance: 3345 – 3360 – 3380 – 3400
🔻 Support: 3300 – 3290 – 3270 – 3250
💡 Trading Plan for Today, 02/07:
🔵 BUY ZONE:
📈 Entry: 3305 – 3303
📉 SL: 3297
💰 TP: 3315 → 3325 → 3340 → 3360
🔴 SELL ZONE:
📉 Entry: 3360 – 3362
📈 SL: 3368
💰 TP: 3350 → 3340 → 3320
📣 Conclusion:
Gold is showing signs of short-term correction but remains a strong asset due to geopolitical factors and monetary policies. Buying opportunities continue to be attractive at support levels, while key resistances will play a crucial role for any breakout. Keep an eye on the mentioned levels to capitalize on market movements.
Happy trading and best of luck to all traders!

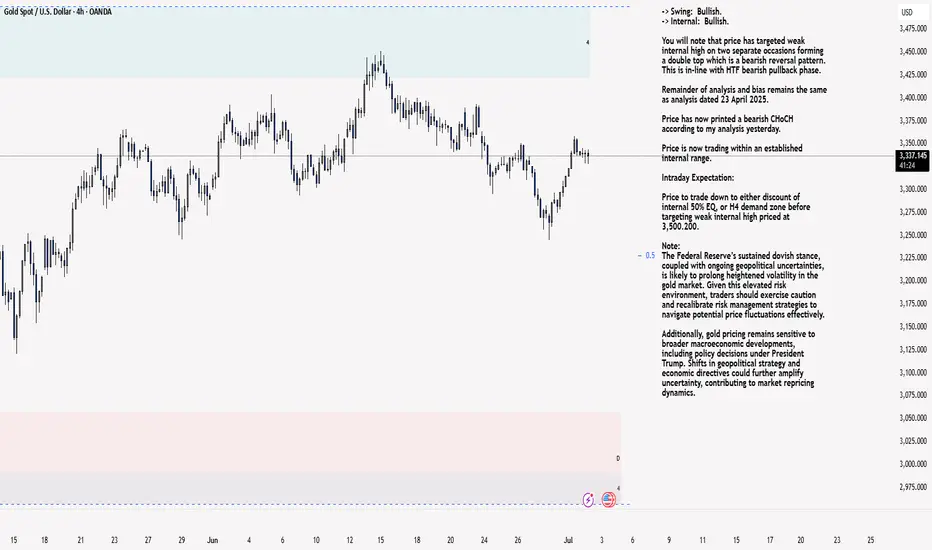
XAU/USD 02 July 2025 Intraday AnalysisH4 Analysis:
-> Swing: Bullish.
-> Internal: Bullish.
You will note that price has targeted weak internal high on two separate occasions forming a double top which is a bearish reversal pattern. This is in-line with HTF bearish pullback phase.
Remainder of analysis and bias remains the same as analysis dated 23 April 2025.
Price has now printed a bearish CHoCH according to my analysis yesterday.
Price is now trading within an established internal range.
Intraday Expectation:
Price to trade down to either discount of internal 50% EQ, or H4 demand zone before targeting weak internal high priced at 3,500.200.
Note:
The Federal Reserve’s sustained dovish stance, coupled with ongoing geopolitical uncertainties, is likely to prolong heightened volatility in the gold market. Given this elevated risk environment, traders should exercise caution and recalibrate risk management strategies to navigate potential price fluctuations effectively.
Additionally, gold pricing remains sensitive to broader macroeconomic developments, including policy decisions under President Trump. Shifts in geopolitical strategy and economic directives could further amplify uncertainty, contributing to market repricing dynamics.
H4 Chart:
M15 Analysis:
-> Swing: Bullish.
-> Internal: Bullish.
H4 Timeframe - Price has failed to target weak internal high, therefore, it would not be unrealistic if price printed a bearish iBOS.
The remainder of my analysis shall remain the same as analysis dated 13 June 2025, apart from target price.
As per my analysis dated 22 May 2025 whereby I mentioned price can be seen to be reacting at discount of 50% EQ on H4 timeframe, therefore, it is a viable alternative that price could potentially print a bullish iBOS on M15 timeframe despite internal structure being bearish.
Price has printed a bullish iBOS followed by a bearish CHoCH, which indicates, but does not confirm, bearish pullback phase initiation. I will however continue to monitor, with respect to depth of pullback.
Intraday Expectation:
Price to continue bearish, react at either M15 supply zone, or discount of 50% internal EQ before targeting weak internal high priced at 3,451.375.
Note:
Gold remains highly volatile amid the Federal Reserve's continued dovish stance, persistent and escalating geopolitical uncertainties. Traders should implement robust risk management strategies and remain vigilant, as price swings may become more pronounced in this elevated volatility environment.
Additionally, President Trump’s recent tariff announcements are expected to further amplify market turbulence, potentially triggering sharp price fluctuations and whipsaws.
M15 Chart:
Gold Price Analysis – Bullish Momentum Holds Above FVGs🧠 Chart Breakdown:
Instrument: Gold Spot (XAU/USD)
Timeframe: 1H
Current Price: $3,340
Trend: Short-term uptrend intact
🔑 Key Observations:
Ch.o.Ch Confirmed (Change of Character):
The break above the previous structure high confirmed a bullish market structure shift.
Fair Value Gaps (FVG):
Multiple FVGs exist between $3,320 – $3,335, acting as potential demand zones and support levels.
Fibonacci Retracement:
Price is respecting the 0.382–0.5 levels ($3,336 – $3,330) well so far.
Below this, the 0.618 level at $3,325 is the next strong confluence zone.
Trendline Support:
The price is testing a rising trendline, adding dynamic support around the current level.
Ichimoku Cloud:
Price is above the cloud, which supports the bullish bias.
Conversion line (blue) and base line (red) are bullishly aligned.
📉 Possible Next Moves:
✅ Bullish Scenario:
Price bounces from current levels or slightly lower ($3,336–$3,330) and retests the recent high (~$3,355).
Breakout above $3,355 could open the door to $3,370+.
⚠️ Bearish Scenario:
If price breaks below $3,330 and the trendline, expect deeper pullbacks to:
$3,325 (0.618 Fib)
Then possibly $3,308 FVG support or $3,258 major demand zone.
📌 Conclusion:
Gold is still respecting bullish market structure with healthy pullbacks into support zones. As long as the price stays above $3,325, the bullish outlook remains valid. Watch for bullish reaction near the FVGs or a break above $3,355 to confirm upside continuation.

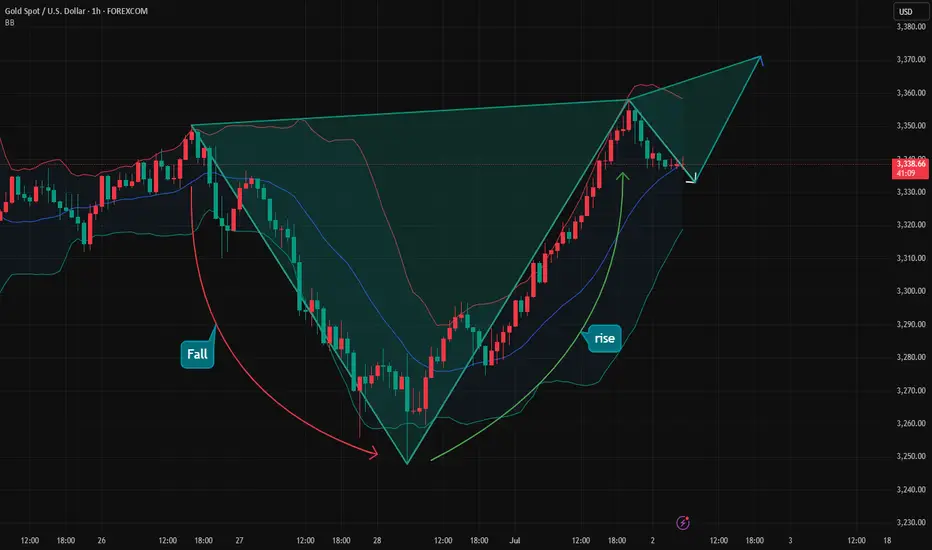
Gold Trading Strategy June 27✏️The price reaction at 3348 forms a sustainable bearish structure. 3296 is an important zone when broken, it will continue to fall deeply without any recovery on Friday.
Today the downtrend will encounter less resistance than the uptrend. Therefore, it is not difficult to touch the support zones of 3278 and 3255.
Any recovery in the price in the European session is considered a good opportunity for a Sell signal towards the target of 3278 and 3255.
As analyzed, the SELL zone today is noted at many resistance zones and consider the price reaction for the SELL signals.
📈 Key Levels
Break out: 3296
Support: 3278-3255
Resistance: 3300-3312-3325-3336-3348-3363
📊 Recommended Trade Setups
BUY 3278-3276 SL 3272
SELL 3325-3327 SL 3330

GOLD H2 Intraday Chart Update For 2 July 2025Hello Traders,
Today all eyes on breakout of 3360-70 zone in order to GOLD go for further advance below this zone all eyes are remains on 3318 level if market successfully maintain 3330 level then will go down further towards 3300 Psychological Level after passing 3318
NFP main event of the day which is held by tomorrow
Disclaimer: Forex is Risky

7/2 Trapped Orders from Yesterday Turned ProfitableGood morning, everyone!
Yesterday’s early-entry gold short position encountered some temporary drawdown, but thanks to flexible adjustments, the trade has now moved into profit overall.
Currently, the price is hovering near a key support area. Based on the 1H and 2H charts, there is still room for further downside. At this point, there are two strategic options:
Close the position to lock in current profits;
Hold the position and wait for further decline, keeping in mind that if support holds, the price may rebound back toward the 3350 level, introducing some risk.
You can decide whether to stay in the trade or exit, depending on your risk tolerance and trading plan.

Gold operation suggestionsLooking back at the market in May and June, although gold has experienced adjustments, its shape is very resilient. In the monthly cycle, the price of gold is firmly above the MA5 moving average. From the perspective of large-cycle technical analysis, this is a typical strong bullish pattern, demonstrating the strong control of the bulls. As the adjustments are gradually in place, the later bullish outbreak is worth looking forward to. However, the adjustment to 3247 this time is not small, so in the short term, the gold price is likely to fluctuate upward. At present, 3451 is an important watershed. Once it is effectively broken through, the gold price is expected to hit the 3500 mark, and I personally believe that 3500 will not be the end point, and it is expected to be refreshed later.