Analysis and layout of gold trend at the end of the month📰 News information:
1. Gold market liquidity at the end of the month
2. Impact of geopolitical situation
📈 Technical Analysis:
From the beginning of the decline of gold near 3338 on Friday to today's lowest point near 3244, gold has fallen by nearly $94. At present, gold has rebounded as expected. In the short term, I think we have two key areas to pay attention to. The first is the position of 3290-3295, which is a 50% rebound, and the second is the upper top range limit range of 3300-3320. Of course, if it breaks through 3280 and then retreats, it can also be long twice, but the current price rebounds, considering the position of the temporary low long position, there is not much trading opportunity. First look at the key areas given to find opportunities for shorting, and pay attention to the opportunity of retreating to 3280-3270 below.
🎯 Trading Points:
SELL 3290-3295
TP 3380-3370
SELL 3300-3310-3320
TP 3290-3280-3270
BUY 3270-3260
TP 3290-3300
In addition to investment, life also includes poetry, distant places, and Allen. Facing the market is actually facing yourself, correcting your shortcomings, confronting your mistakes, and strictly disciplining yourself. I hope my analysis can help you🌐.
OANDA:XAUUSD FOREXCOM:XAUUSD FX:XAUUSD PEPPERSTONE:XAUUSD FXOPEN:XAUUSD TVC:GOLD
Xauusdupdates

GOLD H2 Intraday Chart update for 30 June 2025Hello Traders,
As you can see that there are some solid in the market since morning, right now market is sustains below 3300 Psychological Level and move towards 3270-75 key support zone and then at 3350
Monthly candlestick closing also due today
only if market breaks 3305 successfully today then GOLD will move towards 3335
Disclaimer: Forex is Risky

XAUUSD Under Pressure: What the Market Is Telling UsGold (XAUUSD) is currently trading with a clear bearish bias, showing sustained downside momentum on the 4H timeframe 🕒. Price has been gradually stepping lower, and the structure continues to favor the sellers.
As expected for early in the week, there’s been a bit of choppy movement ⚖️, but the overall sentiment remains weak. Unless we see a strong shift or catalyst, I’ll be maintaining a bearish outlook.
🧭 I’m watching for price to revisit key resistance levels, and if we get a clean break and retest 🔄, I’ll be looking for potential short setups from areas of previous demand that flip into resistance.
🌐 Keep an eye on broader risk sentiment — if NASDAQ starts pulling back or DXY strengthens, it could fuel further downside in gold.
As always, this is not financial advice, but the detailed breakdown is available in the latest video 🎥.

XAUUSD is holding falling pattern H4 Timeframe Analysis
Gold is currently holding the falling wedge pattern on H1 & H4 and Market has to lift up at range of 3330-3320 for completion of Leg then drop.
What's possible scanarios we have?
BULLISH SCANARIO:
As we have seen h4 candle closes above 3280-3285 and we have margin towards 3320 but how we achieved it ? If the H1-H4 candle closes above 3305 then our targets we'll be 3330.
BEARISH SCANARIO: (PREFERRED)
On the otherhand if The H4 candle closes below 3280-3275 then buying will be limited and market will join the 3250 then 3230-3320. Most appropriate Sell will be at 3320-3330 zone for implusive move also we have Weekly structural Resistance at 3330-3350 piviot point.

XAU/USD 30 June 2025 Intraday AnalysisH4 Analysis:
-> Swing: Bullish.
-> Internal: Bullish.
You will note that price has targeted weak internal high on two separate occasions forming a double top which is a bearish reversal pattern. This is in-line with HTF bearish pullback phase.
Remainder of analysis and bias remains the same as analysis dated 23 April 2025.
Price has now printed a bearish CHoCH according to my analysis yesterday.
Price is now trading within an established internal range.
Intraday Expectation:
Price to trade down to either discount of internal 50% EQ, or H4 demand zone before targeting weak internal high priced at 3,500.200.
Note:
The Federal Reserve’s sustained dovish stance, coupled with ongoing geopolitical uncertainties, is likely to prolong heightened volatility in the gold market. Given this elevated risk environment, traders should exercise caution and recalibrate risk management strategies to navigate potential price fluctuations effectively.
Additionally, gold pricing remains sensitive to broader macroeconomic developments, including policy decisions under President Trump. Shifts in geopolitical strategy and economic directives could further amplify uncertainty, contributing to market repricing dynamics.
H4 Chart:
M15 Analysis:
-> Swing: Bullish.
-> Internal: Bullish.
On H4 TF price has been failing to target weak internal high, therefore, it would not be unrealistic if price printed a bearish iBOS.
The remainder of my analysis shall remain the same as analysis dated 13 June 2025, apart from target price.
As per my analysis dated 22 May 2025 whereby I mentioned price can be seen to be reacting at discount of 50% EQ on H4 timeframe, therefore, it is a viable alternative that price could potentially print a bullish iBOS on M15 timeframe despite internal structure being bearish.
Price has printed a bullish iBOS followed by a bearish CHoCH, which indicates, but does not confirm, bearish pullback phase initiation. I will however continue to monitor, with respect to depth of pullback.
Intraday Expectation:
Price to continue bearish, react at either M15 supply zone, or discount of 50% internal EQ before targeting weak internal high priced at 3,451.375.
Note:
Gold remains highly volatile amid the Federal Reserve's continued dovish stance, persistent and escalating geopolitical uncertainties. Traders should implement robust risk management strategies and remain vigilant, as price swings may become more pronounced in this elevated volatility environment.
Additionally, President Trump’s recent tariff announcements are expected to further amplify market turbulence, potentially triggering sharp price fluctuations and whipsaws.
M15 Chart:

Gold Short To Medium Term OutlookGold bounced from the lower Support Zone after briefly breaching $3,270. Price is now attempting a recovery, currently trading near $3,290, but remains below both the 50 EMA and 200 EMA — confirming bearish pressure is still intact.
For bulls to gain momentum, we need to see a clean break and hold above $3,298–$3,327which would open the path toward $3,352 and possibly higher resistance levels like $3,364 and $3,383.
Until then, this move may simply be a short-term pullback within a broader downtrend. If price fails to reclaim $3,327, watch for a drop back toward $3,270, with a deeper correction targeting the $3,241–$3,211 zone.
📌 Key Levels to Watch:
Resistance:
$3,298 • $3,327 • $3,352 • $3,364 • $3,383
Support:
$3,270 • $3,241 • $3,211 • $3,179
🧠 Fundamental Focus:
This week is packed with high-impact events — including Non-Farm Payrolls on Thursday. These could trigger sharp moves in gold, so stay cautious and manage risk wisely.

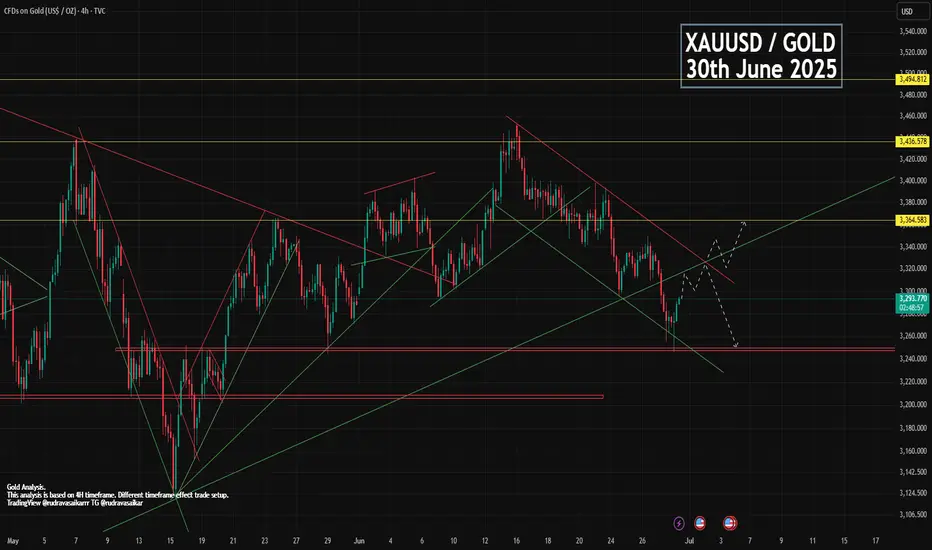
GOLD 30th JUNE - MONTH-END BULLISH OR BEARISHDue to war no update on gold, gold made bolt move downward. Slowly war has been becoming calm but no good news about it has been stopped completely. But you can see some great and correct structure in gold chart where you can find amazing entry and exit points. Gold lower was 1246 since then. Now gold is trading in bullish flag and expecting to breakout. And after breakout we can expect a big move upward.
Key point.
Support - 3248, 3272, 3289
Resistance - 3298, 3313, 3332, 3349
Comment and like for analysis. Love it then follow
Any Query Reach Us or comment down.
Follow for more updates.
Rudra Vasaikar Wishes You A Great And Very Amazing Trading Life. Trade Safe, Trade Right.
RISK WARNING 🔴 🔴 🔴
There is high risk of loss in Trading Forex, Crypto, Indices, CFDs, Features and Stocks. Choose your trade wisely and confidently, please see if such trading is appropriate for you or not. Past performance is not indicative of future results. Highly recommended - Information provided by Rudra Vasaikar/Pro Trading Point are for Educational purpose only. Do your investment according to your own risk. Any type of loss is not our responsibility.
HAPPY TRADING.
Elliott Wave Analysis – XAUUSD Trading Plan for June 30, 2025
🌀 Elliott Wave Structure
On the H1 chart, we observe a double zigzag correction WXY (in red). Currently, Wave Y appears to be developing as a green abc structure.
In this abc structure:
+ Wave a started with a leading diagonal (5-wave triangle).
+ Wave b followed as a typical abc correction (in black).
+ Wave c is currently unfolding as a clear 5-wave impulsive move, characterized by sharp and rapid price action.
The key issue now is to determine whether:
+ The price has completed wave 5 (black), or
+ It has only completed wave 3 (black) within the green wave c.
If the current movement is wave 3 (black), we should expect a wave 4 correction, followed by one more leg down to complete wave 5. In this scenario, wave 5 will be confirmed if the price breaks below 3255. There are two potential target zones for wave 5:
+ Zone 1: 3247
+ Zone 2: 3224
If wave 5 has already completed, the upward move to 3283 could be wave 1 of a new bullish trend. The next pullback would be wave 2, with an expected target between 3266 – 3261.
⚡️ Momentum Analysis
D1 timeframe: Momentum is in the oversold region, suggesting a high probability of a bullish trend in the upcoming week. This supports the view that wave c (green) of wave Y (red) is nearing completion.
H4 timeframe: Momentum is turning bullish, indicating the current upward movement may continue. This adds to the uncertainty about whether wave 3 or wave 5 has ended.
🧭 Trading Plan
📍 BUY ZONE 1
Entry: 3264 – 3261
SL: 3254
TP1: 3283 | TP2: 3297 | TP3: 3315
📍 BUY ZONE 2
Entry: 3247 – 3244
SL: 3237
TP1: 3283 | TP2: 3297 | TP3: 3315
⚠️ Important Note
This trading plan assumes either wave 3 or wave 5 has completed. Therefore, if in the early Asian session, the price does not touch the 3264 – 3261 zone but instead rises above 3283 without closing above 3297, and then drops back below 3283, we should avoid buying at 3264 – 3261.
Instead, we should wait for a potential entry at the 3247 – 3244 zone.

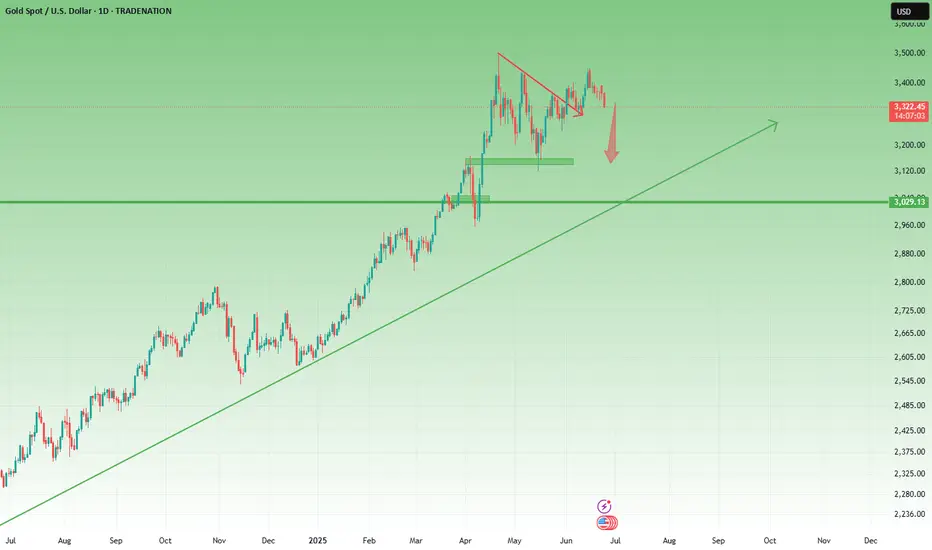
Gold Rebounds from 3250 – But Bears Still in Control1. What happened last week
As you know, I’ve been bearish on Gold all last week long. Even though the geopolitical situation in the Middle East escalated over the weekend, the fact that price couldn’t reclaim the 3400 resistance was a major red flag.
It showed us that the bullish sentiment was fragile, and that downside pressure is just around the corner.
And indeed — Gold sold off. The weekly close below the 3300 level confirmed the weakness.
2. The key question now
Has Gold found a bottom at 3250, or is this just a temporary rebound before another leg down?
3. Why I expect a continuation lower
- The weekly close was under 3300, breaking key support
- 3250 is being tested again — a level touched multiple times since the mid-April ATH
- The current rebound looks corrective, not impulsive
- Resistance levels at 3320 and 3340 are likely to hold as ceilings
- No major catalyst yet to justify a reversal
- This looks like a classic “sell the rally” setup in a weakening trend.
4. Trading plan
The idea is simple: sell the spikes.
If price bounces into 3320–3340, I will look to short again, anticipating a renewed test of the 3250 support zone.
If 3250 breaks — we could see acceleration toward 3200 or lower.
5. Final thoughts 🚀
No need to complicate things. Gold remains vulnerable unless it clears 3340. Until then, the trend is your friend — and that trend points down.
Disclosure: I am part of TradeNation's Influencer program and receive a monthly fee for using their TradingView charts in my analyses and educational articles.

Gold Price Forecast: Bulls Defend Key Support, Eyes on TrendlineTVC:GOLD Gold (XAU/USD) bounced from the $3,261 support zone after briefly dipping to a one-month low around $3,265 in early Asian trade. The rebound came as buyers stepped in at a major demand area, rejecting further downside and suggesting bullish intent.
Macro drivers include reduced safe-haven demand following the US-China trade agreement on rare earths and a temporary ceasefire between Israel and Iran. However, expectations of a Fed rate cut—especially after weaker US consumer spending data—could limit further losses.
Technically, OANDA:XAUUSD gold has formed a double bottom around $3,261, and price action now threatens to break above a descending trendline (TL1). A confirmed breakout above minor resistance at $3,283 may open the door toward $3,311 and potentially the upper trendline near $3,330.
Key Levels to Watch:
Support: $3,261 (defended), $3,250 (monthly low)
Resistance: $3,283 (minor), $3,311 (former support turned resistance), $3,330 (TL2 trendline)
📉 Trendlines: TL1 and TL2 still capping upside; breakout would confirm bullish shift
If bulls can maintain control above $3,283 and push through the trendline, a broader recovery could follow. However, failure to clear this zone may invite renewed selling pressure.
⚠️ Disclaimer: This analysis is for informational purposes only and does not constitute investment advice.

"The Great Gold Heist" – XAU/USD Master Plan🏆 "The Great Gold Heist" – XAU/USD Master Plan (High-Risk, High-Reward Loot!) 🚨💰
🌟 Attention, Market Robbers & Money Makers! 🌟
Hola! Oi! Bonjour! Hallo! Marhaba! 🤑💸
🔥 Based on the legendary Thief Trading Strategy (technical + fundamental heist tactics), here’s our blueprint to STEAL massive profits from the XAU/USD (Gold vs. Dollar) market! 🔥
🎯 The Heist Plan (Long Entry Setup)
Entry Point 📈: *"The vault is UNLOCKED! Swipe bullish loot at any price—but for a cleaner steal, set Buy Limits within 15-30M recent swing lows/highs. ALERT UP! ⏰"*
Stop Loss 🛑: "Thief’s SL hides at the nearest swing low (3H TF: 3250.00) OR below the last daily candle wick. Adjust based on your risk appetite & lot size!"
Target 🏴☠️: 3490.00 (or escape early if the cops—err, bears—show up!)
⚡ Scalper’s Quick Loot Guide:
"Only scalp LONG! Rich? Go all-in. Broke? Join the swing traders & rob slow ‘n’ steady. Use Trailing SL to lock profits!"
📊 Market Status:
XAU/USD (GOLD) – Neutral (But Bullish Sneak Attack Likely! 🐂💥)
"The heist is ON, but watch for traps—overbought zones, consolidation, and bearish robbers lurking!"
🔍 Pro Thief Moves:
✅ Fundamentals Matter! (COT Reports, Geopolitics, Macro Data, Sentiment—check our BIO0 for the full loot list!) 🔗👉🏻☝🏻
✅ News = Danger! Avoid new trades during releases. Trail your SLs to protect stolen cash! 📰🚨
💖 Support the Heist Crew!
"Hit the BOOST BUTTON 💥 to strengthen our robbery squad! More boosts = easier money steals daily!"
🚀 Stay tuned—another heist drops soon! 🐱👤💎

Gold's 3290-3300 Support : Next Week Aims for Gap-Up Retest Last week, gold opened with a gap-up on Monday 🔼, then trended downward 🔽.
⚡ Notably, the 3290-3300 support zone held firmly from Monday to Thursday, demonstrating strong resilience.
🌱 The price plunged to around 3255 on Friday but rebounded promptly.
🔥 For next week, the opening may surge toward the 3290-3300 zone, warranting close attention.
🚀 Buy@3260 - 3270
🚀 TP 3280 - 3290 -3300
Accurate signals are updated every day 📈 If you encounter any problems during trading, these signals can serve as your reliable guide 🧭 Feel free to refer to them! I sincerely hope they'll be of great help to you 🌟 👇

XAUUSD 30/6 – 4/7/2025: Selling Pressure Builds - In the past week, gold OANDA:XAUUSD has been under consistent selling pressure due to the following key macro factors:
- The U.S. Dollar Index (DXY) TVC:DXY surged, raising the opportunity cost of holding gold and leading to widespread sell-offs.
- 10-year U.S. Treasury yields hovered around 4.30%–4.35% , reinforcing expectations that the Fed will keep rates higher for longer.
- Core PCE data for June indicated that inflation remains elevated, reducing the likelihood of imminent rate cuts by the Federal Reserve.
- Geopolitical tensions in the Middle East have temporarily eased, diminishing gold’s safe-haven appeal in the short term.
➤ As a result, these combined factors are applying downward pressure on XAUUSD, especially after price decisively broke the 3,300 USD support zone.
1. Technical Analysis of XAUUSD – Daily Timeframe
On the D1 chart:
- Price has broken below the key support zone 3,300 – 3,331 USD, confirming a short-term bearish structure.
- The Fibonacci retracement from the 3,399 peak to the 3,295 low has completed its pullback to the 0.5–0.618 zone (3,345 – 3,359 ) but was strongly rejected by sellers.
- Price is now trading below both EMA20 and EMA50, indicating strong bearish momentum.
- RSI has turned back under 50 and has not yet reached oversold territory, suggesting further downside potential exists.
2. Key Resistance and Support Zones for XAUUSD
Technical Role ( 3,345 – 3,359 )
- Major confluence resistance (Fibonacci 0.618 + supply) ( 3,295 – 3,300 )
- Immediate resistance zone (post-breakdown retest) ( 3,260 – 3,235 )
- Short-term support and potential buy interest ( 3,223 – 3,205 )
- Strong medium-term support (Fibonacci 1.0 + April lows)
3. Trading Strategy for XAUUSD This Week (30/6 – 4/7/2025)
Strategy 1 – Favor Short Positions Aligned with Bearish Momentum
Entry: Sell near 3,295 – 3,300 (anticipating resistance retest)
Stop Loss: 3,304
Take Profit 1: 3,290
Take Profit 2: 3,285
Take Profit 3: 3,275
Strategy 2 – Countertrend Buy at Key Support with Confirmation
Entry: Buy near 3,235 – 3,240 only if bullish reversal candles (pin bar or bullish engulfing) appear on H4 or D1
Stop Loss: 3,230
Take Profit 1: 3,245
Take Profit 2: 3,250
Take Profit 3: 3,260
Ps : XAUUSD is currently in a downward correction phase, with the next target zone lying between 3,235 – 3,260 USD. The inability to hold above 3,300 confirms that sellers remain in control. The most favorable approach this week is to sell on rallies, especially near former support-turned-resistance zones.
Stay vigilant, follow updated price action closely, and strictly manage risk to protect your capital.
Follow for more high-probability strategies throughout the week – and save this idea if you find it valuable to your trading journey.
Analysis by @Henrybillion

Reverse Head & Shoulders Setup | Gold Spot | 15min | by Mohsen M
🔸 **Chart:** Gold Spot / USD (XAU/USD)
🔸 **Timeframe:** 15min
🔸 **Method:** Smart Money Concepts (SMC) + Pattern Recognition
🔸 **Focus:** Reverse H&S, Order Blocks, TLQ, BOS
---
## 🔍 Market Context:
- **Market Structure:** Bearish on higher TF
- **Short-Term Trend:** MSU (Market Structure Up)
- **Efficiency:** ✅ Confirmed — clean price delivery
- **Key Pattern:** Bullish **Inverse Head & Shoulders**
---
## 🧠 Technical Breakdown:
1. **Left Shoulder – Head – Right Shoulder** perfectly forming within a high-value demand zone
2. Price reacted strongly from **Order Block (OB)** + TLQ marked at the bottom wick (Head zone)
3. BOS confirms bullish attempt to shift structure
4. Anticipating neckline break at ~3345 level for further upside
5. Potential resistance and liquidity resting above 3400 (HH region)
---
## 📌 Trading Plan (Pre-London Open / Monday 1:30 AM UTC+3:30):
- **Entry Idea:**
Watch for bullish confirmation after price stabilizes above Right Shoulder zone (~3300–3320)
Or re-entry on a retest of neckline after breakout
- **Stop Loss:**
Below "Head" and OB zone (~3260)
- **Take Profits:**
- TP1: Neckline break zone (~3345)
- TP2: 3400 – Liquidity pool
- TP3: Final HH sweep (~3420+)
---
## ⚠️ Alternate Bearish Case:
> If price breaks below the "Head" zone and OB fails to hold,
> → Expect bearish continuation to the next liquidity zone near **VTA @ 3200**
---
## ✅ Summary:
This is a clean **bullish reversal setup** using SMC logic and a classic H&S pattern:
**OB + TLQ + BOS + Efficient Market + Clear Pattern ➝ High-Probability Setup**
Structure: 🟥 Bearish (macro)
Trend: 🔼 MSU (micro)
Efficiency: ✅ Efficient
Pattern: 🟩 Inverse Head & Shoulders
---
📊 Prepared by: **Mohsen Mozafari Nejad**

XAUUSD: We must adapt to the market conditions! Bears in ChargeGold prices dropped as Trump announced a ceasefire between Iran and Israel, causing a significant decline. We anticipate this trend to persist, as recent price data, including volume and price momentum, indicates a strong seller’s control in the current market conditions. We have two targets for you to set your own based on your analysis, along with a stop-loss based on your strategy.
We appreciate your unwavering support throughout the years. Please like and comment.
Team Setupsfx_
❤️🚀

XAU/USD (Gold) Breakout or Breakdown Setup – Key Decision ZoneThe Gold Spot (XAU/USD) price action is currently at a crucial inflection point after consolidating in a rising wedge pattern between ascending support and horizontal resistance. This type of structure typically indicates a strong directional breakout is likely, and the current daily candle shows a close below the ascending support, signaling a potential bearish breakdown confirmation.
🔽 Bearish Breakdown Scenario (Confirmed Below 3250)
If price sustains below the 3250 support breakdown level, it confirms a bearish breakdown from the wedge. The height of the wedge (distance between the base of the move and the resistance) is used to project the downside target, giving us key levels to monitor:
Breakdown Confirmation: Below 3250.00
Target 1: 3111.67
Target 2: 2990.31
Projected Downside Target: 2861.24
This move suggests that gold could enter a deeper correction if buyers fail to reclaim the ascending structure quickly.
🔼 Bullish Breakout Scenario (Above 3500)
On the flip side, if bulls manage to push price back above the 3500 level, it would invalidate the current bearish momentum and confirm a bullish breakout. The projected upside targets are based on the same measured move logic:
Breakout Confirmation: Above 3500.00
Target 1: 3621.90
Target 2: 3741.84
Projected Upside Target: 3855.78
A close above 3500 with volume would set the tone for a fresh rally toward new highs.
🧭 Strategy Outlook
Short Bias (active): Entry below 3250; SL above 3300; TP at 3110 / 2990 / 2860
Long Bias (if reversal): Entry above 3500; SL below 3460; TP at 3620 / 3740 / 3850
Always wait for a strong daily candle close beyond the breakout/breakdown levels before initiating any trades
=================================================================
Disclosure: I am part of Trade Nation's Influencer program and receive a monthly fee for using their TradingView charts in my analysis.
=================================================================

XauUsd for LongAs for i see Xauusd in Downside for correction first target is 3200 2nd Target is 3155.
It is my Analysis may be it will be wrong no one predict market’s future.
Note:- It is not Financial Idea may people lose money.!
Trade your own never give to Manage.

Gold Analysis and Trading Outlook – June 27Good morning, everyone!
Yesterday, gold encountered resistance in the 3348–3352 zone and fell back to around 3310 before rebounding toward the 3336 resistance area. Today’s session opened with renewed weakness, and so far, the overall price action has closely followed our expectations. Whether it was selling near resistance, buying after the dip, or shorting the rebound, each opportunity yielded solid profits.
Some traders have asked about my strategy’s win rate. Those who’ve followed consistently already know—the overall win rate has remained above 80%, with very few instances of error. Even in the rare case of a misjudgment, I apply specific recovery strategies to minimize risk and avoid large losses. That’s the core reason why I’m confident I can help many traders.
Technically, the daily chart still shows a bearish trend, and prices are now approaching the key 3300 support zone. While the current geopolitical uncertainty adds complexity, it doesn't prevent us from executing flexible intraday trades. In fact, range-bound markets can still be highly profitable with a disciplined approach.
Key intraday levels to watch:
Dynamic support: 3318–3313
Major support: 3300–3287
Resistance levels: 3336, 3348–3352, and 3370
Today’s trades can continue to focus on these levels, using a sell-high, buy-low strategy with flexibility.

"Gold Vault Breach! XAU/USD Heist Plan in Motion"🏴☠️💰 XAU/USD Gold Heist Blueprint 💰🏴☠️
“The Vault’s Open… Time to Load Up!”
🌟Hi! Hola! Ola! Bonjour! Hallo! Marhaba!🌟
Dear Money Makers & Market Robbers 🤑💰💸✈️
Get ready to execute the Golden Robbery with style and precision! Based on our 🔥Thief Trading Style🔥 using both technical & fundamental weapons, we’ve decoded the latest gold vault password: XAU/USD (Gold vs USD) is showing bullish bias!
🎯 Heist Instructions:
📈 Entry Point –
“The vault is wide open!”
Enter long anytime — but for the sharp shooters, place buy limits on the most recent 15/30min swing lows or pullback zones for a stealthier entry. Let the retracement pull the guards away 😏🔐
🛑 Stop Loss –
🔒 Set your Thief SL just below recent swing lows on the 4H timeframe (around 3310.0).
🔧 Adjust based on risk tolerance, lot size, and number of open trades — every heist has its escape plan!
🏁 Target Zone –
🎯 Aim for 3395.0 — or vanish before the cops show up!
Trail the stop as you go and don’t get greedy — wealth is preserved when exits are clean! 🏃♂️💨
🧲 Scalper's Advisory:
Only steal on the Long Side! Bulls are funding this operation.
💼 Big pockets? Dive in.
💳 Small stack? Swing with the pros & follow the plan.
🎯 Use Trailing SL to keep the loot safe.
📊 Market Insight – Why We Rob Gold Now?
XAU/USD shows bullish momentum 🐂 backed by:
Macro & Fundamental Data 🧠
Geopolitical & Intermarket Trends 🌍
COT Reports & Sentimental Outlook 💼
Dollar Weakness + Safe Haven Flow 💸
📚 Always cross-check the news wires & reports to validate the path! Fundamentals are the lockpick tools behind every breakout! 🔓📈
⚠️ Stealth Warnings:
📆 News Events = Increased Surveillance!
🚫 No new entries during high-volatility news drops.
🛡 Use Trailing SL on live trades to secure the bag.
💖 Wanna Support Our Heist Style?
Smash that 🚀 BOOST BUTTON 🚀
It fuels our Thief Army and helps you & your crew loot the market with confidence and flair!
Every day’s a new caper — follow the plan, manage your risk, and stay outta jail! 🏆💪🤝🎉
🔐 See you in the next Robbery Blueprint — Stay Locked & Loaded!
🐱👤💼📈💣💸

Gold Fails to Hold the Fear – Ceasefire Triggers 500+ Pip DropIn yesterday’s analysis, I pointed out that despite the weekend escalation in the middle-east, which triggered a gap up in Gold, the price action didn’t confirm the fear narrative. Gold failed to hold its gains – a clear sign of weakness.
📌 What happened next?
Throughout the day, Gold attempted multiple pushes toward 3400 – but each effort was met with strong selling pressure.
Then came the ceasefire announcement… and Gold dropped hard, now trading around 3320, locking in over 500 pips of profit from my short setup.
________________________________________
❓ More importantly, what’s next for Gold?
More important than the short-term noise is what the charts are now telling us:
📉 Weekly chart? Bearish.
🕯️ Daily chart? Also turned bearish after last week’s indecisive price action.
________________________________________
📌 Strategy remains the same:
I continue to sell rallies, and I’m now watching the 3280 support zone for a possible test in the coming hours.
Patience. Discipline. Let the market come to you. 🚀
Disclosure: I am part of TradeNation's Influencer program and receive a monthly fee for using their TradingView charts in my analyses and educational articles.
Waiting for data release to rebound and short📰 Impact of news:
1. PCE and Consumer Index
📈 Market analysis:
The current price of 3280 has a higher profit and loss ratio advantage. Technical indicators show that the hourly chart is severely oversold. Combined with the top and bottom conversion of 3300 above, there is a 20-point rebound space in the short term. If the PCE data is in line with the trend, gold prices are expected to quickly regain the 3,300 mark. Note that negative data beyond expectations may cause a brief decline.
🏅 Trading strategies:
BUY 3295-3280-3275
TP 3298-3300-3310
SELL 3300-3310
TP 3290-3280-3260-3250
If you agree with this view, or have a better idea, please leave a message in the comment area. I look forward to hearing different voices.
TVC:GOLD FXOPEN:XAUUSD FOREXCOM:XAUUSD FX:XAUUSD OANDA:XAUUSD

Gold Spot / U.S. Dollar - 4 Hour Chart (OANDA)4-hour chart from OANDA shows the price movement of Gold Spot (XAUUSD) against the U.S. Dollar, with the current price at 3,282.135, reflecting a decrease of 45.685 (-1.37%). The chart includes a descending trendline, support and resistance zones (highlighted in pink and teal), and key price levels ranging from 3,244.835 to 3,400.000. The analysis suggests a potential downward movement as the price approaches a support zone near 3,244.975, with indicators like the U.S. flag and lightning bolt possibly signaling significant market events or volatility.
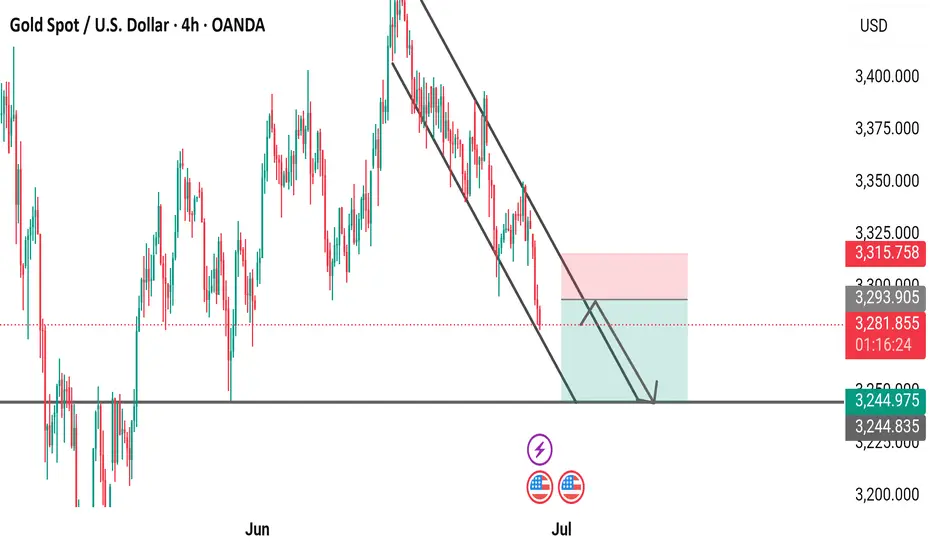
Gold Spot / U.S. Dollar (XAUUSD) 4-Hour Chart - OANDA4-hour chart from OANDA shows the price movement of Gold Spot against the U.S. Dollar (XAUUSD), with the current price at 3,282.080, reflecting a decrease of 45.740 (-1.37%). The chart includes a downward trendline indicating a potential bearish trend, with key support and resistance levels marked at 3,245.627 and 3,316.901, respectively. The chart covers data from June to July 2025, with the latest update at 01:22:46.
