XAU/USD Bearish Pattern Analysis XAU/USD Bearish Pattern Analysis 📉
The chart presents a potential bearish continuation setup in the XAU/USD pair, highlighted by technical structures and key price levels:
📊 Technical Breakdown:
🔸 Bearish Rejection from Resistance
Price rejected strongly from the 3,440.000 resistance zone, marked with a red arrow.
This area has acted as a historical supply zone, triggering repeated reversals.
🔸 Descending Channel Formation 📉
A clear bearish flag/channel structure is visible post-rejection.
Price action broke down from the channel, signaling potential trend continuation.
🔸 Target Level 🎯
The expected target is around 3,304.374, aligning with previous support zones and structure lows.
This level coincides with a measured move from the channel breakdown.
🔸 Higher Lows Pattern Before Reversal ⭕
Prior to the current decline, the market formed a series of higher lows, highlighted with orange circles — suggesting a buildup before reversal.
🧭 Key Levels to Watch:
Resistance: 3,440.000 – 3,420.000 🔼
Current Price: 3,368.750
Short-Term Target: 3,304.374 🎯
Major Support: 3,140.000 – 3,160.000 🛡️
📌 Outlook:
The rejection from resistance coupled with the descending channel breakdown indicates bearish momentum. If the market maintains below the recent high, further downside towards 3,304 is expected. Break below this may expose deeper support zones.
📉 Bias: Bearish
⏳ Short-term Action: Watch for breakdown confirmation and momentum continuation.
Xauusdupdates

GOLD[XAUUSD]: Breakthrough the bearish pressure, What next?Evening Everyone,
Hope you are doing great, price recently breakthrough the current price inducement, showing a strong bullish volume emerging in the market. Long term approach remain bullish ultimately taking the price towards the new high.
Good luck
Team Setupsfx_

XAUUSD Trading Signals: Buy Dips at 3335-3345 Amid Bear Trap💡 Trading Framework In-Depth Analysis:
The Fed's policy statement failed to stir volatility (markets had fully priced in dovish expectations 💨);
Weekly market pattern: Asian sessions consistently saw rallies 📈, followed by profit-taking pullbacks in subsequent sessions 📉;
Tactical entry logic: Use intraday highs in Asian trading as resistance references for long positions 🎯.
📊 Technical Validation & Risk Anchors
⚠️ Key Warning: Geopolitical bullish signals ignored → classic "bear trap" characteristics (bear trap 🚫);
⏳ Timing Strategy: Asian session highs form ideal resistance levels—recommend entering on pullbacks to the 38.2% Fibonacci support level 🎯.
⚡️⚡️⚡️ XAUUSD Precision Trading Signals ⚡️⚡️⚡️
🚀 Long Entry Range: 3335-3345 (stop loss can be set below 3325)
🚀 Take-Profit Target Range: 3360-3370 (partial profit-taking at first target 3360 recommended)
📢 Service Value-Added Notes
✅ Core trading signals updated daily in the morning (validated across 4-hour/daily double-timeframes);
✅ Refer to signal logic at any time during trading for sudden situations 🧭 (with historical win-rate statistics attached);
🌟 Wishing you smooth trading Next week — seize pullback opportunities to position 👇
GOLD H4 Chart Weekly Update For 23 - 27 June 25Hello Traders,
welcome to the weekly update, as you can see that market was in range last week
as for now 3400 Psychological remains in focus if market breaks 3400 successfully the GOLD will rise towards 3440
only breaks below 3330 GOLD will leads towards 3250 possibly
FED Chair Powell Testifies due in the upcoming week
USPCE PRICE INDEX due on Friday
Disclaimer: Forex is Risky

The rebound is weak, is it expected to continue to decline? 📰 Impact of news:
1. Geopolitical situation
2. Pay attention to the impact of short-term trends of the US dollar and silver on gold
📈 Market analysis:
The weekly level large range sweep is still going on, with a focus on the space defense dividing line area of the 10-day moving average and the 3315-3310 area. After falling back to the lifeline in four hours, it continued to bend downward under pressure. During the sweeping decline, the suppression became more obvious. Whether there will be a wave of large-volume market, the pattern is expected to further open and guide the direction. In this process, note that the lifeline 3375 is also the resistance point determined by the last rebound last night. Use this as suppression to sweep the range below. On the whole, for the future gold, if it can maintain the rhythm of defending highs and breaking lows, and successfully closes at a low level today, then next week it is expected to further switch downwards to sweep space. Therefore, we will continue to focus on two support areas, one is 3345-3335, and the other is 3315-3310 after breaking
🏅 Trading strategies:
BUY 3345-3335
TP 3355-3365
SELL 3365-3375
TP 3345-3335-3315
If you agree with this view, or have a better idea, please leave a message in the comment area. I look forward to hearing different voices.
TVC:GOLD FXOPEN:XAUUSD FOREXCOM:XAUUSD FX:XAUUSD OANDA:XAUUSD

Elliott Wave Analysis – XAUUSD Trade Plan for June 19, 2025🌀 Wave Structure
On the H4 timeframe, following a strong selloff, price is now consolidating within a narrow price channel — suggesting that we are currently in wave b (black) of an abc correction.
This structure implies that one more leg down is likely to complete wave c (black). However, due to the overlapping and sideways nature of the move, it's difficult to clearly identify the end points of waves a and b, making traditional Fibonacci targeting less effective.
➡️ To improve accuracy, we’re combining Volume Profile data with price action and have identified four key support zones:
3349, 3335, 3313, and 3297
Among these, we’re giving special attention to:
🎯 Target 1: 3335
🎯 Target 2: 3297
We'll wait for bullish momentum signals near these levels to increase the probability of catching the end of wave c.
🔋 Momentum Outlook
Daily (D1): Momentum is about to enter oversold territory. By the end of today or tomorrow, the daily candle is expected to confirm this — suggesting a weakening bearish trend.
H4: Also approaching oversold. If price is hovering around one of the key support levels (3349 | 3335 | 3313 | 3297) when this happens, and the D1 is already oversold, then we may be looking at a high-probability reversal zone.
H1: Nearly oversold as well — expect a short-term bounce soon. The best timing for a BUY will be when the H1 starts turning bullish while both the D1 and H4 are oversold.
✅ Trade Setup
🔹 Scenario 1
BUY ZONE: 3336 – 3333
SL: 3326
TP1 | TP2 | TP3: 3345 | 3378 | 3402
🔹 Scenario 2
BUY ZONE: 3300 – 3297
SL: 3290
TP1 | TP2 | TP3: 3313 | 3345 | 3402
⏳ Patience is key — wait for confluence between support zones and momentum reversals. That’s where the high-probability BUY setups emerge.

XAUUSD: Is Bullish Trend Ended? Or It is just beginning big moveAs we previously stated that price can reverse between 3340 to 3350 region, which was a pivotal point for bulls. Price smoothly moved currently trading at 3376 and possibly bullish move continuing towards 3400,3450 and ultimately reaching 3600.
Following the price’s all-time high at $3500, it experienced a sharp decline and failed to maintain that level. A substantial 2400 pips would have resulted in significant losses for many accounts. Initially, it was perceived as a minor correction, with the expectation of further price appreciation. However, this assumption proved incorrect. After reaching an even higher peak, the price invariably undergoes a more substantial correction.
At 3260, substantial bullish volume surged into the market, necessitated by the presence of a fair value gap. Subsequently, the price experienced a decline, reflecting the prevailing bearish trend, which favoured the bears. However, at 3200, a pivotal level representing a discounted price point, bull volume surged. This powerful bullish impulse propelled the price to 3432, ultimately confirming the bullish trend. AB=CD there recurring pattern emerged weekly. When the price reached the 3432 level as a fair value gap, the CD pattern commenced.
AB=CD we have identified a recurring pattern. It appears to be an equal move in any direction, and it has manifested precisely as anticipated. We were aware that the price would reject at 3120, and it did so accordingly. Currently, the market is in our favour. Upon market opening, it exhibited a positive gap, propelling the price to 3450. However, it subsequently declined, reaching 3384.
Presently, we find ourselves in the accumulation phase, poised for distribution. This distribution is anticipated to be substantial, potentially leading to another record high, potentially reaching 3650.
Moving forward, the price could continue towards our target from its current position. Alternatively, there exists a possibility that it may drain the sell-side liquidity and reverse from 3360-3370.
Our take-profit levels are set at 3450, 3490, 3520, and finally, 3600. When entering the market, it is advisable to employ a short time frame. It is important to note that this analysis is merely our opinion, and market conditions may deviate from expectations.
We extend our best wishes for success and safe trading. If you wish to demonstrate your support, you may consider liking, commenting, or sharing this analysis with others.
Sincerely,
Team Setupsfx_

Gold Pullback: Bear Trap or Buy Dip?📊 Chart Analysis: A clear pullback within the established uptrend is visible, testing key support at —a healthy correction that reinforces the bullish structure.
🔍 News Contradiction🌍: Despite escalating Middle East tensions (typically a gold-positive catalyst), prices are trending lower—a classic bear trap scenario 🚫📉. This divergence underscores the importance of buying dips amid emotional sell-offs.
💡 Trading Framework:
Fed policy statement yesterday failed to spark volatility, as markets had already priced in dovish expectations 💨;
Weekly pattern: Asian sessions have consistently seen rallies 📈, followed by profit-taking pullbacks in later sessions 📉;
Tactical entry: Use intraday highs from Asian trading as resistance references for long positions 🎯.
Technical Confirmations:
Risk Warning: Geopolitical bullish signals being ignored suggests deliberate bearish manipulation (bear trap 🚫);
Timing Strategy: Asian session highs serve as ideal resistance markers—look to enter on retracements to 38.2% Fib levels 🎯
⚡️⚡️⚡️ XAUUSD ⚡️⚡️⚡️
🚀 Buy@ 3335 - 3345
🚀 TP 3360 - 3370
Accurate signals are updated every day 📈 If you encounter any problems during trading, these signals can serve as your reliable guide 🧭 Feel free to refer to them! I sincerely hope they'll be of great help to you 🌟 👇

Trade Idea: Long on XAUUSD (15min)Trade Idea: Long on XAUUSD (15min) OANDA:XAUUSD
I'm going long on gold after spotting a liquidity sweep below the previous low. Price aggressively grabbed liquidity from the downside and showed a bullish reaction — a clear sign of smart money accumulation.
The market structure remains bullish on higher timeframes, and this entry aligns with a potential trend continuation after a stop-hunt move. The entry is placed just after the liquidity grab, aiming for a clean upside move toward the imbalance and minor resistance zone.
🟢 Entry: 3353.30
🔴 Stop Loss: 3350.67 (Below liquidity sweep)
🎯 Take Profit Zone: 3362–3366
🧠 RR Ratio: Favorable
#XAUUSD #Gold #SmartMoneyConcepts #LiquiditySweep #TrendFollowing #PriceAction #ForexTrader #GoldTrading #OrderBlock #SupplyAndDemand #SwingTrade #DayTrading #MarketStructure #ForexAnalysis #TradingView #RiskReward

gold on sell#XAUUSD price await breakout below 3354.5 for selling.
Below 3354.5 have low bearish which will drop firstly below 3346-3334.46, SL 3364.8
Below 3345 have a strong bearish continuation which will drop more. Any possible buy above 3364.8 on H1 closure will start bullish from there.

Gold XAUUSD Summer Price Action - Trading Psychology☀️ Summer Trading Blues? Here’s How to Stay Sharp Without Burning Out
Summer trading on Gold isn’t for the impulsive or the greedy. Liquidity dries up, sessions lose momentum, and the clean, aggressive price action we love? It goes on vacation too.
But that’s not a bad thing. It’s an opportunity.
This is the season where traders either burn out... or build.
Here’s how to keep your edge sharp while the markets slow down — and why a positive, focused mindset is your biggest asset until volatility returns.
Why Summer PA Feels “Off” on Gold
You’re not imagining it — gold price action does shift in the summer, and here’s why:
🏖️ Bank Holidays & Institutional Slowdowns
• Major global banks take scheduled breaks — including in the US, UK, EU, and Asia.
• Trading desks reduce activity, and high-volume players shift into passive management mode.
• This results in lower volume, fewer impulsive moves, and more algorithmic fakeouts.
📆 Official Holidays + "August Mode"
• US Independence Day (July 4), UK Summer Bank Holiday (late August), and more → NY and London sessions thin out or lack follow-through.
• Most institutional traders go on leave. Some desks run skeleton crews. No joke.
• Unless a major geopolitical catalyst (e.g. war escalation or surprise central bank move) hits the headlines, price will drift or trap.
🏄♂️ Retail Overreach & Emotional Traps & Vacation Time
• Retail traders often “force” trades in quiet markets to stay busy.
• This leads to chasing, overtrading, and emotional fatigue — the exact trap smart traders avoid.
• Most regular traders also go on vacation or scale back — unless they’re mentally obsessed with Gold and can’t let it go.
Bottom line:
Summer PA is slower, trickier, and full of emotional bait. Learn to read the stillness — not fight it.
💡 Your Summer Trading Mindset Kit
Instead of complaining about the range, use this time to train your mindset.
Here’s how:
⚖️ Stay Emotionally Neutral — Even When Price Isn’t
Summer markets bait your emotions: fake breakouts, slow reactions, and dead zones.
To stay in control, build structure around your execution:
✅ Pre-market: Make a clear plan with meaningful zones and set alerts — don’t wing it on hopes and dreams
✅ Post-market: Write down why you stayed out or why your trade was clean — not just wins or losses
Neutrality isn’t passive — it’s disciplined clarity, even when the chart’s doing nothing.
🎯 Focus Over FOMO
Short sessions. Laser focus. Clean execution.
→ Limit distractions
→ Trade only clear, structured setups
→ Respect no-trade days as productive days
Flow isn’t magic — it’s discipline + environment.
🤝 Find the Trading Circle That Matches Your Style — to reinforce your style
Not every group fits you — and not every voice deserves your attention.
Look for people who:
• Respect structure over noise
• Give thoughtful, honest feedback
• Celebrate patience and growth, not screenshots and bragging and 20-30 pips wins
A real trading circle matches your energy and raises your game — not your cortisol.
💭 Reconnect With Your “Why”
If you’re here just to “make money,” summer will test you hard.
Purpose anchors you when price doesn’t. Ask yourself:
• Why do I trade?
• Who am I becoming through this process?
No purpose = burnout.
Purpose = clarity, even in silence.
📈 Discipline Pays When Gold Doesn’t
Forget chasing fireworks in dead markets.
Summer rewards the trader who does less but does it right:
✅ You skipped noise? That’s a win.
✅ You waited for your zone? Pro-level move.
✅ You tracked your behavior? You’re not guessing — you’re evolving.
While others burn out chasing crumbs, you’re stacking discipline — and that’s what you’ll cash in when the real moves return.
Final Words: Quiet Traders Get Loud Later
Summer might be slow. But your growth doesn’t have to be.
While others force trades, smart traders sharpen edge.
You’re not falling behind by sitting out chop — you’re building mastery for when real money moves return.
🗓️ So in September YOU are going to show up: stronger, clearer, and 3x more prepared.
If this lesson helped you today and brought you more clarity:
Drop a 🚀 and follow us✅ for more published ideas.

Gold Eyes Breakout from Ascending Channel Toward $3,500📈 Chart Analysis
1. Rising Channel Structure
Gold (XAU/USD) has been trading within an upward-sloping channel, marked by the blue trendlines connecting interior lows and highs, culminating at point C (~$3,497). The latest bounce off the lower channel near “B” reinforces bullish bias – if this trendline holds, another leg higher toward resistance around $3,497–$3,500 is likely.
2. Support & Resistance Confluence
The purple trendline and the dotted horizontal green level (~$3,498) converge near the projected breakout point. This synergy provides a strong pivot zone — a successful breakout would validate targets near channel highs.
3. Harmonic Pattern in Play
The chart displays a bullish harmonic structure (likely a Bat or Gartley formation), with retracement ratios (0.719, 1.627) anchoring reversal areas. These reinforce the bounce at B and the potential move toward point C.
4. Trade Scenarios
Bullish Scenario (primary): A bounce off the trendline triggers a rally to the channel top and resistance zone ($3,497–$3,500).
Bearish Caution: A drop below the trendline invalidates the pattern, potentially bringing prices back to horizontal support around $3,296 or even $3,120, as indicated at point A.
🛠️ Technical & Market Context
Technicals: Daily trend remains bullish as long as price holds above ~$3,340–$3,350, with resistance forming in the $3,380–$3,400 range
Fundamentals: Geopolitical tension (e.g., Middle East conflict) and safe-haven inflows continue to underpin gold — though Citi expects prices to eventually correct toward $3,300–$3,500 mid‑term
.
Sentiment: Some analysts advocate “selling the rallies,” especially into the $3,450–$3,500 zone . But central banks’ ongoing buying and potential Fed rate cuts support a stronger floor
.
✅ Trade Strategy
Scenario Entry Zone Target Stop Loss Placement
Play the Bounce ~$3,350–$3,360 $3,497–$3,500 Below trendline near B zone (~$3,320)
Breakout Trade On momentum above $3,400 $3,497–$3,550 Below breakout (sub-$3,380)
Bearish Trigger Break & close below trendline Back to $3,296 / 3,120 Just above trendline ($3,360)
🔍 Summary
Gold remains in a structurally bullish setup inside an ascending channel. The confluence of harmonic reversal, strong trendline support, and pending fundamental catalysts presents a high-probability opportunity to push toward the $3,500 area—provided the trendline and $3,340–$3,350 support hold. A drop below would invalidate the bullish outlook and favor deeper retracement.

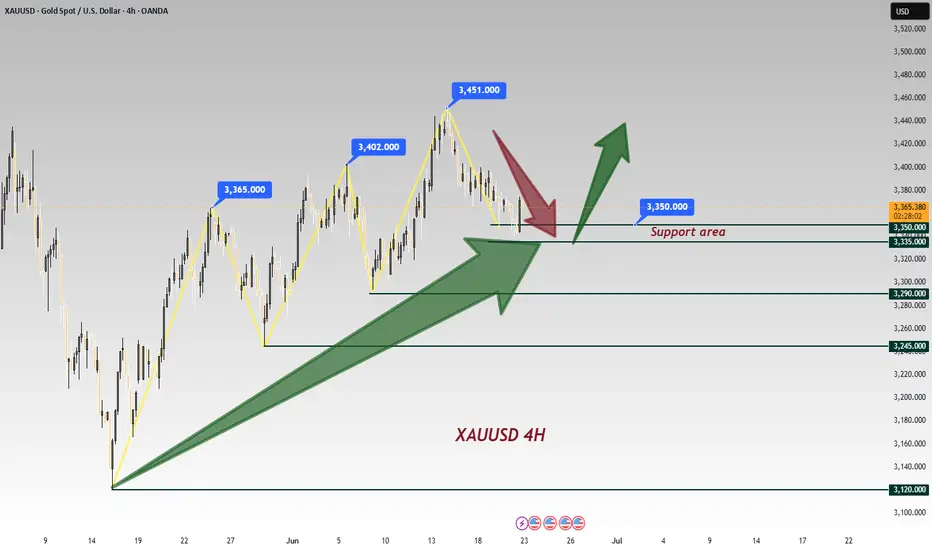
Gold (XAU/USD) 4-Hour Analysis- 20 June 2025On the 4-hour chart, gold has been trading in a fairly wide range.
The market has not clearly broken down, and many analysts see it as still structurally bullish as long as key support holds. Currently price is pulling back toward a confluence of support around $3,353–$3,355 (a zone overlapping a trendline and prior demand).
In other words, buyers have defended roughly the 3,340–3,355 area recently. Resistance lies just above in the $3,370–$3,380 region, with a major psychological pivot at $3,400. One analyst notes gold is “boxed between resistance at $3,450 and support at $3,340–$3,335”, so the immediate bias depends on these zones.
A clean break above 3,380–3,400 would signal bullish continuation (targeting 3,450+), while a drop below the 3,340–3,350 support zone would shift the bias bearish.
Overall, the market structure on H4 is mixed-to-bullish: we see higher swings in larger timeframes, and only a minor short-term down leg so far. As one analysis notes, gold remains “structurally bullish” and an upside break could chase the $3,500–$3,550 area.
Key Zones and Levels (4H)
Strong Support (Demand) Zone: ~$3,340–$3,355. This zone (around the recent swing lows) has attracted buying. Analysts mark $3,350–$3,355 as a key buy zone. Breaking below ~$3,340 would be a warning, putting 3,300 as the next floor.
Supply Zone / Resistance: ~$3,370–$3,380. This is the near-term resistance cluster (multiple analysts cite 3,370–3,380 as key). A rejection here would keep gold rangebound.
Major Pivot: $3,400. This round number is acting as an important hurdle. A decisive close above $3,400 would open the door to the $3,434–$3,450 area (prior highs). Conversely, failure at $3,400 can push price back toward the support zone.
Larger Resistances: If the uptrend resumes, look to ~$3,450 (April swing high) and beyond. Many long-range targets point to $3,500+ in a strong bull move.
Secondary Supports: Below the main support zone, watch ~$3,300 and down at $3,281 (the 50-day moving average). These act as deeper floors if weakness continues.
4-Hour Bias
In plain terms, as long as $3,340–$3,355 holds as support, the bias tilts bullish or neutral. We can say bullish bias above that zone: buyers will look to enter on pullbacks there. If price stays under $3,370, gains will likely be capped short-term. A break above $3,380/$3,400 would confirm a bullish breakout. On the flip side, a break below $3,340 shifts us to a bearish bias, with attention turning to lower support levels. On indicators, shorter-term momentum has eased (recent RSI is flattening around 60), suggesting some fatigue. But the longer-term trend is up, supported by strong safe-haven demand (central bank buying, geopolitical risk).
In summary: neutral-to-bullish on 4H, favor buyers near support but cautious near overhead supply.
Intraday (1H) Setups
Zooming into the 1-hour chart, we look for trades that align with the above bias. The clearest setups involve buying around demand zones and selling near supply areas:
Buy the Dip (~$3,344–$3,355): Wait for gold to dip into the 3,340–3,350 area. If you see a bullish price-action signal (e.g. a clear hammer or bullish engulfing candle), that’s a potential buy. Place a stop just below (~$3,335). Initial targets are around $3,370–$3,380 (near resistance). For example, one analysis suggests: “Buy XAU/USD at 3,344–3,348, TP 3,365–3,370, SL 3,335”.
Sell the Rally (~$3,375–$3,380): If price runs up to $3,375–$3,380 and shows signs of stalling (e.g. bearish candle), consider a short. Stop would be just above (~$3,385), with a target back down toward $3,355–$3,360 or the 1H demand zone. (One example from analysis: “Sell XAU/USD at 3,375–3,380, TP 3,355–3,360, SL 3,385”.) This aligns with fading the high of the range.
Breakout Strategy: If momentum is strong and gold breaks convincingly above ~$3,380–$3,400 on the 1H, one can enter long on the breakout. The next resistances are ~$3,434 and $3,450.
Stops should be very tight in that case (just under the breakout candle).
Risk Management: Keep position sizes small (1–2% risk). Use stops under/above the structural levels. Always wait for a clear 1H candle signal before pulling the trigger, to avoid false moves.
Key 1H levels: We can cite the strong short-term zones: support ~$3,344–$3,348 and resistance ~$3,375–$3,380.
If price skims these areas, watch carefully for a signal to buy or sell as described above. If 1H breaks below $3,340, be ready for a move toward the lower demand zone (around $3,335) or even $3,300–$3,280.
Takeaway
Gold is currently trading between ~$3,340 and $3,380 on the 4H chart. The simplest guidance is to trade the range: buy on dips near $3,340–$3,355 with stops just below, aiming for the $3,370–$3,380 area, and sell near $3,375–$3,380 if rallies stall. Maintain a bullish tilt as long as that $3,340+ support holds, but be ready to switch bearish if gold decisively closes under ~$3,340.
Single Takeaway: Treat ~$3,340–$3,355 as a key demand zone – a bounce here would be a high-probability long entry (targeting $3,370–$3,380), whereas a break below would turn the bias lower.

Gold Spot / U.S. Dollar (XAU/USD) 4-Hour Chart4-hour chart displays the price movement of Gold Spot against the U.S. Dollar (XAU/USD) from early June to mid-June 2025. The price, currently at $3,350.76, has experienced a recent decline of $19.76 (-0.59%) as of 01:06:10. The chart highlights a downward trend with a shaded area indicating a potential support or resistance zone between $3,310.41 and $3,374.21. Key price levels are marked, showing fluctuations between $3,300.00 and $3,374.21 over the observed period.

XAUUSD Analysis todayHello traders, this is a complete multiple timeframe analysis of this pair. We see could find significant trading opportunities as per analysis upon price action confirmation we may take this trade. Smash the like button if you find value in this analysis and drop a comment if you have any questions or let me know which pair to cover in my next analysis.

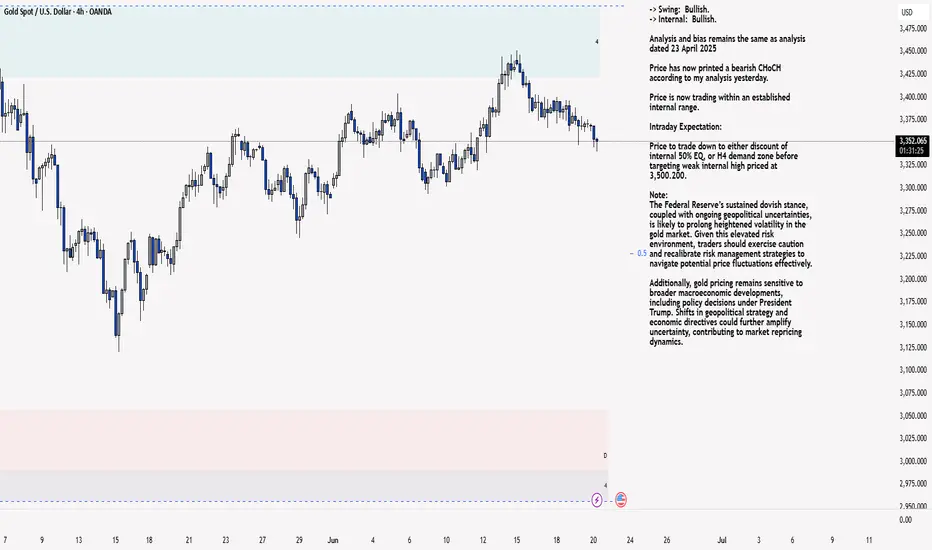
XAU/USD 20 June 2025 Intraday AnalysisH4 Analysis:
-> Swing: Bullish.
-> Internal: Bullish.
Analysis and bias remains the same as analysis dated 23 April 2025
Price has now printed a bearish CHoCH according to my analysis yesterday.
Price is now trading within an established internal range.
Intraday Expectation:
Price to trade down to either discount of internal 50% EQ, or H4 demand zone before targeting weak internal high priced at 3,500.200.
Note:
The Federal Reserve’s sustained dovish stance, coupled with ongoing geopolitical uncertainties, is likely to prolong heightened volatility in the gold market. Given this elevated risk environment, traders should exercise caution and recalibrate risk management strategies to navigate potential price fluctuations effectively.
Additionally, gold pricing remains sensitive to broader macroeconomic developments, including policy decisions under President Trump. Shifts in geopolitical strategy and economic directives could further amplify uncertainty, contributing to market repricing dynamics.
H4 Chart:
M15 Analysis:
-> Swing: Bullish.
-> Internal: Bullish.
Following previous high, and printing of bearish CHoCH, price has pulled back to an M15 supply zone, where we are currently seeing a reaction. Therefore, I shall now confirm internal high.
Price is now trading within an established internal range.
The remainder of my analysis shall remain the same as analysis dated 13 June 2025, apart from target price.
As per my analysis dated 22 May 2025 whereby I mentioned price can be seen to be reacting at discount of 50% EQ on H4 timeframe, therefore, it is a viable alternative that price could potentially print a bullish iBOS on M15 timeframe despite internal structure being bearish.
Price has printed a bullish iBOS followed by a bearish CHoCH, which indicates, but does not confirm, bearish pullback phase initiation. I will however continue to monitor, with respect to depth of pullback.
Intraday Expectation:
Price to continue bearish, react at either M15 supply zone, or discount of 50% internal EQ before targeting weak internal high priced at 3,451.375.
Note:
Gold remains highly volatile amid the Federal Reserve's continued dovish stance, persistent and escalating geopolitical uncertainties. Traders should implement robust risk management strategies and remain vigilant, as price swings may become more pronounced in this elevated volatility environment.
Additionally, President Trump’s recent tariff announcements are expected to further amplify market turbulence, potentially triggering sharp price fluctuations and whipsaws.
M15 Chart:
The bear market is over? Short at high and long at low📰 Impact of news:
1. The interest rate remains unchanged and leads to new lows in the short term
2. Geopolitical tensions provide support for risk aversion
📈 Market analysis:
Due to the early closing yesterday, the volatility of the US market was limited and the market seemed relatively flat. From a technical perspective and the current trend, 3340 is a key defensive support level. If it retreats to this level, you can consider going long. If the gold price continues to rise and reaches 3375, from the perspective of trading strategy, you can choose to place a short order here. Focus on the resistance line of 3370-3375 during the day, and pay attention to the support of 3345-3335 below.
🏅 Trading strategies:
SELL 3370-3375
TP 3360-3355-3345
BUY 3345-3335
TP 3360-3370
If you agree with this view, or have a better idea, please leave a message in the comment area. I look forward to hearing different voices.
OANDA:XAUUSD FX:XAUUSD FOREXCOM:XAUUSD FXOPEN:XAUUSD TVC:GOLD

Choppy Gold Action Hides a Bigger Drop on Weekly Chart?After Monday’s correction, Gold continued lower – but the drop has been extremely choppy, making swing trading nearly impossible in this environment.
🔄 Short-term vs. Weekly Picture
On the 1H chart, price action is messy and directionless. However, the weekly chart tells a clearer story – which is not bullish at this moment.
❗ Let’s not rush into the “new ATH” narrative
Last week, I pointed out around the 3360 zone that we may get a rise above 3400. That move happened – but it seems more driven by Middle East tensions than by any structural strength in Gold itself.
📉 Why I’m leaning bearish on higher timeframes at this moment:
• This week’s price action almost fully negates last week’s strong green candle
• A close near the bottom of the range could form a Dark Cloud Cover pattern – a strong bearish signal
• Unless we see a reversal above 3400, downside remains the higher probability
📌 Next Target?
If the weekly close confirms this bearish setup, a drop to 3150 is not only possible – it’s becoming likely.
Disclosure: I am part of TradeNation's Influencer program and receive a monthly fee for using their TradingView charts in my analyses and educational articles.

GOLD H1 Intraday Chart Update For 20 JUNE 25Hello Traders we are now at closing day of the week, for today market expected is in tight range and better to wait for closing of the week
strong resistance for the day is 3382 level while strong support for the day is 3333
scalping range for today is 3340-3375
Disclaimer: Forex is Risky

Gold Broke Out – Another Drop Loading?OANDA:XAUUSD TVC:GOLD Gold is attempting a rebound but faces strong resistance near $3,364–$3,368, where previous support converges with the descending trendline (TL1). A clear rejection here could resume the bearish momentum.
Technically, the price is hovering just below the TL1 resistance. The zone around $3,368 is critical — if bulls fail to reclaim this area, we could see a move back toward the $3,326 support, with a deeper target near weekly support at $3,310.
📉 A rejection around current levels = high probability drop
📈 Break and hold above TL1 = potential short-term reversal
🧠 Macro Check:
Despite intensifying Middle East tensions (Israel-Iran conflict escalating, Trump weighing intervention), gold remains under pressure. The Fed’s hawkish hold, persistent inflation, and a strong dollar continue to weigh on bullion in the near term.
🔍 Key Levels:
Resistance: $3,364–$3,368 (structure + TL1)
Support: $3,326 / $3,310
Bias: Bearish below $3,368
Setup Idea: Watch for rejection near resistance for short setups toward $3,326 and $3,310

Gold Pullback in Uptrend Amid Middle East Tensions: Buy the Dip?📊 Clearly visible on the chart: current pullback within an uptrend.
🔍 News paradox: Despite escalating Middle East tensions 🌍, gold is trending lower—a key reason to emphasize buying the dip recently (watch out for bear trap scenarios 🚫📉).
💡 Trading logic breakdown:
Fed statement yesterday caused minimal volatility (market expectations priced in 💨);
This week’s pattern: Asian session rallies 📈 followed by post-Asian pullbacks 📉;
Entry strategy: Use Asian session highs as resistance reference for entries 🎯.
Technical reinforcement:
Risk alert: Geopolitical bullishness ignored → classic bear trap signal (bear trap 🚫);
Timing: Asian session highs form intraday resistance 🎯—look to enter on retracement.
Chart says it all—normal pullback in an uptrend 📊. Ironically, while Middle East conflicts should be gold-positive 🌍, prices are moving lower—a textbook 'buy the panic' setup 🚀. Following this week’s playbook 📅 (Asian session highs followed by dips), focus on Asian session highs as a resistance anchor for entries
⚡️⚡️⚡️ XAUUSD ⚡️⚡️⚡️
🚀 Buy@ 3345 - 3355
🚀 TP 3370 - 3380
Accurate signals are updated every day 📈 If you encounter any problems during trading, these signals can serve as your reliable guide 🧭 Feel free to refer to them! I sincerely hope they'll be of great help to you 🌟 👇

The market is closed today. How to arrange gold in the evening?📰 Impact of news:
1. The interest rate remains unchanged and leads to new lows in the short term
2. Geopolitical tensions provide support for risk aversion
📈 Market analysis:
The market is expected to not fluctuate much today. Generally speaking, it is difficult to stand on one foot to form a short-term bottom. There should be a second wave of bottom exploration, a secondary low point, and then the bottom is explored and pulled up to break through the previous high point. Only then can the turning point be officially established and the decline end. Moreover, the 1H moving average is spreading downward. Therefore, in the short term, we still pay attention to the 3375-3385 line of resistance and the 3360-3355 line of support below.
🏅 Trading strategies:
SELL 3375-3385
TP 3365-3360-3355
BUY 3360-3355
TP 3370-3380-3405-3420
If you agree with this view, or have a better idea, please leave a message in the comment area. I look forward to hearing different voices.
TVC:GOLD FXOPEN:XAUUSD FOREXCOM:XAUUSD FX:XAUUSD OANDA:XAUUSD

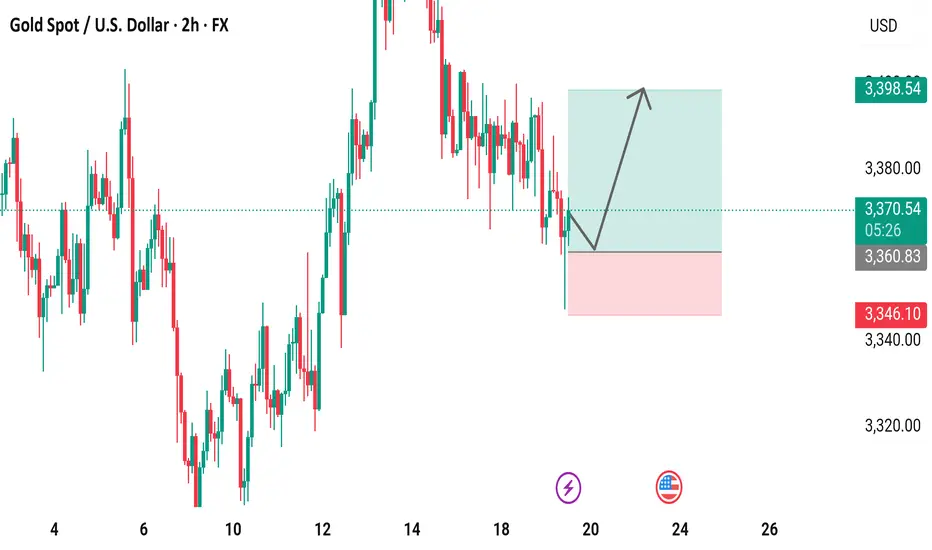
XAU/USD 2-Hour Chart Analysis: Bullish Breakout in Progress2-hour candlestick chart of the Gold Spot/U.S. Dollar (XAU/USD) currency pair, displayed on TradingView, a popular trading platform. The chart tracks price movements over a period from the 4th to the 26th, with each candlestick representing a 2-hour interval. The price levels, shown on the y-axis, range from 3,320.00 to 3,398.54 USD, while the x-axis marks the corresponding dates. The current price is 3,370.55 USD, up by 1.61 points (+0.05%), highlighted in green to indicate a positive change. Green candlesticks represent bullish (upward) price movements, while red ones indicate bearish (downward) trends, offering a clear view of market dynamics.