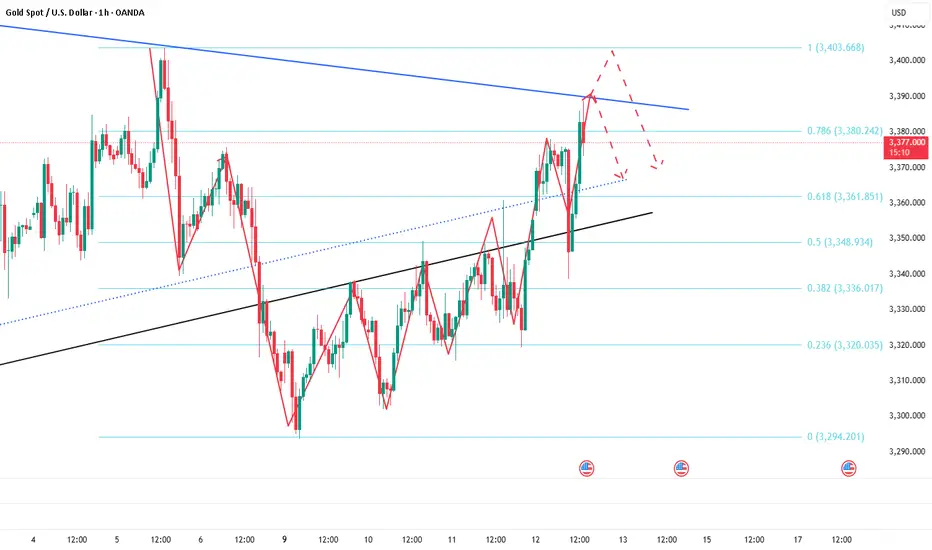
#XAUUSD[GOLD]: Massive Boost For Buyers, Incoming More Volume! Gold has been moving as expected in our previous chart. We anticipate a smooth bull market in the coming days, with a target price region of 3400$. There are three specific targets you can aim for.
If you’d like to contribute, here are a few ways you can help us:
- Like our ideas
- Comment on our ideas
- Share our ideas
Team Setupsfx_🚀❤️
Xauusdupdates

#XAUUSD[GOLD]:At Critical Level, Bullish Swing Is Very LikelyHey There Everyone,
So, gold prices took a bit of a dip, hitting 3250 gold. But guess what? They bounced back like a rubber ball and reached 3332! And here’s the exciting part: they broke through that pesky bearish trend line. This means they’re probably going to retest that line to confirm the trend.
Right now, it looks like they’re at a potential retest point, and that’s where things could get really interesting. If strong bullish volume comes in, the price could skyrocket! There are three possible targets here: 3332, 3362, and 3420.
Now, here’s something important to keep in mind: next week, there are some big news and events coming up that could totally shake things up in the gold market. And let’s not forget about price manipulation. If someone tries to mess with the price, it could drop back to 3250 and then reverse course. So, it’s crucial to have backup plans in case of any unexpected twists.
The US dollar is also going to be all over the place due to upcoming news, which could disrupt the gold market and other currencies. So, it’s best to trade cautiously today and next week. The price can be a bit unpredictable, so take your time to do your own analysis and assess your risk before making any moves.
Good luck and trade safely! We wish you all the best in your trading journey!
Cheers,
Team Setupsfx_

XAUUSD: Still Bullish with improved entry zones! Gold experienced a sudden drop today, falling to 3335 after briefly reaching 3391. This unexpected decline was not anticipated given the bullish price momentum. However, it has provided clarity for buyers, particularly swing traders. The price could drop to 3340 once more before reversing and hitting our first target, followed by a second target later.
Another possible scenario arises if the price continues to drop further. In this case, the second entry scenario becomes more secure, as Asian session volatility could cause the price to go sideways.
Please use accurate risk management and consider liking and commenting on this idea.
Good luck and trade safely.
Team Setupsfx_

XAUUSD:06/06/2025 Update! Gold experienced a decline to 3314 following the release of unexpectedly strong NFP data. However, this decline is unlikely to lead to further price drops below 3314. This is primarily due to the ongoing turmoil within the president’s own political party, which is only just beginning to unfold and will likely intensify in the coming weeks.
Before making any trading decisions, it is advisable to conduct your own analysis. Additionally, the current price action has established an AB=CD pattern, where the price has successfully reversed from point ‘d’. This pattern suggests that waiting for the price to break out could be a prudent strategy for a safe entry.
Three targets have been reasonably set, with the potential to reach target two. However, the target three remains uncertain. The total potential profit from this idea is approximately 1300 pips.
It is also important to monitor the DXY closely. We recommend waiting for the price to complete its bullish correction before taking an entry on gold.
We sincerely hope that this analysis proves beneficial. Please consider liking, commenting, and sharing this post to encourage us to provide more such insights.
Best regards,
Team Setupsfx_

XAUUSD: Another Important Update On Gold Prices! We recently posted an idea analysis on Gold, but our first entry was invalidated due to the heavy sell-off. We expect a smooth move from the current price point. However, please remember that the market conditions will remain volatile and uncertain due to important economic data being published tomorrow.
Good luck, trade safely!
Team Setupsfx_

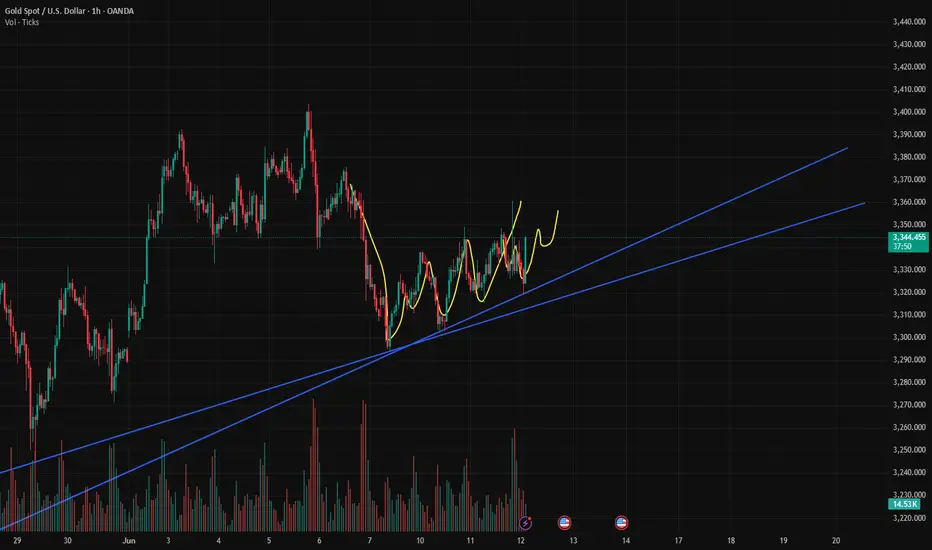
#XAUUSD[GOLD]:+2200 Pips Big Move! | Setupsfx_|Gold is currently accumulating in smaller timeframes, which suggests it’s in the early stages of a significant move. It’s possible that the price will reverse from either of the entry zones. There are three take-profit areas you can target, but only if they align with your view. This is an educational post, so please don’t blindly follow it – do your own analysis.
Like and comment for more!
Team Setupsfx_

Gold trading strategy june 13Yesterday's D1 candle was bullish, confirming the continuation of the uptrend. Following that uptrend, the Asian session saw a strong price increase to a high of 3443. If there is still confirmation from the h4 candle above 3397, today will still be a bullish candle with a large amplitude at the end of the day.
After reaching a monthly high, Gold is in a bearish correction at the end of the Asian session. This correction will last until it touches the support level of 3397, which is a good BUY signal.
The target for BUY signals will be 3364 and this area will have a profit-taking reaction from Buyers, causing the price to fall. Gold may touch the pre-ATH level of 3394 and there will be a reaction.
On the other hand, there is a sweep to 3376, which is considered a daily support zone and you can buy in this area.
Support: 3398- 3376
Resistance 3464-3495

Gold: Monitor Middle East Developments Over the WeekendAmid escalating tensions in the Middle East, risk-off sentiment surged,
sending gold soaring past the 3414 resistance and peaking near 3450,
before retracing and rebounding off the 3414 support zone.
⚠️ While this was a high-volume breakout, it was news-driven,
so keep in mind:
📌 If tensions ease over the weekend, a pullback on Monday is highly likely
📌 If tensions escalate, another bullish run would be expected
—
🔍 Technical Outlook:
🧭 4H chart: 9-count nearing completion — overbought signals building
🧭 2H chart: MACD showing early signs of a bearish crossover; potential divergence forming
🧭 1D chart: Breakout with volume confirms bullish trend, but risk of short-term correction remains
—
📌 Key Price Zones:
🔺 Resistance: 3468 – 3487 – 3500
🔻 Support: 3414 (critical) – 3400 – 3392
⚠️ If broken, next downside targets: 3378 – 3367
—
📈 Strategy Suggestions:
As we head into Monday:
✅ Consider selling on rallies if geopolitical tensions ease
✅ If tensions worsen, follow the momentum — but watch for reversal signs

XAUUSD(GOLD): +1874 PIPS Target| Touching $3600? Gold experienced a significant price surge, driven by the ongoing conflict between Iran and Israel. This heightened uncertainty among global investors led to a price touch of $3445. The current price is accumulating, and we anticipate a strong bullish distribution in the near future. Please prioritise accurate risk management during trading.
Good luck,
Team Setupsfx_

XAUUSD: Analysis June 13This morning, the gold market witnessed a strong price increase after receiving two important news:
- US CPI was lower than expected, causing the USD to weaken.
- Israel continued to strike Gaza, raising concerns about escalating conflict in the Middle East.
🟨Trend: Strong increase - Break resistance
✅ Potential Buy Zone: 3410 – 3405: This is the breakout zone after the news, you can wait to buy if the price retests. SL 2399
❌ Potential Sell Zone (exit block or surfing):
✅ 3450 - 3455, SL 3461: Strong resistance, old accumulation zone (according to Bar chart, Resistance is determined at 3,455). If RSI/H1 shows overbought signal, consider taking profit or short Sell.

Elliott Wave Analysis – XAUUSD Trading Plan for June 13, 2025🌀 Wave Structure Overview
As anticipated in previous plans, a strong bullish move has unfolded. Unfortunately, wave 2 within wave 3 was extremely sharp, triggering our stop loss — but that’s part of trading. Not every market movement will go perfectly as planned.
Currently, by closely observing wave 3, we can see that each bullish leg has shown similar length. This suggests a high probability of an extended wave, possibly wave 3 or wave 5.
In Elliott Wave theory, extended waves are the most difficult to predict in terms of where they will end. That’s why selling against the trend (“standing in front of the train”) is discouraged. Instead, we should rely on corrective structures to find buy opportunities in line with the main trend.
On the chart, the price is showing a 5-wave structure (i ii iii iv v) in purple. There’s also a possibility that wave iii itself is extending, forming 5 smaller waves, making a total of 9 subwaves — all with similar bullish momentum. This reinforces the potential for an extended wave in progress.
🎯 Target Zone for Wave iv Correction (Purple)
Watch levels: 3419 and 3411
This is the ideal zone to look for buying opportunities aligned with the prevailing uptrend.
📉 Momentum Analysis
- Daily (D1): Momentum remains bullish, which supports the continuation of the upward trend — a key requirement for a sustained wave move.
- H4: Momentum is currently in the overbought zone and may remain there for a while, waiting for D1 to also reach overbought. However, this also signals a potential risk of reversal that should not be ignored.
- H1: Momentum has turned downward, which supports the idea that wave iv is forming.
✅ Trade Plan
BUY ZONE: 3415 – 3412
STOP LOSS: 3405
TAKE PROFITS:
TP1: 3428
TP2: 3444
TP3: 3480
📌 Note: Stick to trend-following trades and avoid counter-trend positions that try to "catch the top." Be patient, wait for clear confirmation signals around wave iv’s zone, and manage your risk carefully.

XAUUSD:Buy or SellRegarding the trend of XAUUSD (gold against the US dollar), it is completely in line with my expectations yesterday. The current price has reached the watershed of 3345. If it breaks through, continue to be bullish. If it does not break through. Then wait for the market to fall.
### Key analysis points
1. Confirmation of resistance breakthrough
- The importance of the 3345 level: If this position is a resistance that has been tested many times recently (such as previous highs, Fibonacci retracement levels or trend line suppression), it may trigger short-covering or new buying after the breakthrough, pushing the price further up.
- Verify the effectiveness of the breakthrough: It is necessary to observe the momentum at the time of the breakthrough (such as accompanied by a large positive line, increased trading volume) and whether the closing price can stand above 3345 to avoid false breakthroughs.
2. Upward target
- First target: If the breakthrough is established, the next resistance may look at the 3360-3380 area (previous high or extended Fibonacci level).
- Medium-term potential: If the trend reversal is confirmed, it may even challenge the 3400 psychological level.
3. Pullback risk management
- Support level: If it fails to break through 3345 or falls back after a false breakout, you need to pay attention to the support below (such as 3320-3300), which is the short-term long-short watershed.
- Stop loss reference: The stop loss of long positions can be set below 3300 to protect the safety of funds.
Trading strategy suggestions
- Aggressive strategy (breakthrough trading):
- Entry: Go long when the price breaks through 3345 and then confirms the pullback.
- Stop loss: Below 3320 (adjusted according to volatility).
- Take profit: Close orders in batches (3360, 3380).
- Conservative strategy (retracement trading):
- Wait for the pullback to the 3320-3300 support area to stabilize and then go long, stop loss 3280.
- The target is the same as the breakthrough strategy.
- Short warning:
If the 3345 resistance continues to suppress and a bearish pattern appears, consider shorting with a stop loss above 3360.
Variables to be added
1. Time frame: Is the above analysis based on the daily or 4-hour chart? Short-term trading requires a smaller cycle to confirm the signal.
2. Driving factors: Pay attention to the Fed's policy expectations, the US dollar index, the geopolitical situation, etc., which may suddenly change the technical pattern.
Summary
Whether the current rebound can continue depends on the effectiveness of the breakthrough of 3345. If successful, it can be bullish, but a strict stop loss is required.
If you need a more detailed entry point analysis or position management plan, please feel free to let me know your trading cycle and risk preference, and I will provide you with a customized strategy.

XAUUSD: Buy or sell now?Continuously update good transactions. Let members make rich profits. How to trade XAUUSD today?
Reference suggestions are as follows:
If it retreats to the range of 3318-3328, consider buying. Target 3345-3360
If it falls below 3310, chase the shorts and choose to sell. Target 3280-3265
For reference only. Do not trade independently.
If you need a more detailed entry point analysis or position management solution, please feel free to tell me your trading cycle and risk appetite, and I will provide you with a customized strategy.

XAUUSD: Buy or sell now?The price of XAUUSD has come to the position near 3345 again. The pressure at this position is very controversial. We need to observe. If this position is stable. Then we need to pay attention to the target of 3360-3385. If it is unstable, we will short and wait for the TP of 3320, which still needs to be emphasized. If you are not sure how to trade. Remember to leave us a message. We will lead you to make better and more accurate transactions, expand profits or recover losses. Do not trade independently. Create greater losses.
Remember to continue to pay attention to the core trading strategy updates of swing trading.
XAUUSD:Go long, go long
"Israel announced a strike on Iran" broke out the news, gold and crude oil in the Asian session soared. Again help us recently do long ideas, too late to explain so much, the follow-up trading ideas are still long after the pullback.
After 3403 broke through has been converted into strong support, short - term to 3415-20 to do more.
Trading Strategy:
BUY@3415-20
TP:3440-50
↓↓↓ More detailed strategies and trading will be notified here ↗↗↗
↓↓↓ Keep updated, come to "get" ↗↗↗

As conflict escalates, gold is cautiously long📰 Impact of news:
1. The geopolitical situation between Israel and Iran deteriorates
📈 Market analysis:
The worsening geopolitical situation caused a surge in gold prices. The intraday short-term support points of 3420, 3402, and 3380 will all become key support for testing bulls. If the European session is strong, 3420 cannot be lost. If it falls back and loses, it will move closer to the top and bottom conversion position of 3402. If you go long later, you must pay attention to the weakening of the upward momentum. If the European session continues to break the high of 3440, then the US session can be seen around 3468-3493. If the upward momentum in the European session weakens, we need to watch out for a short-selling counterattack and a sharp decline. The geopolitical situation is unstable. Bros must strictly control SL when trading independently.
🏅 Trading strategies:
BUY 3420-3402-3380
TP 3390-3400-3420-3460-3490
If you agree with this view, or have a better idea, please leave a message in the comment area. I look forward to hearing different voices.
OANDA:XAUUSD FX:XAUUSD FOREXCOM:XAUUSD FXOPEN:XAUUSD TVC:GOLD

gold on sell retest#XAUUSD on price reverse, possible expect price to drop below those bearish zone before buying.
Entry on sell 3421, SL 3431, TP 3399-3378.
Below 3378 holds bullish reverse, if H1 and next H1 closes long above 3433 then bullish will reach 3470.

6/13 Gold Analysis and Trading SignalsGood morning, everyone!
Gold rallied to around $3399 during yesterday’s session, accurately reaching our preset sell zone at 3385–3403. Since then, the market has started pulling back, and today’s opening shows signs of accelerated downside movement. However, there are several strong support zones below, with immediate focus on 3378–3368, and further support around 3352–3343.
📉 Technical Outlook:
The current price action suggests the potential formation of a Head and Shoulders pattern. If confirmed, this could trigger a deeper correction towards 3340–3330. A break of these levels would significantly weaken the current bullish structure and open further downside risk.
🌍 Fundamental Drivers:
Today’s inflation-related data releases may add significant volatility;
Additionally, stay alert to any developments in the Middle East geopolitical situation, which could quickly shift market sentiment toward risk-off if escalations occur.
📌 Today’s Trading Recommendations:
✅ Sell Zone: 3410–3420
✅ Buy Zone: 3338–3326
🔄 Intraday Key Reaction Levels:
3403 / 3378 / 3362 / 3355 / 3343
🔒 Recommendation: Market is at a technically sensitive zone. Consider entering positions in batches and maintain strict risk control.

Watch Out for Weekly-Level ResistanceAs news of Israel's strike on Iran’s nuclear facility continues to spread, a surge in risk-off sentiment has driven noticeable gains across safe-haven assets. The escalation of tensions in the Middle East has clearly become a key trigger for current market sentiment. Should the conflict intensify further, oil and other safe-haven assets may see continued upside; conversely, if tensions ease, the retreat of risk aversion could lead to price corrections.
From a technical perspective, gold is currently facing downward pressure from the weekly trendline. If geopolitical tensions persist, gold may potentially rally toward the 3500–3550 range. However, without stronger fundamental support, a significant correction could follow once that level is reached.
On the intraday chart, the price has now broken below the middle Bollinger Band on the 30-minute timeframe and is near lower band support around 3413. MACD and moving average alignment suggest there may still be room to test the 3396–3388 trend support zone. The 1-hour chart remains in a consolidation phase, and while a short-term rebound is possible, selling at higher levels appears to be the safer strategy for today.
As it is Friday and given the geopolitical uncertainties, the potential for weekend risk is significantly higher. It is recommended to reduce exposure before the market closes. If you choose to hold positions over the weekend, be sure to set appropriate stop-losses to mitigate unexpected developments.

GOLD Intraday Chart Update For 13 June 25Hello Traders,
First of all congratulations to all of you as 3430-40 zone GAP filled today but sad new is war scenarios resume
so advise for you is take limited risks
all eyes on 3450 Psychological level breakout, intraday expected range is 3400-3450 if markets break 3450 then it will move towards 3480
if market breaks 3400 successfully then it will move back towards 3370 or even 3355
Disclaimer: Forex is Risky

Fakeout or Takeoff? Gold Retakes 3350 Before NY Close1. Recap of Yesterday's Move
Yesterday was a volatile day for Gold. Price initially broke above the key 3340–3350 resistance zone, only to drop back below it—but intriguingly, it closed above it on the New York session. That close is the detail that changes everything.
2. Key Question: Will Gold Stay Above 3400 and Push Toward New ATHs?
Let’s split this into two scenarios:
________________________________________
🟢 Bullish Scenario – Buy the Dip?
• The short-term structure is undeniably bullish.
• The reclaim of 3340–3350 is not a fakeout, but a clean signal of strength.
• If momentum holds, we can expect price to push toward 3405 and then 3435.
• As such, the strategy remains: buy dips, targeting those key levels.
________________________________________
🟡 Long-Term Breakout? Not So Fast
• Yes, the higher lows at 3120, 3250, and 3295 suggest that the correction from 3500 may be over.
• A clean breakout and stabilization above 3400, ideally near 3430, could signal a path toward a new all-time high.
• ❗ However, volatility remains wild, and if geopolitical tensions de-escalate or trade tariffs get resolved, Gold could see a sharp drop of 1500–2000 pips, as part of a broader risk-off unwind. Peace and stability could hurt safe-haven demand.
________________________________________
📌 Trading Plan
• Short-term: Buy dips while above 3340-3350 (ideally on a re-test), aiming for 3405 and 3435.
• Long-term: Stay flexible. Wait for confirmation above 3430 before going for the ATH narrative.
________________________________________
💡 Conclusion
Technically, Gold is bullish in both the short and long term. But with global uncertainty in play, don't ignore the fundamentals. Trade the chart, but respect the world around it. 🚀
Disclosure: I am part of TradeNation's Influencer program and receive a monthly fee for using their TradingView charts in my analyses and educational articles.

ELLIOT WAVEOANDA:XAUUSD 4 HOUR
**According to the Elliott Wave theory, the ongoing pattern appears to be a double correction. Wave 3 of {Y} has been completed, and Wave 4 is currently in progress. A potential buying opportunity may arise between the levels of 3360 and 3350. **
**However, if gold breaks below the 3350 level, further downside movement is expected, with the next support zone likely between 3315 and 3297. **
**Furthermore, if gold breaks the critical level of 3250, it may extend its decline toward the 3215–3197 range.**

Short gold ,it is expected to retreatToday, we accurately seized the trading opportunity of long gold at 3350 according to the trading plan, and hit TP: 3380 in the process of rebounding. We firmly grasped the profit of 300pips in the short-term long trading. At present, gold maintains the trend of continued rise! Now I definitely do not advocate chasing gold in short-term trading. On the contrary, I will actively look for good opportunities for short-term short trading to earn profits from short-term retracement.
In the short term, the suppression area I focus on is the 3390-3395 area, because the gold trend is relatively strong during the European session, and the US session should continue. If gold cannot break through this area in the short term, gold will likely usher in a wave of retracement. I think it should not be difficult to test the 3370-3360 area downward; secondly, we must pay attention to the same suppression area as the short-term high of 3402: 3405-3415; if gold touches this area and stagflation occurs, then it may form a secondary high in the short term, thereby hitting the firmness of the bulls' confidence and ushering in a retracement.
So next, I will test the gold short trade around the two areas of 3390-3395 and 3405-3415. Relatively speaking, the profit and loss ratio is still very favorable to us! But in the process of trading, we must strictly set up protection, after all, it is a counter-trend trade in the short term!