XAUUSD Builds Higher Floors – 3350 Under Pressure1. Recap of Yesterday’s View
In yesterday’s analysis, I noted that Gold appeared to have built a strong floor around 3300, and while the 3340–3350 resistance zone was still capping the upside, the structure hinted at a potential breakout.
2. What Happened Since?
✅ Price once again rallied into resistance and was rejected.
But here’s the key shift:
🔹 This time, the drop only reached 3315, and it was quickly bought back.
🔹 A new higher base around 3320 is now visible.
🔹 Gold is already back into the resistance zone.
3. Technical Implication
This evolving structure signals bullish pressure is building.
Every dip is being bought higher than the last — a classic sign of demand stepping in.
We are now closer than ever to a confirmed breakout.
4. Trading Strategy
📌 A clear break and close above 3350 = breakout confirmed
🎯 Target: 3400 and above
📉 Until then, buying dips into 3315–3320 remains my preferred strategy.
5. Final Thoughts
The yellow metal is coiling tightly under resistance.
The higher floors are shouting one thing: buyers are in control.
Disclosure: I am part of TradeNation's Influencer program and receive a monthly fee for using their TradingView charts in my analyses and educational articles.
Xauusdupdates

Gold rebounds and repairs, is it a shock or a bull market?📰 Impact of news:
1. Geopolitical situation
2. Impact of the US dollar trend on gold
📈 Market analysis:
At the gold hourly level, after the pressure in the Asian session in the morning, it directly fell to the vicinity of 3302. The big Yin effectively lost the lower track of the descending flag consolidation channel. The original 3318 line was the confirmation of the channel counter-pressure point, which happened to be the 61.8% split resistance level at that time. At the same time, it lost the middle track. Therefore, we gave a trading idea of looking at the rebound under pressure and continuing to decline in the European session. As a result, the market directly took a V-shaped wash-up and once pulled up to the vicinity of 3342.
The European session fluctuated strongly and rose. Before and after the US session, it took advantage of the retracement to lure the short position, and there is still the possibility of a second pull-up space. Therefore, in the subsequent retracement support level, pay attention to two positions, one is 3322-3324, and the other is the 61.8% division support level of 3318. If it stabilizes, there is a high probability that there will be a second upward space, pointing to 3348. If the pressure here cannot be overcome, the bottom will continue to oscillate back and forth. At that time, it will fall back to see if a secondary low point can be formed to further stabilize the support. If it goes straight through and stands on it, 3293 may already be the short-term low.
On the whole, I still hold short orders before the effective breakthrough of 3345, but at the same time, as the gold price rebounds and moves upward, the short-term support level is temporarily expected to be 3325-3320.
🏅 Trading strategies:
SELL 3335-3345
TP 3325-3315
BUY 3325-3330
TP 3350-3360
If you agree with this view, or have a better idea, please leave a message in the comment area. I look forward to hearing different voices.
TVC:GOLD FXOPEN:XAUUSD FOREXCOM:XAUUSD FX:XAUUSD OANDA:XAUUSD

XAUUSD 200 pip FVG drop?XAUUSD Finally started to break below to the major direction of the trend. After crossing the daily high, price started to break below upon retest of the neck line of the 4H head and shoulder.
As the market has got rejected from daily resistance we see possible drop back to daily low or even test of the strong liquidity zone on the monthly support level.
Upon price action confirmation, a sell trade is high probable

6/10 Gold Analysis and Trading SignalsGood afternoon, traders!
Gold continues to move within the predefined trading range from yesterday. Both the short from 3338 and the long from 3306 turned out profitable. Currently, price action is developing into a potential double bottom, with price once again testing key resistance around 3338.
🔍 Key Technical Outlook:
If gold breaks above 3338 decisively, and can hold above 3317 on any pullback, the next bullish target area lies between 3345 / 3352–3368.
However, if price fails to break out, then focus shifts back to the 3303–3286 support zone, which may serve as a potential buy region again.
📉 4H Trend Structure:
On the 4-hour chart, price has already broken below the previous uptrend line.
For the bulls to reclaim control, gold must re-establish above 3350 and sustain momentum. Failure to do so confirms bearish dominance, with the next major support near 3257.
Any weak rebound below key resistance can be treated as a short-selling opportunity.
📊 Macro Focus:
No major economic releases today, but traders should prepare for tomorrow's CPI data, which could be a key driver for gold volatility and inflation sentiment.
📌 Today’s Trading Plan:
✅ Buy zone: 3296–3286
✅ Sell zone: 3348–3358
🔄 Pivot levels for flexible intraday trades:
3343 / 3334 / 3326 / 3318 / 3309 / 3300
Stay cautious, manage position sizes wisely, and be alert for momentum shifts as CPI draws closer.

Gold is in the Bearish DirectionHello Traders
In This Chart GOLD HOURLY Forex Forecast By FOREX PLANET
today Gold analysis 👆
🟢This Chart includes_ (GOLD market update)
🟢What is The Next Opportunity on GOLD Market
🟢how to Enter to the Valid Entry With Assurance Profit
This CHART is For Trader's that Want to Improve Their Technical Analysis Skills and Their Trading By Understanding How To Analyze The Market Using Multiple Timeframes and Understanding The Bigger Picture on the Charts

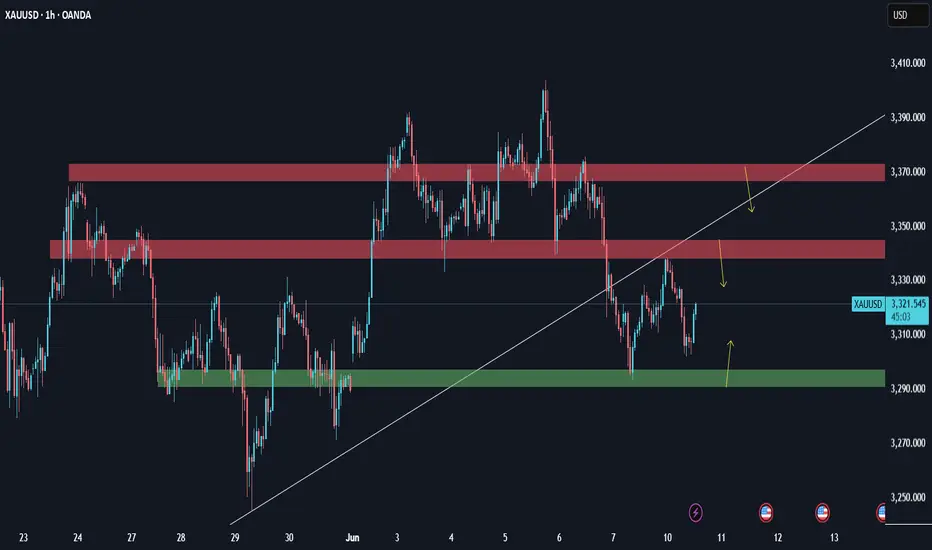
XAUUSD: Analysis June 10Gold recovered to nearly 3340 yesterday after a sharp decline at the end of last week. But gold then declined again as the market digested positive signals from the US-China trade talks. There is no important economic data released from the US today, investors continue to monitor the developments of the US-China trade talks and CPI data released on Wednesday.
After falling to test the broken down channel, gold rebounded to near 3340. It is currently declining again, but is still moving steadily above the psychological support zone of 3300. In the European session, you can buy gold again when approaching this support zone again. Or you can sell according to the two resistance zones above.
gold on bullish#XAUUSD Price still at same movement, expecting bullish to break 3345.
Await 2 times breakout at 3326 for buy, target 3345,SL 3315.
Below the 3313 have a strong bearish continuation, target 3280
Continue buying on multiple breakout above 3342

GOLD M30 Intraday Chart Update For 10 June 2025Hello Traders
Market tested 3302 level this morning and move back towards 3340 SBR structure zone
all eyes on 3340 level clear breakout once market breaks 3340 level it will move towards 3350 Psychological Level or even 3365
Key Support for the day 3300 Psychological Level
Disclaimer: Forex is Risky

Gold rises and then falls, short at 3330📰 Impact of news:
1. Geopolitical situation
2. Impact of the US dollar trend on gold
📈 Market analysis:
Gold rebounded again after falling to 3301, but the upper 3330-3340 line still has strong suppression on gold. Judging from the current trend, because the gold price has risen in the short term and returned to the 3325-3327 line, the short-term resistance is still 3330-3335 and it is expected to fall under pressure. Look for the 3315-3310 position. If it falls below this support, look down to the 3300-3290 line.
🏅 Trading strategies:
SELL 3330-3340
TP 3315-3310-3300
If you agree with this view, or have a better idea, please leave a message in the comment area. I look forward to hearing different voices.
OANDA:XAUUSD FX:XAUUSD FOREXCOM:XAUUSD FXOPEN:XAUUSD TVC:GOLD

Gold Outlook: From Resistance Rejection to Bullish Revival1. Recap of Yesterday's Expectations
In my previous analysis, I highlighted the 3340–3350 zone as key resistance and suggested that any rise into that area could give sellers a better entry.
✅ Indeed, price rallied into that zone and was rejected, validating the plan.
2. What Happened Next?
After rejecting the resistance, gold touched 3300 again, but again, the bulls stepped in:
🔹 A higher low formed compared to the previous day.
🔹 This suggests the market is now shifting its structure from down to potential up.
3. Why 3300 Looks Like the New Floor
Several bullish clues:
- The quick bounce back to 3330 shows buying power.
- Price structure is developing a series of higher lows.
- This suggests growing confidence from buyers.
4. Trading Plan
🔸 A break above 3340 would confirm bullish momentum and open the door toward 3400 again.
🔸 Any dives toward 3300 should now be viewed as potential buying opportunities.
5. Final Thoughts
The market is telling a story of bullish pressure building under 3340 and potential break back above.
Disclosure: I am part of TradeNation's Influencer program and receive a monthly fee for using their TradingView charts in my analyses and educational articles.

Elliott Wave Analysis – Trading Strategy Update | June 10, 2025
Currently, the market is presenting multiple wave scenarios with nearly equal probabilities. To avoid noise and gain clarity, we are shifting our analysis to the H4 timeframe.
🔹 Key Price Zone
As highlighted in yesterday’s update, the 3340 level remains a critical resistance. Price failed to break above this level and has since pulled back to 3307.
🔹 Momentum & Volume Profile
- H4 Momentum: Just one more H4 candle and the momentum indicator will likely enter the oversold zone, suggesting that the bearish momentum is weakening.
- Volume Profile: Price is clearly reacting at the green POC zone, with no signs of a breakdown yet.
🧩 Two Main Scenarios:
Scenario 1: Wave 5 Continues Lower
Price is potentially forming wave 5, with:
🎯 Target 1: 3290
🎯 Target 2: 3279
✅ Confirmation: Break below 3294
⚠️ Note: This is the most obvious scenario, and in trading, what’s most obvious often requires the most caution.
Scenario 2: Correction Completed – Wave 3 Uptrend Forming
- The black ABC correction has likely completed.
- The recent upward move could be wave 1; the current pullback is wave 2.
- Wave 3 is expected next.
✅ Necessary Condition: Price breaks above 3340
✅ Sufficient Condition: Price breaks the top of wave b (black)
➡️ For this scenario, limit orders may not be effective — real-time confirmation will be required.
📉 Momentum Overview:
- D1 Timeframe: Approaching oversold territory — likely to see a recovery over the next 5–7 daily candles.
- H4 Timeframe: Also nearing oversold — an intraday bounce is expected today.
🎯 Trading Plan:
🔵 Buy Zone 1:
Entry: 3292 – 3289
Stop Loss: 3282
TP1: 3306
TP2: 3340
TP3: 3375
🔵 Buy Zone 2:
Entry: 3281 – 3279
Stop Loss: 3271
TP1: 3307
TP2: 3340
TP3: 3375

Gold rebound fails to change the trend and is still bearish?📰 Impact of news:
1. The streets of Los Angeles are full of "gunpowder smell"! Immigration protests escalate, and Trump sends troops to suppress them
2. Geopolitical situation
3. Federal Reserve political expectations
📈 Market analysis:
At the hourly level: the Bollinger Band opening is narrowing, the MACD technical indicator is running in a golden cross, and the RSI fluctuates frequently in the short term. There is a certain potential for short-term promotion. If the gold price stabilizes above 3315, it may trigger a rebound and touch 3330-3340 again. If the gold price continues to be below 3300 and the short position is strengthened, it may fall to a new low. Therefore, if it rebounds again to the 3330-3340 resistance line, short positions can still be considered.
🏅 Trading strategies:
BUY 3315-3318
TP 3330-3335
SELL 3330-3340
TP 3300-3290-3280
If you agree with this view, or have a better idea, please leave a message in the comment area. I look forward to hearing different voices.
OANDA:XAUUSD FX:XAUUSD FOREXCOM:XAUUSD FXOPEN:XAUUSD TVC:GOLD

Evening gold trend analysis and operation layout📰 Impact of news:
1. The streets of Los Angeles are full of "gunpowder smell"! Immigration protests escalate, and Trump sends troops to suppress them
2. Geopolitical situation
3. Federal Reserve political expectations
📈 Market analysis:
Gold rebounded as expected and touched the 3330 line. In the short term we need to pay attention to the 3335 line. On the one hand, it is the top and bottom, and on the other hand, the annual average line is also the pressure point of the upper track of the downward channel. Once it is suppressed below 3335, it will continue to fluctuate downward. If it unexpectedly breaks through 3335 or even 3340, then 3293 is likely to become the short-term bottom.
At present, the rise has slowed down after rising to 3330, and the technical side shows a top divergence signal, so in the short term, we still maintain the idea of shorting at a high level of fluctuation.
🏅 Trading strategies:
SELL 3335-3345-3355
TP 3310-3300
If you agree with this view, or have a better idea, please leave a message in the comment area. I look forward to hearing different voices.
TVC:GOLD FXOPEN:XAUUSD FOREXCOM:XAUUSD FX:XAUUSD OANDA:XAUUSD

gold on short bullish till 3340#XAUUSD price aiming 3340 for reverse, possible 3340 price close on D1 or middle close to continue bearish.
#Gold buy at 3326 breakout, target 3340, SL 3317.
We aim at H4 price close in next 2 hours, if possible it closes below bearish 3313 then bearish is possible to continue but buy at 3323-26 will take above 3340.

Gold May Rebound After Monday Dip; Watch Tariffs & GeopoliticsGold may continue to decline before rebounding on Monday📉. The first support level is currently near 3,240-3,260. When approaching this support area, considering going long is advisable👍. It is still crucial to closely monitor the latest developments regarding U.S. tariffs and the situation in war-torn countries, as significant volatility may occur at any time⚠️. If a rebound reaches 3,350-3,360, considering going short is an option📉
⚡️⚡️⚡️ XAUUSD ⚡️⚡️⚡️
🚀 Buy@ 3250 - 3260
🚀 TP 3290 - 3310
🚀 Sell@ 3360 - 3240
🚀 TP 3310 - 3290
Accurate signals are updated every day 📈 If you encounter any problems during trading, these signals can serve as your reliable guide 🧭 Feel free to refer to them! I sincerely hope they'll be of great help to you 🌟 👇

Potential Breakdown with Retest or Reversal Zone –This chart represents a classic Double Top pattern, a bearish reversal signal indicating strong resistance around the 3,380 - 3,390 USD zone (marked with two white circles).
---
🔍 Key Zones and Levels:
1. Resistance Zone (~3,380 - 3,390 USD):
Price was rejected twice here.
Suggests strong selling pressure and buyer exhaustion.
2. Mid Support/Retest Zone (~3,337.857 USD):
Marked with a horizontal white line.
Could act as a short-term resistance if price retraces.
3. Demand Zone (~3,330 - 3,337 USD):
Highlighted green box: potential reversal/retest zone.
Bullish scenario: price bounces from here and heads back to retest resistance.
4. Current Price (~3,309.980 USD):
Price has broken below the demand zone and is approaching strong horizontal support.
5. Lower Support (~3,265 - 3,270 USD):
Highlighted with blue horizontal lines and purple arrows.
Could be the next bearish target if breakdown is confirmed.
---
🔄 Two Possible Scenarios:
📉 Bearish Continuation:
Price retests the broken demand zone (now resistance).
Rejects and forms a lower high.
Falls toward the lower support around 3,265–3,270 USD.
📈 Bullish Reversal:
Price reclaims the green demand zone.
Pushes above 3,337.857 USD level.
Heads back to retest the double top area (~3,380 USD).
---
✅ Conclusion:
The bias is currently bearish, supported by:
Double top formation.
Breakdown below key demand zone.
Momentum favoring further downside.
However, a bullish reversal is possible if price reclaims the 3,337 USD zone and shows strong bullish structure.

GOLD: Bullish Bias Holds, But Mind the Unfilled GapGold dipped below 3300 today and bounced back, though the gap near 3289 remains unfilled.
This shows buying interest is active, but also reveals that some sideline capital is still waiting for a full retest.
Combined with selling pressure on the rebound, it’s clear that bullish strength is currently limited.
—
🔍 Two Possible Scenarios from Here:
1️⃣ If support proves firm during consolidation, bulls may regain momentum and push higher
2️⃣ If support fails, price is likely to fill the 3289 gap before launching the next leg up
📌 Current Trade Outlook:
✅ Bullish trend remains intact
✅ Regardless of the short-term path, the direction is upward
✅ Watch resistance at 3331, with a key zone near 3348
—
⚠️ Note: The daily chart structure still needs further correction.
If volume remains weak after a second dip and a failed bounce follows, bears may take over again — in that case, the next downside target would be around 3258–3228
📩 Conclusion: Stay long-biased, but react flexibly to support strength and volume shifts.
XAUUSD Analysis today : Drop to monthly support?XAUUSD with NFP breakdown from significant daily support price has dropped nearly to monthly support and may continue to drop to retest the monthly support? As there is a rejection from the monthly high and the market is almost nearly to monthly gap open, it is highly likely price may retest the monthly support.
As with new monthly open, we see price has retraced to the significant intra day resistance to retest the level 3328.00
As the market started to reject back to the major direction of the trend, it is mostly probable that the price may continue to drop to this long term support level
3289.32

I am waiting for SELL here with wave 5 catching strategy In the Kitco survey, Wall Street analysts were divided on the direction of gold prices this week. Fifty percent of experts expect prices to rise, 43 percent expect prices to fall, and 7 percent believe gold will move sideways. This reflects a generally cautious sentiment as there is no clear factor to promote a new trend.
Some experts still lean towards the uptrend as gold holds important support levels and remains a safe haven amid geopolitical uncertainty. Others predict a correction in gold prices due to positive signals from the White House about the possibility of reaching trade agreements and the recovery of US stocks.
In addition, there are also neutral opinions that gold is unlikely to continue to rise sharply without further momentum, especially when stock indexes are more attractive to investors.
James Stanley, senior strategist at Forex.com, remains optimistic, saying that gold is making a technical correction to continue the larger trend. He believes that the $3,300 and $3,280 zones will be important boundaries to watch.
What do you think about this strategy?
Best regards, StarrOne !!!

6/9 Gold Analysis and Trading SignalsLast Friday, gold experienced a sharp drop, briefly testing the 3300 level. From a technical standpoint, the market has started to show early signs of bottom formation, which could materialize either as a double bottom / multiple bottom pattern, or through a direct upside breakout.
If the former unfolds, we expect a stronger and more sustainable rebound.
If it turns into a straight bullish leg, traders should be cautious of potential exhaustion in the rally, which may invite a renewed bearish attack.
📊 Key Macro Focus This Week:
Markets will be primarily influenced by data releases on Wednesday through Friday, including:
Monthly CPI
Initial Jobless Claims
Inflation Expectations
As a result, Monday's trading will be dominated by technical patterns, with a bias toward a corrective rebound. The strategic focus should be on buying near support, with short-term opportunities to sell near key resistance.
📌 Monday Trading Plan:
✅ Buy in the 3303–3286 zone (early base-building area)
✅ Sell in the 3343–3353 zone (overhead resistance)
🔄 Intraday pivot levels for tactical entries:
3338 / 3326 / 3317 / 3309

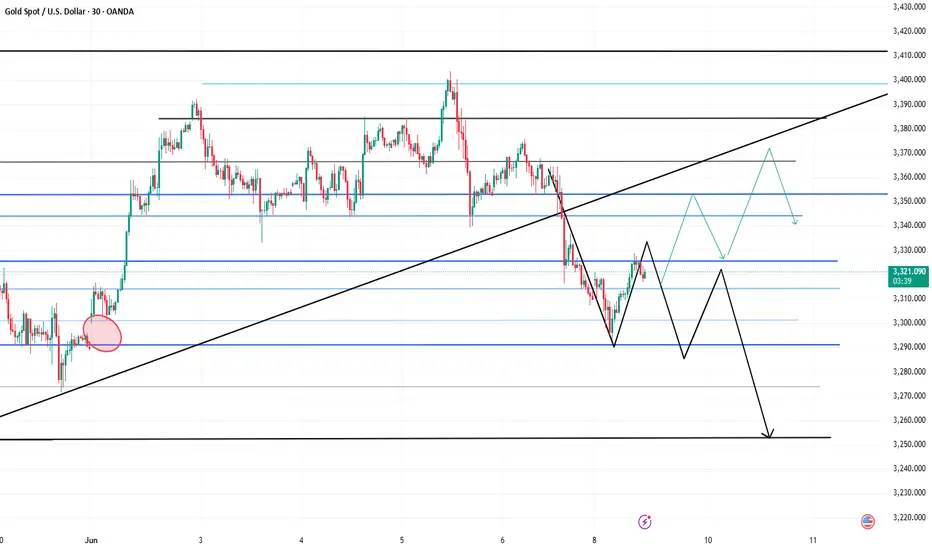
Elliott Wave Pattern – XAUUSD Trading Plan for June 8. 2025Elliott Wave Analysis
After Friday’s deep decline, price touched the level of wave 1 (black), invalidating the flat wave 4 scenario. Currently, the structure of wave 5 (black) appears to be a terminal triangle, and the sharp and steep drop afterward is consistent with post-terminal triangle behavior.
Post wave 5 completion, two possible bearish scenarios emerge:
Scenario 1: Price is forming a zigzag (abc in black). Wave c may have completed at 3305 — the first target. However, 3290 remains a significant lower target. A recovery that breaks above 3340 would help invalidate Scenario 2.
Scenario 2: Price is in a 5-wave bearish impulse. To confirm this, price must not break above 3340, as that would overlap with wave 1 and invalidate the structure. If this holds, the next key target lies below 3245.
Momentum Analysis
Daily (D1): When the market opens this week, momentum is expected to enter oversold territory — suggesting a weakening downtrend. Confirmation is needed.
H4: Momentum is already in oversold territory, indicating a potential bullish move early in the week.
H1: Also oversold. A reversal is likely during the Asian or European session, favoring Scenario 1 and a buy setup near wave c = wave a.
Trading Plan
Buy 3305 – 3302
SL: 3295
TP1: 3340
TP2: 3393
Buy 3292 – 3289
SL: 3282
TP1: 3305
TP2: 3340
TP3: 3393

Gold is vulnerable under 3340-3350 zone1. What happened last week?
As expected, Gold broke below the key 3340–3350 support zone and even slipped under 3300 during the Asian session this Monday, briefly reaching new short-term lows. The bearish pressure continues to dominate.
2. Key question now:
Is the drop over?
3. Why I expect the correction to end soon:
- The recent decline totaled nearly 1100 pips – a strong impulse move.
- Price is now undergoing a typical retracement after a steep sell-off.
- The previous support zone at 3340–3350 is now acting as resistance – a textbook role reversal.
- I expect this zone to attract sellers again.
4. My trading plan:
I remain bearish and plan to sell rallies, especially if the price shows rejection signs in the 3340–3350 area. This correction could offer an ideal re-entry for shorts at better risk/reward levels.
5. Final thoughts 🚀
The trend is still bearish. I’m waiting for the market to confirm resistance around 3340–3350 before executing my next move.

GOLD Intraday Chart Update For 9 June 2025Good Morning Traders,
As you can see that market try to fill the previous week opening gap and in that situation we may wait for a while to fill the gap and buying zone is located at 3265-3285, once market gives us a bounce back it will may move back to 3330-3340 SBR Zone
however market try to sustain above 3300 Psychological Level but keep in mind US China Tariff Deal which is due in this week
also if market sustains below 3300 psychological level successfully then it will move towards 3245-55 zone and final destination maybe 3200 Psychological
Disclaimer: Forex is Risky
