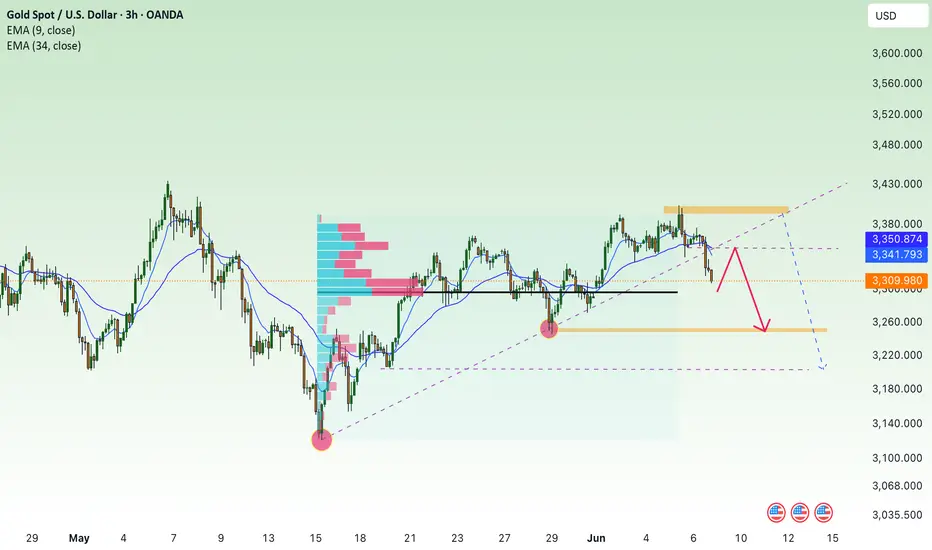
Accurately grasp the gold trend analysis next week📰 Impact of news:
1. The geopolitical situation is gradually deteriorating
2. Trump again calls on the Federal Reserve to cut interest rates
📈 Market analysis:
The current weekly moving average support for gold prices is roughly 3250-3260. If 3250-60 can be maintained, then gold may continue to maintain consolidation and wait for an opportunity to choose a trend. If it falls below 3250, then it can directly see the 3200 mark. If 3200 falls below again, then it will see 3100. In the short term, the first focus of the gold price below is 3315. As long as it stays above 3315, gold is still in a bullish trend. Secondly, pay attention to the 3280 line below. If it falls below 3280, the gold price will further test the support of 3260-3250. It is possible that gold will form a head and shoulders top structure on the daily chart next week. It may fall to 3250-60 at the beginning of the week to lure shorts into the market, and then stretch and rebound to around 3350 to form a shoulder position, and finally directly dive down to around 3150.
If you agree with this view, or have a better idea, please leave a message in the comment area. I look forward to hearing different voices.
OANDA:XAUUSD FX:XAUUSD FOREXCOM:XAUUSD FXOPEN:XAUUSD TVC:GOLD
Xauusdupdates

Breaking the big frame, gold price returns to accumulation✍️ NOVA hello everyone, Let's comment on gold price next week from 06/09/2025 - 06/13/2025
🔥 World situation:
Gold prices declined for a second straight session on Friday, yet remain on track to close the week with a gain of over 1.30%, as traders recalibrate expectations for Federal Reserve policy easing following a stronger-than-expected U.S. Nonfarm Payrolls report. At the time of writing, XAU/USD is trading at $3,322, marking a 0.84% daily decline.
The U.S. Bureau of Labor Statistics (BLS) reported that the labor market continues to show resilience, with the unemployment rate holding steady from April. Meanwhile, Wall Street staged a modest rebound from Thursday’s losses, despite political tensions flaring between President Donald Trump and Tesla CEO Elon Musk, following the House's approval of a bill to raise the U.S. debt ceiling.
🔥 Identify:
Gold prices reacted lower after the release of good May employment data. Breaking the H4 uptrend line, gold prices continued to accumulate.
🔥 Technically:
Based on the resistance and support areas of the gold price according to the H4 frame, NOVA identifies the important key areas as follows:
Resistance: $3348, $3400
Support: $3251, $3202
🔥 NOTE:
Note: Nova wishes traders to manage their capital well
- take the number of lots that match your capital
- Takeprofit equal to 4-6% of capital account
- Stoplose equal to 2-3% of capital account
- The winner is the one who sticks with the market the longest
XAUUSD: $3100 is the next target, Get Ready For the Big Move!Gold is currently making a small correction and looking at how the price is behaved. We are expecting how the price is likely to develop next. Use accurate risk management.

GOLD H4 Weekly Chart Update For 9-13 June 25Hello Trader,
As you can see that there are some crucial levels appear in the chart, right market sustain above 3300 Psychological Level if market break 3300 Psychological Level Successfully then it will might be testing 325+-60 zone
Above 3300 Psychological Level Market will move towards 3326 level or even 3345
Furthermore kindly check all mentioned zone in the chart carefully
Disclaimer: Forex is Risky

Geopolitical Undercurrents Support Gold as NFP LoomsTVC:GOLD OANDA:XAUUSD Gold hovers near $3,370 after failing to hold above $3,374, where previous support has turned into resistance. Price remains trapped between TL2 and TL3, with short-term direction hinging on tonight’s U.S. NFP data (130K jobs expected, 3.7% YoY wage growth). A strong report may trigger a drop toward the $3,342–$3,325 support zone, while weaker data could spark a bullish breakout toward $3,402.
Although Trump and Xi agreed to restart trade talks, deep fractures remain over export controls, Taiwan, and rare earth supply. These unresolved issues suggest geopolitical risk is far from over, offering medium-term support for CAPITALCOM:GOLD gold despite recent risk-on flows.
Resistance : 3,374 , 3,402
Support : 3,342 , 3,325

Gold Drop Fully Expected — Now It's Bulls?This recent decline in gold was well within our expectations. Since Monday, I’ve been highlighting the following:
The 3400 zone is a strong historical resistance, with heavy supply pressure;
A gap remains open at 3289, creating downside risk.
Today's drop is a deep flush of selling pressure near the 3400 zone.
Although the 3289 gap is still unfilled, this move may trigger dip-buying activity, giving bulls some room to work with.
📌 The first rebound resistance is likely near 3343, but because the gap is still a threat, most funds remain cautious. This could result in:
Weaker-than-expected rebounds;
Even possible bull traps followed by renewed downside.
✅ Long strategy reminders:
Keep position size moderate;
Set realistic targets;
Adjust your approach in line with market development.
Stay sharp, stay flexible — profits favor the prepared.

Analysis and layout of the latest gold trend in the evening📰 Impact of news:
1. The United States issues new sanctions on Iran
2. Trump continues to criticize the Federal Reserve
📈 Market analysis:
The 1H moving average of gold has shown signs of turning downward. If a death cross structure is formed subsequently, it will open up further downward space. From the market point of view, the price of gold rebounded to around 3364 after the release of non-agricultural data. This position constitutes a short-term key resistance level. If the rebound is under pressure here during the US trading session, short selling on rallies can still be considered. Although the price of gold has started to decline, it has not been able to fall below the important support of 3,300, so the long-term direction remains unchanged. At the same time, we need to pay attention to the effectiveness of the 3310 support line in the short term, and consider long trading only after the bottom is confirmed. For short-term trading, consider shorting at 3340-3350, and look to 3320-3310
🏅 Trading strategies:
SELL 3340-3350
TP 3320-3310
If you agree with this view, or have a better idea, please leave a message in the comment area. I look forward to hearing different voices.
TVC:GOLD FXOPEN:XAUUSD FOREXCOM:XAUUSD FX:XAUUSD OANDA:XAUUSD

Gold Is Likely to Break Below 3300 SoonYesterday, gold rallied up to near 3400 before pulling back, just as we had anticipated. We've repeatedly emphasized that 3400 is a strong resistance level, and those who followed through with short positions likely saw impressive profits.
Today, after a sharp drop, gold has rebounded again and is fluctuating near resistance. Support lies at 3352, and if that breaks, the next downside target is around 3333, followed by a possible move to fill the gap between 3300–3289.
🔍 Trading Logic:
There's still significant selling pressure above 3300, with the gap remaining unfilled.
Once the gap is filled, bulls may regain confidence to push higher — though they still face dense resistance above.
📌 Clear Profit Opportunities:
✅ Short toward the 3289 gap fill
✅ After the gap is filled, consider buying into the bullish rebound
The setup is clear — the key now is timing your entries and managing your positions wisely.

Long positions have made profits, focus on support📰 Impact of news:
1. The United States issues new sanctions on Iran
2. Trump continues to criticize the Federal Reserve
📈 Market analysis:
At present, the gold price has touched 3340. If it stabilizes here, we can arrange to go long. However, the gold price is constantly testing downwards, which is why I did not arrange to go long immediately. At the same time, we need to be vigilant about whether the gold price will fall below the important support of 3330. If it really falls below 3330, the gold price may test the support of the integer mark of 3300, which will also determine the future market trend.
🏅 Trading strategies:
SELL 3400-3370
TP 3340-3330-3300
BUY 3335-3330
TP 3350-3370
SELL 3325-3320
TP 3310-3300
If you agree with this view, or have a better idea, please leave a message in the comment area. I look forward to hearing different voices.
OANDA:XAUUSD FX:XAUUSD FOREXCOM:XAUUSD FXOPEN:XAUUSD TVC:GOLD

6/5 Gold Analysis and Trading SignalsGood morning, everyone!
Gold surged above 3380 yesterday but faced strong resistance, pulling back before testing the critical 3400 level. Despite multiple attempts, price failed to break through, highlighting a clear lack of bullish momentum near historical highs.
From a technical perspective, a potential M-top (double top) pattern is forming on the 30-minute chart. If confirmed, we can expect a deeper retracement, with an initial target around 3330, and possibly 3300 in case of further downside. Under this structure, today’s primary trading bias should favor short positions.
That said, if gold breaks above 3400 with strength, the 3416–3438 target zone becomes viable. However, any such breakout is likely to be followed by a pullback. In that scenario, we’ll closely monitor the 3392–3368 support range before executing follow-up trades.
📉 Technical Notes:
Price remains near a historical resistance zone, and buyers are showing hesitancy at these levels;
While yesterday’s Beige Book report provided short-term bullish sentiment, we need to observe whether the Asian and European sessions digest and extend that move.
🗞 Fundamental Outlook:
The key event today is the U.S. Initial Jobless Claims report, which may trigger volatility;
Gold remains supported by risk-aversion flows, but traders should be mindful of potential corrections at elevated levels.
💡 Risk Management Tip:
In such conditions, it is highly recommended to scale into positions with reduced lot size, and use tight risk controls to guard against unexpected reversals.
📌 Trading Recommendations for Today:
Sell near 3423–3436, targeting short-term pullbacks
Buy near 3312–3298, if deeper correction materializes
Pivot levels for tactical trades:
3416 / 3403 / 3392 / 3386 / 3367 / 3352 / 3343 / 3328
Strategy Summary:
Favor short setups on rallies unless 3400 is decisively broken. If support at 3362-3358 fails, expect the bearish trend to gain further momentum.

Elliott Wave Analysis – Trade Plan for June 6, 2025
🔍 Current Wave Structure
Yesterday's sharp and impulsive drop suggests a completed 5-wave structure for wave c (red) within a larger flat correction (abc red).
However, this morning's bullish move lacks momentum — candles are overlapping and price has failed to break above the 3383 level. This casts doubt on the current wave being the beginning of a new impulsive trend.
🌀 Scenario 1 – Beginning of a New Impulsive Wave
The current bullish leg may be wave 1, forming as a leading diagonal due to overlapping candles.
Projected target for wave 1: 3380. A pullback from this level could form wave 2, offering a potential long entry around 3347–3344.
⚠️ Scenario 2 – Continuation of a Larger Wave 2 Correction
If price drops back toward 3324, this would invalidate the current impulsive wave count as wave 4 would overlap wave 1 (black) → A larger corrective structure is still unfolding.
The current bounce may then be interpreted as wave a of a larger abc corrective move, suggesting a further decline to come.
🎯 Trading Strategy (Confluence of Both Scenarios)
Sell Zone: 3380–3383 → short-term selling opportunity based on potential wave 1 peak or wave b top.
Buy Zone: 3347–3344 → potential entry if wave 2 completes here (Scenario 1) or wave b ends here (Scenario 2).
📈 Momentum Outlook
Daily (D1): Momentum is fading but a confirmed bearish close today is needed. If confirmed, at least 4 more bearish daily candles may follow.
H4: Momentum is rising, suggesting more upside or sideways consolidation in the short term.
H1: Momentum is about to turn bearish. Ideally, we wait for it to dip into oversold territory and reverse upward — that would be our signal to go long.
🛒 Trade Setup
BUY ZONE: 3347 – 3344
🎯 SL: 3337
🎯 TP1: 3365
🎯 TP2: 3380
🎯 TP3: 3404 (if bullish scenario plays out)
SELL ZONE: 3383 – 3386
🎯 SL: 3393
🎯 TP1: 3365
🎯 TP2: 3347

6/6 Gold Trading StrategyAfter a short rebound, gold is now hovering near key resistance levels.
The critical zone is around 3366 – if price breaks above this, the next upside targets are 3378–3388.
However, from a broader perspective, the 4H chart still shows an uncorrected bearish setup.
Without strong buying volume, the price may drop again — potentially below 3330, or even breach the 3300 level.
—
📅 Key Data Releases Today:
🔹 NFP (Non-Farm Payrolls)
🔹 US Unemployment Rate
Both events are expected to bring high volatility, so manage your risk carefully.
—
📊 My Intraday Trade Plan:
✅ Sell on rallies
🎯 Target: around 3330-3290
📌 Only if price reaches that support zone will I consider shifting to a bullish bias

gold on buy#XAUUSD price on buy.
Below 3352 holds bearish flag, take profit 3339.94, stop loss 3361.
At 3339.94 holds bullish reverse, target 3378.
Above 3370 when H1 close on buy holds bullish breakout, TP 3390, SL 3360.

XAU/USD 06 June 2025 Intraday AnalysisH4 Analysis:
-> Swing: Bullish.
-> Internal: Bullish.
Analysis and bias remains the same as analysis dated 23 April 2025
Price has now printed a bearish CHoCH according to my analysis yesterday.
Price is now trading within an established internal range.
Intraday Expectation:
Price to trade down to either discount of internal 50% EQ, or H4 demand zone before targeting weak internal high priced at 3,500.200.
Note:
The Federal Reserve’s sustained dovish stance, coupled with ongoing geopolitical uncertainties, is likely to prolong heightened volatility in the gold market. Given this elevated risk environment, traders should exercise caution and recalibrate risk management strategies to navigate potential price fluctuations effectively.
Additionally, gold pricing remains sensitive to broader macroeconomic developments, including policy decisions under President Trump. Shifts in geopolitical strategy and economic directives could further amplify uncertainty, contributing to market repricing dynamics.
M4 Chart:
M15 Analysis:
-> Swing: Bullish.
-> Internal: Bearish.
Analysis and bias remains the same as analysis dated 22 May 2025.
In my analysis from 12 May 2025, I noted that price had yet to target the weak internal high, including on the H4 timeframe. This aligns with the ongoing corrective bearish pullback across higher timeframes, so a bearish internal Break of Structure (iBOS) was a likely outcome.
As anticipated, price targeted strong internal low, confirming a bearish iBOS.
Price has remained within the internal range for an extended period and has yet to target the weak internal low. A contributing factor could be the bullish nature of the H4 timeframe's internal range, which has reacted from a discounted level at 50% of the internal equilibrium (EQ).
Intraday Expectation:
Technically price to continue bullish, react at either premium of internal 50% EQ or M15 demand zone before targeting weak internal low priced at 3,120.765.
Alternative scenario:
Price can be seen to be reacting at discount of 50% EQ on H4 timeframe, therefore, it is a viable alternative that price could potentially print a bullish iBOS on M15 timeframe.
Note:
Gold remains highly volatile amid the Federal Reserve's continued dovish stance and persistent geopolitical uncertainties. Traders should implement robust risk management strategies and remain vigilant, as price swings may become more pronounced in this elevated volatility environment.
Additionally, President Trump’s recent tariff announcements are expected to further amplify market turbulence, potentially triggering sharp price fluctuations and whipsaws.
M15 Chart:

Long and short battle break out before NFP,gold operation layout📰 Impact of news:
1. NFP data released
2. Geopolitical situation worsens
3. Trump and Musk start a war of words
📈 Market analysis:
During today's U.S. trading session, we need to pay close attention to the impact of NFP on the market. Bros who trade independently must do a good job of risk control. The gold 1H chart shows that the current gold price is suppressed by the downward opening of the Bollinger Bands. Gold shorts dominate in the short term, and the MACD indicator has a tendency to form a death cross. At the same time, the 5-day moving average and the 10-day moving average form a death cross and move downward, indicating that the gold price is still facing adjustment pressure in the short term. Looking at the 4H chart, we can find that although gold is currently rising on the 4H trend line, gold has not yet fallen back to the right level. Therefore, we cannot rule out the possibility that gold will continue to fall back in the future. The key resistance level above is 3390-3400, and the support level below is 3350-3340, with a focus on the important support level of 3330. Participate in high-altitude and low-multiple in the European session today, and consider retreating to 3350-3340 to place longs
🏅 Trading strategies:
BUY 3350-3340
TP 3365-3385-3395
If you agree with this view, or have a better idea, please leave a message in the comment area. I look forward to hearing different voices.
TVC:GOLD FXOPEN:XAUUSD FOREXCOM:XAUUSD FX:XAUUSD OANDA:XAUUSD

Gold Analysis – Likely Scenario📍 Gold is currently trading around 3375 USD and gaining bullish momentum with the London session opening.
🔸 Key Zones:
🟨 Critical Resistance (Orange Zone):
📍 3378 – 3384✅ Price consolidation zone – if broken with strong volume, a bullish continuation is likely.
🔴 Supply Zones (FVG):
1️⃣ Upper FVG 1H:📍 3386 – 3397
2️⃣ Main Supply Zone FVG 1H:📍 3405 – 3422
🟢 Demand Zone (1H OB):
📍 3345 – 3350✅ Strong buy zone after the breakout of falling wedge structure.
🔵 Lower Demand FVGs:
3330 – 3335
3315 – 3325
3290 – 3300
3260 – 3270
✳️ Likely Scenario:
If the orange resistance zone breaks, price is likely to rally toward the 3386 – 3397 FVG, and potentially 3405 – 3422.
If price gets rejected, watch for reactions at the 3345 – 3350 OB for potential long entries.
🔍 Insight by ProfitaminFX
If this outlook aligns with your bias, or if you see it differently, feel free to share your perspective in the comments. Let’s grow together 📈
Gold Update – The Reversal Is Still in PlayYesterday’s price action confirmed what we’ve been discussing in recent updates: the upside is vulnerable, and the real move could be lower.
Gold did push toward the 3400 zone, as expected — but that test was short-lived. Sellers stepped in aggressively, and price dropped back toward the 3350 support zone, closing the day with a bearish engulfing candle on the daily chart.
Will we have a new leg down?
That’s the big question now. While bulls are hoping for continuation, the current rebound is weak and seems to be shaping into a bear flag.
Why I Expect More Downside:
- Strong rejection from 3400 key level
- Daily chart printed a bearish engulfing
- Rebound structure looks corrective, not impulsive
Trading Plan:
I continue to look for selling opportunities on spikes, especially near resistance levels like 3375–3385.
If the 3340-3350 zone falls, I expect down acceleration and a drop even to 3200 zone.
Disclosure: I am part of TradeNation's Influencer program and receive a monthly fee for using their TradingView charts in my analyses and educational articles.

GOLD Intraday M30 Chart For 6 June 25As you can see that Market still is in strong range and we are still waiting for clear breakout
NFP main event of the day and remains watchable
If Market break 3335 successfully today then it will move towards 3310
above 3345-50 market remain slightly Bullish
Disclaimer: Forex is Risky

XAUUSD – Bearish Outlook from Resistance Zone📊 XAUUSD – Bearish Outlook from Resistance Zone
🕒 Date: June 5, 2025
💰 Instrument: Gold (XAUUSD)
📍 Current Price: 3,352.730 USD
🟨 Key Resistance Level
🔴 Price has sharply reacted from the 3,375–3,400 USD zone, highlighted as a strong resistance area.
📉 This zone has previously triggered significant sell-offs, confirmed again by the current bearish rejection (red arrow 🔻).
📉 Bearish Market Structure
The price structure suggests a classic lower high rejection scenario with potential for further downside:
🔻 Immediate Drop Expected
After rejection from resistance, the price shows early signs of breakdown. A minor pullback is expected before continuation.
🧭 TP1 – First Target Zone:
📍 3,245.560 USD
This level aligns with a previous demand area (light red box), likely to act as temporary support or reaction point.
🎯 TP2 – Final Bearish Target:
📍 3,127.527 USD
This blue demand zone is a major support level, previously a strong rally base (green arrow 🟢). Expect buyers to step in here again.
🔄 Trade Idea Summary
💼 Setup Type: Resistance Rejection
🛑 Bias: Bearish
📍 Entry Zone: ~3,350–3,360 USD (confirmed rejection)
🎯 Take Profit 1: 3,245.560 USD
🎯 Take Profit 2: 3,127.527 USD
🔒 Stop Loss: Above 3,400 USD (outside resistance zone)
📌 Observations:
🔁 The market repeated its previous pattern: bouncing from the blue demand zone and rejecting at the yellow resistance zone.
🧱 A solid breakdown below TP1 could accelerate movement toward TP2.
🔍 Watch for any bullish reaction around TP2 for potential reversal setups.
📉 Bias: Bearish
📆 Outlook: Short-term to mid-term swing

Is there still hope for the bull market to rise today?📰 Impact of news:
1. Progress made in talks between China and the USA
📈 Market analysis:
In view of the non-agricultural data to be released on Friday, the market is expected to maintain a volatile consolidation trend before then. From the daily level: the Bollinger Bands open gently, the gold price is running below the upper track 3414, and the MACD golden cross is running slowly, suggesting that the bullish momentum is weak. At the hourly level, the short-term short position is strong, and there is a certain rebound demand. Therefore, we pay attention to the 3343-3333 support line below, focusing on the 3300 support. After the gold price falls below the 3360 support, the 3360 position will suppress the gold price in the short term.
🏅 Trading strategies:
BUY 3343-3333
TP 3360-3370-3380
SELL 3360-3370
TP 3330-3320
If you agree with this view, or have a better idea, please leave a message in the comment area. I look forward to hearing different voices.
OANDA:XAUUSD FX:XAUUSD FOREXCOM:XAUUSD FXOPEN:XAUUSD TVC:GOLD

Is there still a chance for a bull market in gold's decline?📰 Impact of news:
1. European Central Bank deposit facility rate in the eurozone as of June 5
2. Initial jobless claims data
3. Non-farm payroll data
4. Worsening geopolitical situation
5. Watch the impact of the dialogue between Trump and Xi Jinping on gold
📈 Market analysis:
This round of geopolitical conflict caused an upward breakthrough, but the price has cooled down due to the negotiations between China and the United States. The current market is swaying at 3374. In fact, gold has not yet taken a more obvious direction. After all, tomorrow, Friday, is a key node in the data market game. At the 4H level, today's European session has reached the 3404 line, and encountered resistance and pressure here. The current retracement is in line with our expectations, and we expect to go long. As long as the key position of the middle track is maintained, it will continue to rise after being pulled down. At present, I still hold long orders.
🏅 Trading strategies:
BUY 3390-3385-3375
TP 3400-3410
If you agree with this view, or have a better idea, please leave a message in the comment area. I look forward to hearing different voices.
TVC:GOLD FXOPEN:XAUUSD FOREXCOM:XAUUSD FX:XAUUSD OANDA:XAUUSD

Elliott Wave Analysis – XAUUSD Trading Plan 5/6/2025
🌀 Current Wave Structure
On the H1 timeframe, price action is currently overlapping — a sign that the corrective phase may not be over yet. If the correction had indeed ended at 3334, we would expect a sharper and more impulsive rally typical of wave 3 (green) within wave 3 (black). The lack of that strong momentum suggests the correction could still be unfolding.
Both wave a and wave b (red) are showing 3-wave structures, which points to the development of a Flat correction in the red abc pattern.
Within wave b (red), we’re currently seeing a smaller abc structure (green), with price likely forming wave c (green) right now.
🎯 Target Zones
Wave c (green) target zone: 3390–3393, which is our ideal Sell zone.
If price reverses from this zone, we expect wave c (red) to complete somewhere between 3334–3324.
⚡️ Momentum Outlook
D1 timeframe: Momentum is starting to turn bearish. A confirmation will depend on how today’s daily candle closes. Until then, short-term upside is still possible.
H4 timeframe: Momentum has already turned bearish, supporting the case for a potential wave C (red) to unfold.
H1 timeframe: Currently oversold, which opens the door for a minor push up or some sideways action to finish wave c (green).
📌 Trade Setup
🔻 SELL Zone:
Entry: 3390 – 3393
Stop Loss (SL): 3400
Take Profit (TP1): 3370
Take Profit (TP2): 3357
🔺 BUY Zone:
Entry: 3334 – 3331
Stop Loss (SL): 3322
Take Profit (TP1): 3357
Take Profit (TP2): 3393
Take Profit (TP3): 3410

Gold bulls are strong and clear, go long on pullbacksFrom the 4-hour analysis, the short-term support below is around 3354-62. If the daily level stabilizes at this position, the bulls will continue to fluctuate upward. Focus on the support of 3338-45. Pay attention to the suppression of 3395-3400. Keep the main tone of low-long participation around this range during the day. In the middle position, watch more and do less, be cautious and wait patiently for key points to enter the market. I will remind you of the specific operation strategy during the trading session, and pay attention to it in time.
Gold operation strategy:
1. Go long when gold falls back to 3353-3362, and cover long when it falls back to 3340-45, stop loss at 3336, and target 3395-3400;
