XAUUSD Thursday Chart Market Structure & Context
Timeframe: 15-Minute (M15)
Overall Trend: Bearish after a confirmed Break of Structure (BOS) to the downside
Current Price Action: In a retracement phase toward a premium supply zone
Bias: Expecting a liquidity sweep upward, followed by a strong sell-off
🧱 Key Structure Zones
NYL.H & NYL.L: High and Low of the previous New York session
ASIA.H & ASIA.L: High and Low of the Asia session
NYPM.H & NYPM.L: High and Low of the New York PM session
🔍 Critical Levels & POIs
Breaker Block (Dark Gray Box)
Formed after price swept buy-side liquidity and then broke structure upward
Expected to act as a support zone for a temporary buy or a reaction point
BSL POI (Buy-Side Liquidity - Point of Interest)
A manipulated breakout area targeted by smart money
Expected to entice FOMO buyers before a sharp reversal downward
Sell-Side Liquidity (SSL)
Located below the current breaker block
This is the final liquidity target for a continuation sell move
📈 Expected Price Behavior
Price is currently retracing upward
Projected Scenario:
Price moves up to tap into the BSL POI zone (around 3,303–3,305)
Price rejects the POI, forming a potential distribution range
Breakdown from the range initiates a sell-off
Targeting final support / liquidity sweep around 3,268.04
🎯 Trade Setup & Plan
Bias: Sell after a liquidity sweep above key highs
Entry Trigger: Upon clear rejection from the BSL POI zone
Stop Loss: Above BSL POI (~3,307–3,309)
Take Profit: 3,268.04, yielding a Risk-to-Reward Ratio ~4.67
⏰ Killzone Timing (SMC Timing Model)
NY AM Killzone (14:00–19:00 GMT+7)
→ Ideal for entries; likely where liquidity manipulation occurs
NY Lunch & PM
→ Potential for distribution phase completion and sell-off
📌 Additional Notes
Price action reveals a clean FVG (Fair Value Gap) and a completed BSL sweep
Final downside target aims for the NYPM Low, identified as a weak low
Rejection from the breaker block is crucial; confirmation via BOS/CHoCH on lower TF is preferred
Xauusdupdates

Gold Bulls Charging to 3305 But What’s Waiting There?Gold has recently taken support from the lower levels and has also shown a Break of Structure (BoS) to the downside. Currently, there is Imbalance and Internal Draw on Liquidity (IDM) resting around the 3305 level. The market appears to be moving upward to mitigate that imbalance. It's important to closely monitor this zone, as once the market reaches and fills this area, there is a high probability of a potential rejection or bearish move from that level

XAUUSD – 4H Short Setup AnalysisGold (XAUUSD) has broken below the dynamic support zone of the Keltner Channel structure and is currently trading beneath the 200 EMA zone, signaling bearish momentum. Price has rejected the upper resistance band near 3385, forming a lower high and triggering a short entry at the 38.2% Fibonacci retracement zone.
📉 Trade Idea (Short Bias)
Entry: Around 3360
TP1: 3317 (key support zone)
TP2: 3275 (38.2% Fib ext)
TP3: 3208 (100% extension target)
SL: 3385 (61.8% Fib retracement)
Confluences:
Price rejection from upper channel
200 EMA trend resistance
Clean bearish structure with momentum confirmation
Fib confluence adds precision to entry and target levels
If momentum sustains below 3360, further downside is likely toward the 3200 zone.

GoldXau usd daily analysis
Time frame 4 hours
Maybe Earthquake in the east of Russia 🇷🇺 makes a revolution in the markets .
I never open a short or long position in this times.
I'm waiting and watching the markets.
I think the grey lines are the reverse point
So I must wait now

Be cautious with the numerous news and short sell on rebound#XAUUSD
The market is fluctuating sideways, and whether it can achieve a V-shaped reversal still needs to wait for information such as ADP and the Federal Reserve's decision.🗞 Invest lightly today and avoid letting emotions dictate your thinking.⚖️
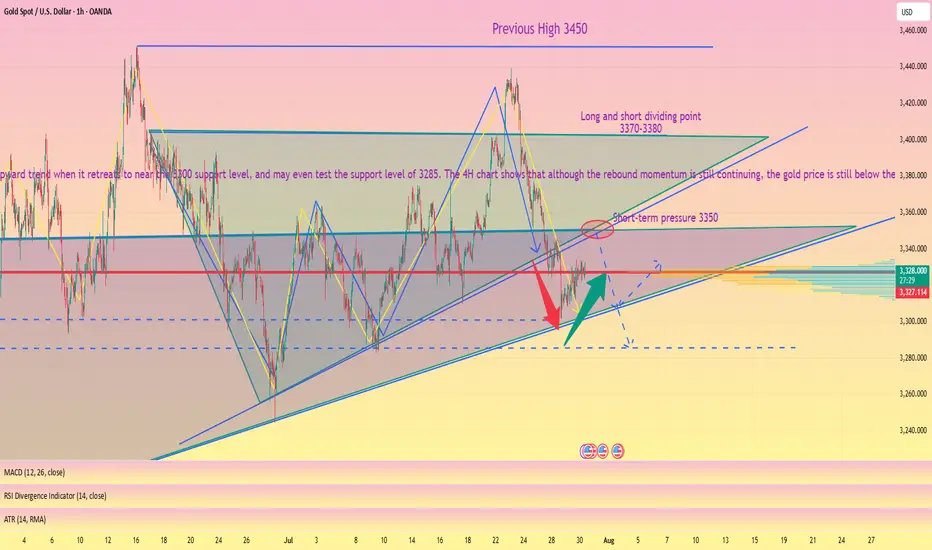
⚠️Although the market currently predicts that the news information is bullish for gold, and most of the trading voices are centered around bulls, we still need to be wary of the resistance area above 3345-3350.
📉Judging from the daily chart, I have clearly stated in the figure before that the current trend is a converging triangle. If the price hits the triangle boundary, coupled with the interference of external news, it may trigger panic selling, killing a wave of long buyers first🐂, and then trigger an upward trend when it retreats to near the 3300 support level, and may even test the support level of 3285. 🩳
The 4H chart shows that although the rebound momentum is still continuing📈, the gold price is still below the short-term moving average and has only recovered the lower support level. It is necessary to wait for a second retracement confirmation to determine whether a true trend reversal has been achieved. 📈
In addition, the price on the hourly chart continues to run in a downward channel. Combined with the previous trend pattern, after the rebound correction at the 4H level is completed, it is highly likely that the downward trend will continue to return to the lower support level of the daily level.🐻
If resistance is encountered at 3345-3350 for the first time today, consider shorting.💡
If the price currently retreats to around 3320-3315, consider a short-term long position. Long positions held yesterday can be manually closed at around 3330.💡
🚀 SELL 3340-3350
🚀 TP 3330-3320-3300
🚀 BUY 3320-3315
🚀 TP 3330-3340
GOLD – A Bottom in Place or Just the Calm Before the Storm?GOLD – A Bottom in Place or Just the Calm Before the Storm?
Gold has recently shed nearly $50, indicating sustained bearish pressure. But here’s the real question:
👉 Is this simply a liquidity sweep before a bullish reversal?
👉 Or are we witnessing the early stages of a broader bearish continuation?
Let’s break it all down – step by step – to map out smart, reaction-based trading opportunities.
🌍 Macro & Fundamental Overview
The US–EU trade and defence agreement has dampened gold’s role as a safe haven in the short term.
The US Dollar and equity markets remain strong, driven by solid macroeconomic data.
Overall market sentiment leans “risk-on”, pushing capital into riskier assets and away from precious metals.
📆 Upcoming Key Events:
Tuesday: ADP Employment Data
Friday: FOMC Statement & Nonfarm Payrolls (NFP)
These events could drastically shift market expectations around Fed policy, impacting gold’s direction.
📊 Technical Picture (Timeframes H1–H4)
Gold has rebounded from recent lows and is currently moving within a parallel bullish channel.
However, price is now nearing a critical resistance level at 3342 – a potential turning point.
🔎 Key Technical Zones:
🔺 Short-Term Resistance: 3342
🔺 Major Supply Zone: 3369–3388 (Order Block + Fair Value Gap + Fib 0.5–0.618)
🔻 High-Liquidity Support Zone: 3293–3290
🔻 Key Demand Zone (FVG): 3275–3273
🔺 High-Level Resistance: 3416
🧭 Trading Plan – Based on Price Action (Not Prediction)
We don’t guess the market. We wait, watch, and react based on price confirmation.
✅ Scenario 1 – Buy the Dip (Scalp Setup)
Entry: 3293 – 3291
Stop Loss: 3286
Targets: 3296 → 3300 → 3304 → 3308 → 3312 → 3315 → 3320 → 3330
🟢 Ideal for intraday scalps within high-liquidity zones.
✅ Scenario 2 – Buy from Deep Demand (Swing Setup)
Entry: 3275 – 3273
Stop Loss: 3269
Targets: 3280 → 3284 → 3288 → 3292 → 3300 → 3305 → 3310 → 3320 → 3330
🟢 Great opportunity if price absorbs selling pressure at the FVG zone and reverses.
❌ Scenario 3 – Short from Key Resistance (3342)
Entry: 3340 – 3342
Stop Loss: 3346
Targets: 3335 → 3330 → 3325 → 3320 → 3310
🔴 Use if price fails to break and hold above 3342.
❌ Scenario 4 – Short from Major Supply Zone (Swing)
Entry: 3369 – 3372
Stop Loss: 3376
Targets: 3365 → 3360 → 3355 → 3350 → 3345 → 3340 → 3330 → 3320
🔴 Higher-risk setup; enter only on strong rejection or bearish candlestick confirmation.
⚠️ Risk Management Guidelines
Avoid entries during the London and NY open – fakeouts and stop hunts are common.
Always wait for clear price reaction within zones – avoid impulsive entries.
Respect your stop-loss levels, especially with this week’s major data releases.
🎯 Final Thoughts for UK & Global Traders
Let the market come to you – never chase price.
Stay disciplined, especially in volatile weeks like this one.
The best trades are reactionary, not predictive.
💬 Found this plan useful?
Feel free to comment your views or follow for more structured gold analyses throughout the week.

Gold is in the Bearish Direction after Breaking SupportHello Traders
In This Chart GOLD HOURLY Forex Forecast By FOREX PLANET
today Gold analysis 👆
🟢This Chart includes_ (GOLD market update)
🟢What is The Next Opportunity on GOLD Market
🟢how to Enter to the Valid Entry With Assurance Profit
This CHART is For Trader's that Want to Improve Their Technical Analysis Skills and Their Trading By Understanding How To Analyze The Market Using Multiple Timeframes and Understanding The Bigger Picture on the Charts

GOLD Bearish Breakout!
HI,Traders !
#GOLD is trading in a strong
Downtrend and the pair
Broke the key horizontal
Level around 3318.97 which
Reinforces our bearish
Bias and we will be
Expecting a further
Bearish move down !
Comment and subscribe to help us grow !

Elliott Wave Analysis – XAUUSD | July 30, 2025📊
🔍 Momentum Analysis
• D1 Timeframe: Momentum has started to reverse upward, but we need to wait for today’s daily candle to close for confirmation. Until then, there is still a risk of another short-term decline.
• H4 Timeframe: Momentum lines are clustering in the overbought zone, signaling a possible weakening of the current upward move. However, this signal alone is not enough to confirm that the uptrend has ended.
________________________________________
🌀 Wave Structure
• Price has reached the projected target for wave e, but there has been no strong bullish reaction. The recent candles are short-bodied and overlapping – typical of corrective structures. Also, this wave has lasted longer than previous corrective upswings, suggesting that the decline may not be over yet and the wave count needs to be reviewed.
Currently, we are facing two equally probable scenarios (50/50), but they suggest opposite outcomes:
➤ Scenario 1: Zigzag (5-3-5) Structure
• The current structure may represent only wave A of a larger zigzag.
• We are now in wave B, which tends to be complex and unpredictable, making it not ideal for wave-based trading.
• The red zones marked on the chart indicate potential target areas for wave B.
➤ Scenario 2: Completed 5-Wave Correction
• The downtrend may have completed at wave (e).
• The current upward movement could be wave 1 forming as a triangle – a potential start of a new bullish cycle.
• However, to confirm this scenario, price must hold above 3309. If it fails to do so and H4 momentum reverses downward, a new low is very likely.
________________________________________
📝 Trading Plan
Given the current market conditions, I only recommend short-term scalp trading based on the predefined support and resistance zones.
Avoid wave-based trading until the structure becomes clearer. Once clarity returns, I will provide an updated trading plan.

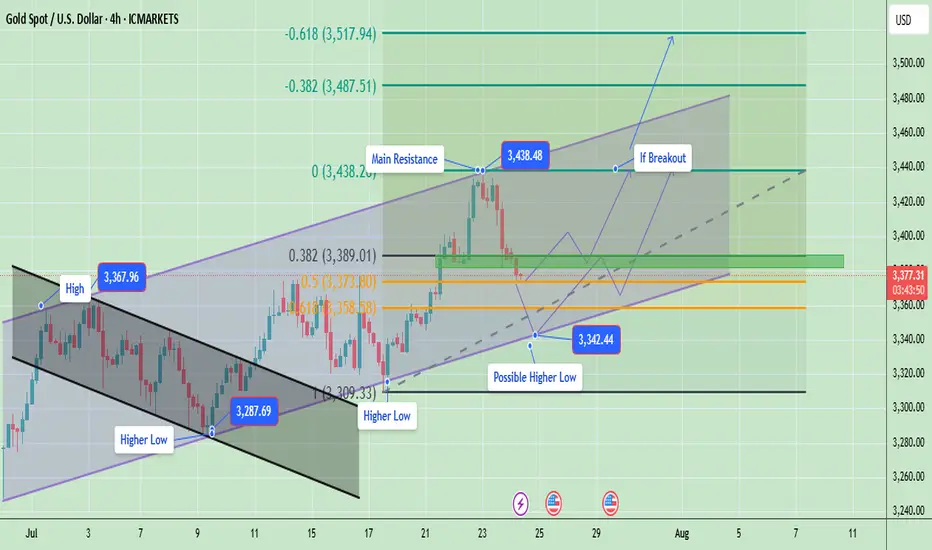
Gold Breakout or Pullback Ahead?Currently, price is in a correction phase within this rising channel after hitting the upper resistance near $3,438. The pullback is moving toward the mid and lower channel zones, which is healthy for a bullish continuation. Gold is in a healthy pullback phase inside a bigger bullish trend. If support at $3,358 – $3,373 holds, expect an upward push back to $3,438 → $3,487 → $3,517 in the coming sessions. Only a clean break below $3,309 would signal a deeper bearish move.
Gold is likely to consolidate or retest the lower channel support ($3,358 – $3,373). If buyers defend this zone, the price is expected to bounce back toward $3,400 – $3,420 and eventually retest $3,438.
Key Price Zones
- Main Resistance: $3,438 (if broken, potential rally toward $3,487 → $3,517)**
- Immediate Support: $3,373 (first reaction level)
- Major Support: $3,358 (key level to protect bullish structure)
- Potential Higher Low Zone: Around $3,342.44
Expected Price Behavior
- If gold holds above $3,373 – $3,358, it is likely to form a new higher low near $3,342 – $3,358 before attempting to push higher.
- A successful breakout above $3,438 would indicate continuation of the bullish momentum targeting $3,487 and $3,517 ).
- Failure to hold above $3,358 may open the door for a deeper correction toward $3,309, but the overall trend remains bullish unless that level is broken.
Trend Outlook
- Short-Term Trend: Consolidation / corrective pullback within a bullish channel
- Medium-Term Trend: Bullish (higher lows and breakout structure intact)
- Long-Term Trend: Bullish as long as the channel holds above $3,309
Gold is currently in a pullback phase after a strong bullish breakout. The market is likely forming a higher low and may resume upward momentum once the $3,373 – $3,358 zone is confirmed as support. A breakout above $3,438 would validate a bullish continuation toward $3,487 - $3,517.
Note
Please risk management in trading is a Key so use your money accordingly. If you like the idea then please like and boost. Thank you and Good Luck!
Scalping Sell Setup – Trendline Break & Pullback Confirmation📉 Scalping Sell Setup – Trendline Break & Pullback Confirmation
Posted earlier – trade progressing as planned.
As shared in the previous chart, a Sell scalp position was executed based on the trendline break followed by a pullback retest.
Three Take-Profit levels were marked and the price is moving in line with the forecast. ✅
🟢 TP1 Hit
🟢 TP2 Reached
🔵 TP3 in progress
📌 The setup remains valid, and as long as structure holds below the retested trendline, the bearish bias continues.
We will monitor price action near TP3 zone for final exit or trailing stop update.
> Analysis worked perfectly so far – let’s see if TP3 gets cleared soon. 🔍💥

Gold: ADP, Fed & Key Resistance Gold has been range-bound today—let’s focus on the impact of the ADP data and Fed rate decision ⚠️.
Key resistance lies around 3345-3350 📍: a breakout could fuel further upside 📈, while a rejection may trigger an oscillating pullback 📉
⚡️⚡️⚡️ XAUUSD ⚡️⚡️⚡️
🚀 Buy@ 3325
🚀 TP 3333 - 3339 -3344
Daily updates bring you precise trading signals 📊 When you hit a snag in trading, these signals stand as your trustworthy compass 🧭 Don’t hesitate to take a look—sincerely hoping they’ll be a huge help to you 🌟 👇

XAUUSD ideaWe are waiting for our asset to reach our action zone, and based on the reaction, we’ll decide on our next moves.ALWAYS WAIT FOR A CONFIRMATION TO SEE IF THE PRICE VALIDATES THE ZONE.and you what is your vision of the EURUSD its interests me! i wait you in the commentary

Gold’s Biggest Day of 2025: Collapse or New High Incoming?🟡 Gold Pre-FOMC Update | Patience Paid Off
In my previous analysis released on Monday, we highlighted the significance of the 3310 key red level on gold. I mentioned that if we got a daily candle close below this zone, it could trigger further downside.
That scenario didn’t play out — price closed above 3310, and that’s exactly why we stayed out of any short positions. No guessing, no forcing. Just patience.
On the flip side, I also said we need a daily close above 3350 to even consider going long. And as you can see, for the past two days, price has been ranging tightly between 3310 and 3330 — with relatively low trading volume across the board.
After 9 years of optimizing this strategy, one core principle remains unchanged:
🛡️ Capital protection and maximum risk control always come first.
And I can confidently say — those filters are working beautifully. I hope you’re benefiting from this approach too.
Now technically speaking, everything is lining up for a bullish DXY and bearish gold —
But tonight’s FOMC meeting and Powell vs. Trump drama will be the final trigger.
Let’s watch closely. Smart trading is patient trading. 🧠⚖️
🔁 This analysis will be updated whenever necessary.
Disclaimer:This is not financial advice. Just my personal opinion.

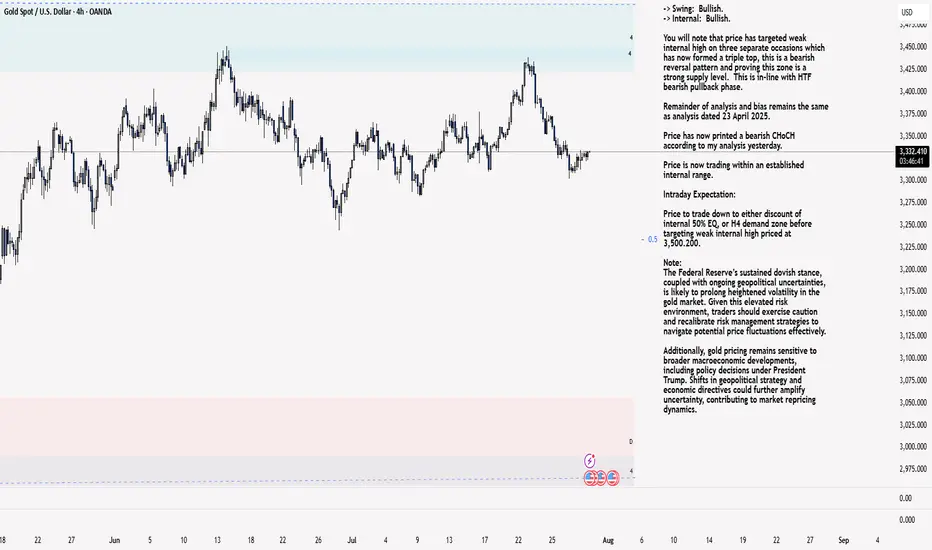
XAU/USD 30 July 2025 Intraday AnalysisH4 Analysis:
-> Swing: Bullish.
-> Internal: Bullish.
You will note that price has targeted weak internal high on three separate occasions which has now formed a triple top, this is a bearish reversal pattern and proving this zone is a strong supply level. This is in-line with HTF bearish pullback phase.
Remainder of analysis and bias remains the same as analysis dated 23 April 2025.
Price has now printed a bearish CHoCH according to my analysis yesterday.
Price is now trading within an established internal range.
Intraday Expectation:
Price to trade down to either discount of internal 50% EQ, or H4 demand zone before targeting weak internal high priced at 3,500.200.
Note:
The Federal Reserve’s sustained dovish stance, coupled with ongoing geopolitical uncertainties, is likely to prolong heightened volatility in the gold market. Given this elevated risk environment, traders should exercise caution and recalibrate risk management strategies to navigate potential price fluctuations effectively.
Additionally, gold pricing remains sensitive to broader macroeconomic developments, including policy decisions under President Trump. Shifts in geopolitical strategy and economic directives could further amplify uncertainty, contributing to market repricing dynamics.
H4: Chart:
M15 Analysis:
-> Swing: Bullish.
-> Internal: Bullish.
H4 Timeframe - Price has failed to target weak internal high, therefore, it would not be unrealistic if price printed a bearish iBOS.
The remainder of my analysis shall remain the same as analysis dated 13 June 2025, apart from target price.
As per my analysis dated 22 May 2025 whereby I mentioned price can be seen to be reacting at discount of 50% EQ on H4 timeframe, therefore, it is a viable alternative that price could potentially print a bullish iBOS on M15 timeframe despite internal structure being bearish.
Price has printed a bullish iBOS followed by a bearish CHoCH, which indicates, but does not confirm, bearish pullback phase initiation. I will however continue to monitor, with respect to depth of pullback.
Intraday Expectation:
Price to continue bearish, react at either M15 supply zone, or discount of 50% internal EQ before targeting weak internal high priced at 3,451.375.
Note:
Gold remains highly volatile amid the Federal Reserve's continued dovish stance, persistent and escalating geopolitical uncertainties. Traders should implement robust risk management strategies and remain vigilant, as price swings may become more pronounced in this elevated volatility environment.
Additionally, President Trump’s recent tariff announcements are expected to further amplify market turbulence, potentially triggering sharp price fluctuations and whipsaws.
M15 Chart:
XAU/USD Intraday Plan | Support & Resistance to WatchGold remains in a bearish structure, consolidating in a narrow range after the sharp drop earlier this week. Price is trading around 3,330, testing the 3,334 resistance zone while still below the 200MA (3,362), which may act as dynamic resistance.
As long as price stays below 3,348–3,362, the bias remains to the downside, with a break below 3,309 likely exposing the 3,289–3,267 support zone.
A clean reclaim above 3,334- 3,348 would neutralize the immediate downside pressure and open the path back toward 3,373–3,387.
📌 Key Levels to Watch
Resistance:
‣ 3,334
‣ 3,348
‣ 3,362
‣ 3,373
‣ 3,387
Support:
‣ 3,309
‣ 3,289
‣ 3,267
‣ 3,241
🔎Fundamental Focus – FOMC
The FOMC rate decision and Powell’s press conference later today will be the key driver for gold. Expect sharp volatility and potential whipsaws around the release.
⚠️ Manage risk carefully, avoid chasing initial spikes, and wait for clear direction once the event dust settles.

XAU/USD (Gold Spot vs US Dollar) Technical Analysis – 4H Char🔍 XAU/USD (Gold Spot vs US Dollar) Technical Analysis – 4H Chart
Based on my shared image from TradingView, here's a detailed analysis of the current XAU/USD market scenario:
---
🧩 Chart Type & Indicators Used
Timeframe: 4-Hour (H4)
Platform: TradingView
Indicators:
Ichimoku Cloud
Bollinger Bands (BB)
Support/Resistance zones
Trendlines
Price Action with Target Points Marked
---
📉 Current Market Structure
Price: ~$3,324 (Sell/Buy zone shown)
Overall Trend: Turning bearish in the short term.
Price Action:
Price has broken below an ascending trendline, suggesting a shift from bullish to bearish momentum.
The price is trading below the Ichimoku cloud, reinforcing a bearish bias.
Failed retest of the cloud resistance zone (around 3,335–3,340), which now acts as a resistance.
---
🔻 Bearish Signals
1. Trendline Break:
The rising trendline support (mid-July to now) is broken.
This indicates a potential reversal from the previous bullish momentum.
2. Retest & Rejection:
Price attempted to retest the breakdown zone and was rejected from the 3,335–3,340 level.
3. Ichimoku Cloud Bearish Setup:
Price is clearly below the cloud.
Future cloud is bearish (red shaded).
Chikou Span (lagging line) is below price candles and cloud.
---
🎯 Targets
First Target Point: ~3,300
This is the next horizontal support level (near recent lows).
Final Target Point: ~3,270
Stronger support zone and measured move from breakdown.
---
🛡 Resistance Zone
Immediate Resistance: 3,335–3,340
Stronger Resistance: 3,370
---
📌 Conclusion
The XAU/USD 4H chart shows a bearish breakout below the rising channel, with confirmation from Ichimoku and price rejection at cloud resistance. The market is targeting 3,300 as the first support, and if that breaks, 3,270 will likely follow.
---
✅ Strategy Suggestion (if trading):
Bias: Short/Sell
Entry: After a weak pullback or retest near 3,330–3,335
Targets:
TP1: 3,300
TP2: 3,270
Stop Loss: Above 3,345 or near 3,350 zone
Let me know if you'd like this in simpler terms or want me to track the next setup.

XAUUSD analysis - 1H FVG and OB setupsOn the 1H timeframe, price is currently approaching two key supply zones (OB 1H):
🔴 First OB zone: around 3354 – 3360
🔴 Second OB zone: around 3368 – 3370
We're watching these zones for potential short setups, only with confirmation on the lower timeframes (5M or 3M).
If price reacts to one of these OBs, we expect a move down toward the green 1H demand zone around 3280 – 3290, where a long setup may later form.
📌 Key scenarios:
1️⃣ Price hits the first OB → confirmation → short
2️⃣ Price moves to the second OB → confirmation → short
3️⃣ Target for both setups = green OB around 3280
4️⃣ No entry without confirmation from LTF
❗️ Do NOT enter without lower timeframe confirmation.
XAUUSD – Weak Rebound, Bearish Bias RemainsYesterday was a quiet and choppy day for Gold.
Although price managed to recover a small portion of last week’s 1400 pip drop, the rebound remains anemic — price barely reached the 23% Fibonacci retracement.
To make things worse for the bulls, the recovery from around $3300 is starting to take the shape of a bearish flag, a continuation pattern that typically signals further downside ahead.
📌 Resistance Zones to Watch:
- Initial resistance: $3345–3350
- Stronger resistance: $3370, a level already proven and well-defined
As long as the price is under those levels, I remain firmly bearish.
📈 Trading Plan:
I already have a short position open, and I'm still waiting to add more, preferably on a push into higher resistance, ideally above $3345.
No need to force entries — I’d rather scale in on strength, not weakness.
Once the correction is complete, I’m targeting:
- $3280 as the first support
- $3250 as a realistic downside objective
Conclusion:
The rebound lacks power. The structure favors the bears.
Still watching for better entries to add short, with eyes on 3280 and 3250 as likely targets.
Let’s stay patient and let the setup come to us. 🎯
Disclosure: I am part of TradeNation's Influencer program and receive a monthly fee for using their TradingView charts in my analyses and educational articles.

7/30: Watch for Sell Opportunities in the 3352–3363 ZoneGood morning, everyone!
After a period of consolidation and decline, gold has found preliminary support near the 3300 level, and early signs of a bottom formation are emerging. The key technical level now lies around the 3332–3337 resistance zone. Based on current price structure, a breakout is likely, with major resistance seen at 3352–3358, while 3323–3316 serves as the primary support range.
However, caution is warranted as today’s ADP employment data may significantly influence short-term price action. Whether gold can hold above the 3337–3343 level depends on the data's impact.
From a broader perspective:
On the weekly chart, the 20-period moving average (MA20) has climbed to around 3276, yet the overall structure remains bearish for bulls
On the daily chart, gold is still trading below the MA60, facing notable resistance
This week's key events — ADP (Wednesday), jobless claims, and NFP (Thursday and Friday) — will likely shape gold’s medium-term trend
Trading Strategy for Today:
Focus on the 3313–3353 trading range, and be highly responsive to data-driven volatility.
Important note: If gold rises to 3343–3358 before the ADP release, then regardless of whether the data is bullish or bearish, the preferred approach is to sell into strength, as a post-data pullback is a likely scenario.

Sell Analysis – 30M Smart Money Concept Sell Analysis – 30M Smart Money Concept
📊 Chart Context:
Timeframe: 30M
Market: Gold (XAUUSD)
Bias: Bearish – Scalp Sell
---
🔍 Key Observations:
Premium Zone Rejection:
Price tapped into a premium supply zone formed after a clear break of structure (BoS) to the downside. This confirms seller dominance at higher pricing levels.
FVG (Fair Value Gap) Fill:
The price filled a previous FVG imbalance and showed rejection without closing above the origin of the impulse. This shows liquidity grab behavior typical in smart money moves.
Bearish Order Block Confirmation:
A bearish OB was respected and reacted to. The latest candle shows strong rejection with a long upper wick and volume tapering — an early confirmation of potential entry trigger for scalp short.
---
🧨 Entry Strategy (Scalp Sell):
Entry Zone:
Inside the reaction to the OB and FVG (just below the premium zone)
✅ 3325 ~3330
Stop Loss:
Just above the last high or FVG origin
✅ 3340
Take Profit:
TP1: Towards the equilibrium of the recent impulse leg
✅ 3300
TP2: Below the discount zone, targeting liquidity under recent lows
✅ 3280
---
⚠️ Risk Note:
This is a scalping setup, not a swing trade. Higher timeframes still show mixed signals, so risk management is key. Avoid over-leveraging.
---
🏁 Summary:
> A high-probability scalp sell setup confirmed by smart money concepts: BOS → FVG Fill → OB Rejection → Liquidity Grab → Bearish Continuation.

Gold Eyes Rebound Toward $3,438 TargetGold (XAU/USD) is trading near $3,314, approaching support along the rising trend line. A potential bounce could target the $3,438 resistance area, as marked in the chart.

BTC's latest trading strategy and analysis layout#BTCUSD
BTC's current technical signals show a bull-bear tug-of-war situation.If a golden cross is formed near the zero axis, it may indicate a new wave of rise; if it falls below the zero axis, we need to be wary of a deep correction.
There are certain opportunities for both bulls and bears in the current market, but global regulatory policies have not yet been unified. Policies such as the US "GENIUS Act" may affect BTC and require continued attention. BTC is currently facing significant buying support around 117,500, but the hourly chart shows that there is still potential for a continued pullback. The current trend has not yet finished. Pay attention to the support level of 116,000 below. If it falls below, it may fall into the consolidation range of 116,000-114,000. For aggressive traders, consider going long at 117,500-116,500, with a target of 118,500-119,500. A break above this level could lead to 120,000.
🚀 117500-116500
🚀 118500-119500
