Gold 8H Bullish Reversal Setup After Channel Break. Gold/USD 8H Chart Analysis:
Price has broken below an ascending channel, indicating potential short-term weakness. However, a bullish reversal setup is marked, with a suggested buy zone near current levels (~3339), targeting the 3428–3459 USD range. Stop loss placed below 3310 for risk management.
Xauusdupdates

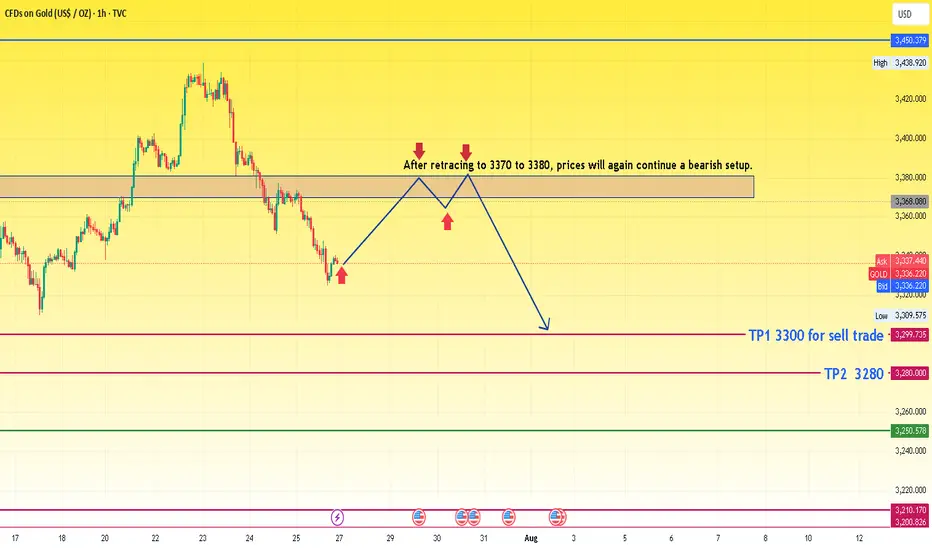
XAUUSD idea for upcoming weekThe chart presents a bearish outlook for gold based on a retracement and continuation pattern. Here's a detailed analysis:
🔍 Chart Summary:
Current Price: Around 3336
Bias: Bearish (after retracement)
Resistance Zone: 3370 – 3380
Sell Confirmation Area: Upon rejection from the 3370–3380 resistance zone
Target 1 (TP1): 3300
Target 2 (TP2): 3280
📈 Technical Structure:
Recent Trend:
The price has dropped sharply from its recent peak.
Now it's attempting a pullback to previous support, which has turned into a resistance zone (3370–3380).
Price Action Expectation:
A retracement is expected toward 3370–3380.
If the price gets rejected from this resistance block, the chart suggests the formation of a lower high.
After rejection, a bearish continuation is expected.
Projected Move:
Short entry around the resistance zone.
Targets:
TP1: 3300 (intermediate support)
TP2: 3280 (major support)
🧠 Trade Idea Logic:
The chart follows a classic bearish price action setup: impulse → retracement → continuation.
The consolidation and break area has flipped from support to resistance.
The retracement zone is clearly defined, making it a high-probability area for reversal if bearish signals (e.g., rejection candles) form.
⚠️ Key Considerations:
Wait for confirmation: Do not enter blindly at 3370–3380. Look for rejection patterns (like a bearish engulfing or pin bar).
Volume and fundamentals: Watch for economic data or geopolitical news that might invalidate the technical setup.
SL Suggestion: Above 3385 or 3390 to allow some room for wick spikes.
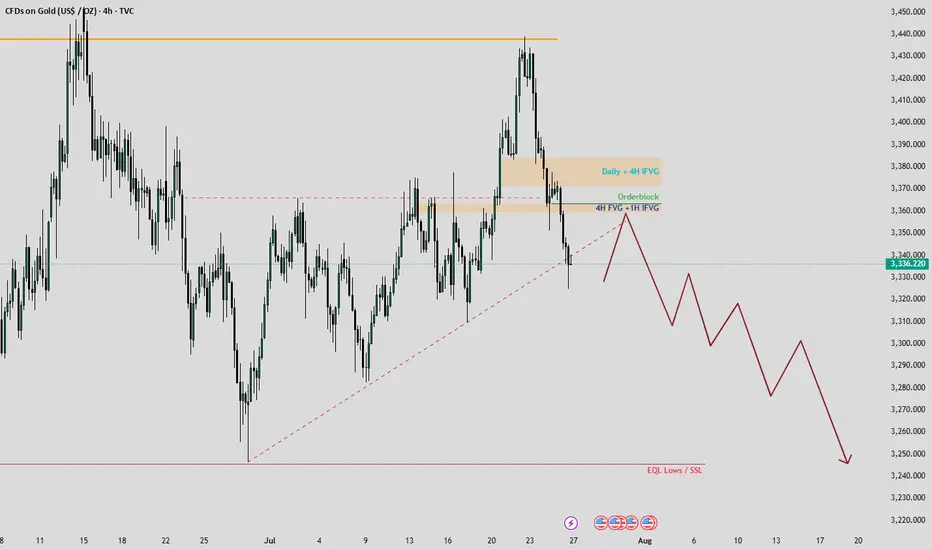
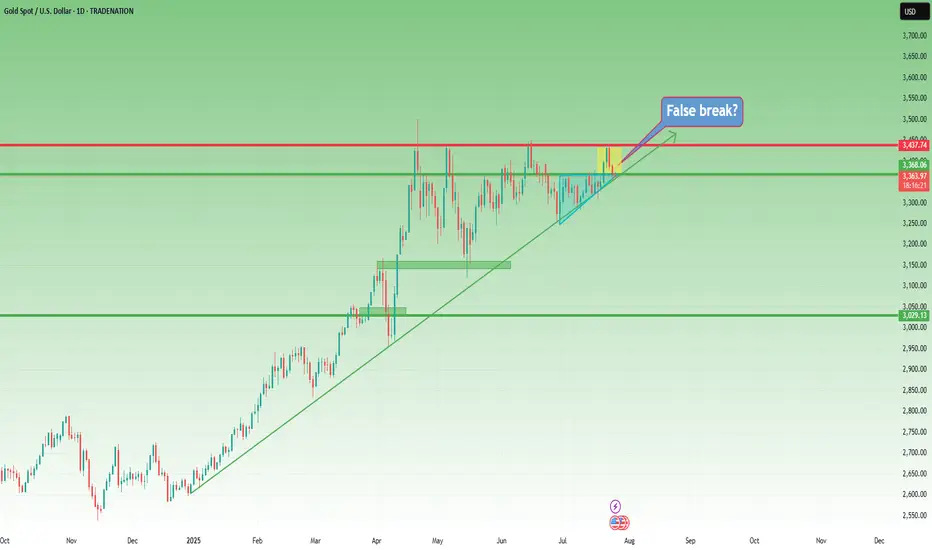
Gold Market Analysis: Seize the Bearish Opportunity!Hello, amazing traders! 📊 Last week, gold put both buyers and sellers through a rollercoaster, peaking at $3,439 on Monday and Tuesday before a sharp decline shook the market. The chart reveals a classic triangle pattern with a sneaky false breakout, designed to trap the unwary. Now, with the upside liquidity swept away, a bearish move is on the horizon—let’s break it down!
📈 Chart Insights
Take a look at the attached chart! Gold’s recent action highlights:
False Breakout: The price tricked traders with a brief surge, only to reverse sharply.
Target Zone: Equal Lows at $3,240 are the next key level to watch.
Retracements: Expect a pullback to the $3,360-$3,365 range, where order blocks, 4H Fair Value Gaps (FVG), and Hourly Imbalance Fair Value Gaps (IFVG) form a powerful demand zone.
🎯 Trading Plan
Entry Point: Prepare to short around $3,360-$3,365 as gold retraces to this strong PD Array.
Stop Loss: Place above $3,385 to avoid the daily and 4H FVG zone ($3,375-$3,385), which should act as resistance.
Target: Aim for $3,240, the Equal Lows, with updates on short-term targets to follow.
Note: The $3,375-$3,385 range is a balanced zone—unlikely to be revisited soon.
🚨 Why Act Now?
This setup offers a golden (or should I say bearish gold?) chance to capitalize on the market’s momentum. The chart’s clear levels and the false breakout signal a high-probability move. Stay tuned for real-time updates as we track this trade!
💬 Join the Conversation!
Loved this analysis? Hit the Like button to show your support! ❤️ Follow me for more actionable insights, and drop a comment below—where do you see gold heading next? Let’s build a thriving TradingView community together! 🙌
Happy trading, and may your trades be as sharp as this analysis! ✨
XAUUSD Analysis TodayHello traders, this is a complete multiple timeframe analysis of this pair. We see could find significant trading opportunities as per analysis upon price action confirmation we may take this trade. Smash the like button if you find value in this analysis and drop a comment if you have any questions or let me know which pair to cover in my next analysis

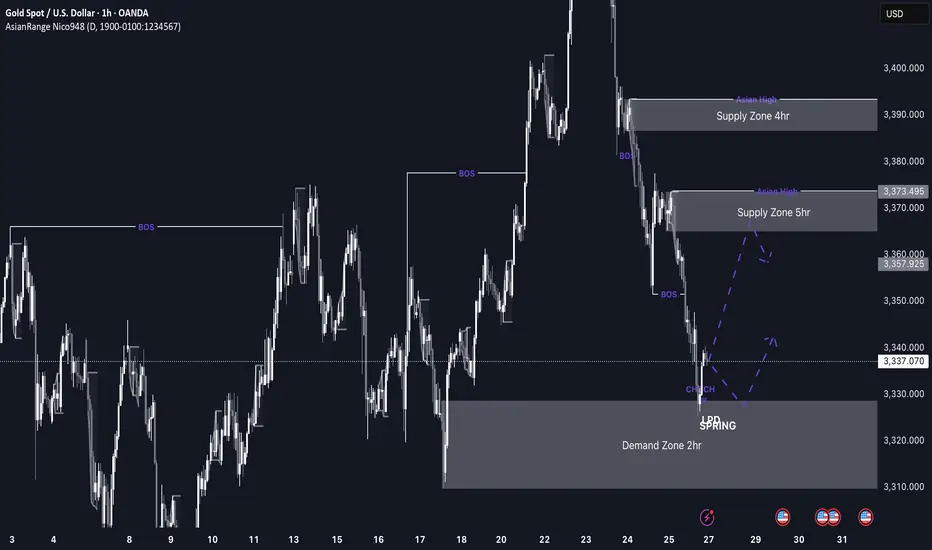
GOLD imminent possible buys up to 3,370 This week’s price action on GOLD is shaping up to be very interesting. After weeks of sustained bearish pressure, price has now entered a discounted 2hr demand zone sitting at a swing low, which makes it a high-probability area for a bullish reaction, especially as markets open.
If we do get the expected bullish reaction from this level, I’ll be watching the 3,370 region, where there’s a clean 5hr supply zone. If price reaches that level, I’ll be looking out for distribution and a potential short setup from there.
Confluences for GOLD Longs:
Price has been very bearish recently, so a retracement is expected
Currently sitting in a discounted 2hr demand zone
The overall long-term trend is still bullish
Early signs of accumulation and bullish reaction from this zone
P.S. If price fails to hold this current demand zone and breaks lower, then bearish momentum may continue. In that case, I’ll look for new long opportunities around 3,290 where a deeper demand zone exists.
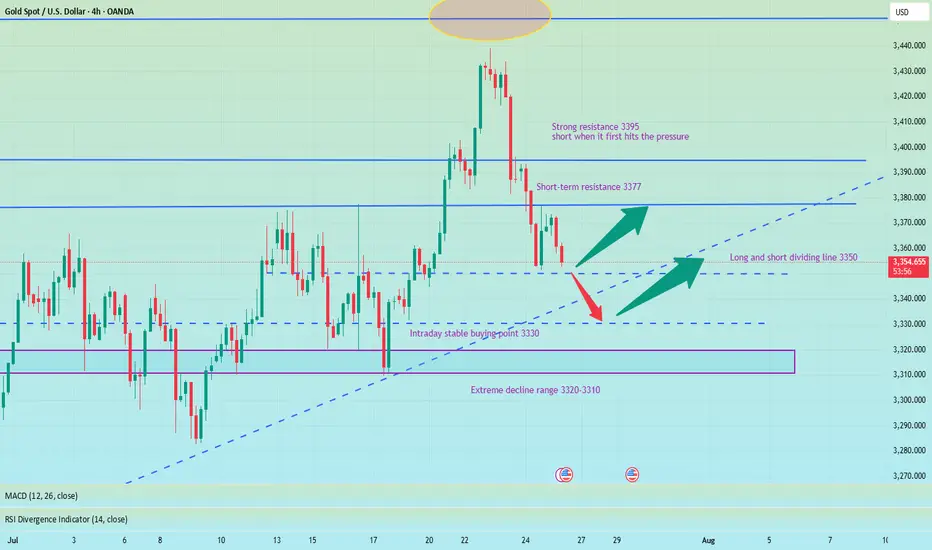
Gold may rebound.From the 4-hour analysis chart, we focus on the short-term suppression of 3370-75 on the top, and focus on the suppression of 3397-3400 on the first line. After all, gold fell and broke through here this week, and then fell southward. Below, we focus on the support of 3312-18.

GOLD gartely , XAUUSD ShortLooks like a perfect gartely pattern here on 4h frame , gold might go bearish to 3260

XAUUSD FORECASTThis is what we currently see on
GOLD.
We have 3500.103 key level as our current high zone and 3122.168 key level as our low zone. And Gold is been attempting to break 3435.00 key level resulting in selling, but been creating lower highs failing to break the created lows. Currently we a trading above the 3337.070 key level which is a critical key level, as it will determine the next coming movement.
Update will be given

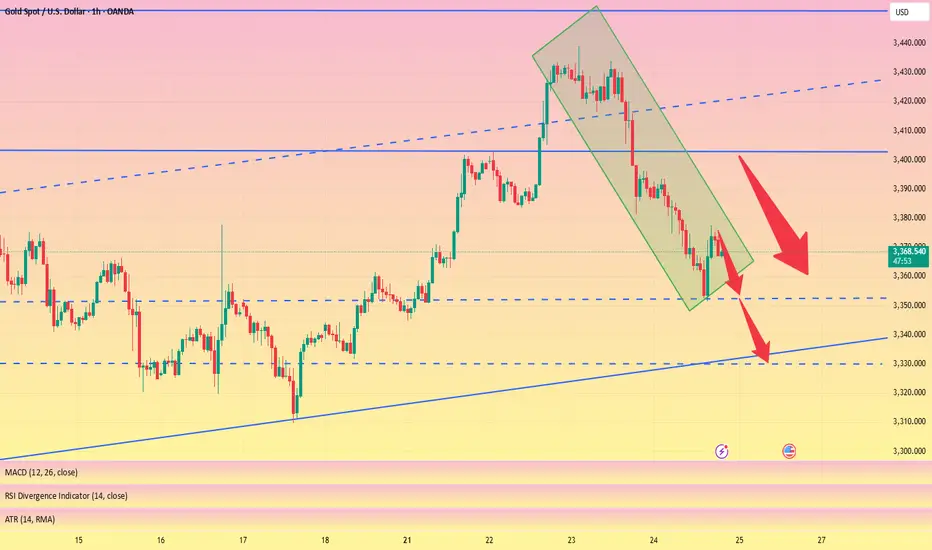
XAUUSD 4H Technical Outlook The current market structure on the 4H timeframe shows a clear sweep of a liquidity pool near the recent highs (~3,348), followed by a strong bearish reaction. Price action suggests a short-term shift in momentum toward downside targets.
🔻 Bearish Scenario
After liquidity was grabbed above the recent highs (highlighted in the orange circle), price rejected sharply. The next critical level lies at the Bullish OB (LTF) around the 3,325–3,337 zone. A break below this could lead to a deeper retracement into the Fair Value Gap (FVG) and demand zone at 3,150–3,244.
📍 Key Levels:
Resistance: 3,347 – 3,439
Support: 3,244 – 3,150 (watch for reaction in the FVG zone)
Intermediate target: 3,244.41 (Low)
🟢 Bullish Case
If price finds support at the OB and respects the ascending trendline, we could see a reversal back to re-test the upper resistance near 3,438.
📈 Bias: Bearish until price confirms support above 3,337 and reclaims liquidity zone.
🔔 Watch for:
Price reaction at OB (3,325–3,337)
Break and close below 3,244 could accelerate selling
Potential long setup from FVG with bullish confirmation

Gold - The clear top formation!🪙Gold ( TVC:GOLD ) just created a top formation:
🔎Analysis summary:
Over the past four months, Gold has overall been moving sideways. Following a previous blow-off rally of about +25%, this cycle is very similar to the 2008 bullish cycle. Bulls are starting to slow down which will most likely result in the creation of at least a short term top formation.
📝Levels to watch:
$3.000
🙏🏻#LONGTERMVISION
Philip - Swing Trader

Wait for 3330 to buy the bottom and reduce unnecessary operation#XAUUSD
We have made good profits from short selling yesterday. Currently, gold has fallen to 3350📎. The 4HMACD death cross has increased in volume and is expected to continue to decline. Consider going long near 3330📈. I don’t think it is prudent to bottom out at 3340. Move forward steadily on Friday and reduce unnecessary operations⚖️.
🚀 BUY 3335-3330
🚀 TP 3345-3362
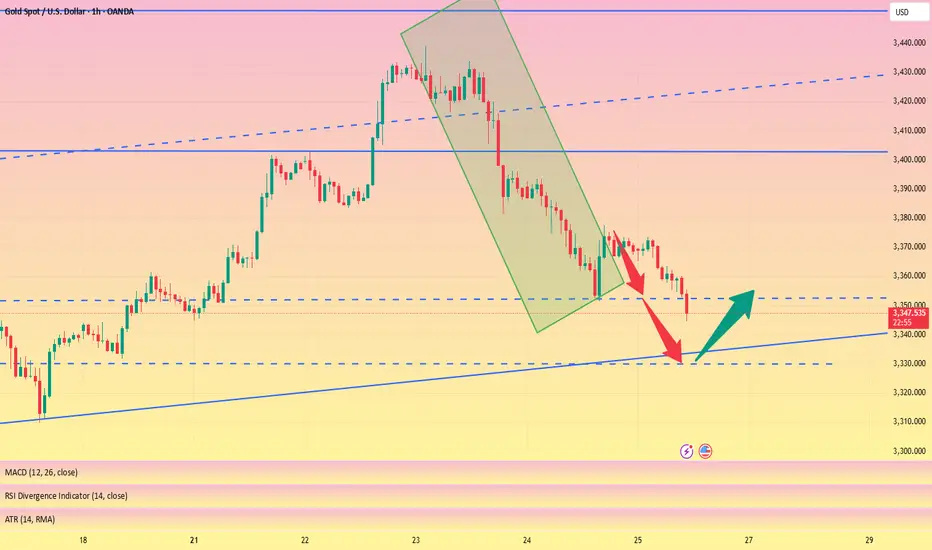
Be alert to new lows, pay attention to 3350 and go long at 3330📰 News information:
1. Tariff issues
2. Next week's NFP data
📈 Technical Analysis:
Last night, gold rebounded to only around 3377 before starting to fall back. Our judgment that the current rebound is weak is completely correct. 3350 is the support point of the bottoming out and rebounding to nearly $20 last night. Whether the European session can go down to 3350 will determine the trend of gold.
From the daily chart, the daily line has fallen for two consecutive days, suggesting that the price may continue to fall today. At present, we need to pay attention to this week's starting point of 3344-3345, and then the 3330 line below. The extreme decline is 3320-3310. At the same time, the narrowing of the daily Bollinger Bands is also paving the way for next week's NFP data.
From the 4H chart, the current MACD indicator crosses and increases in volume, and the middle track of the Bollinger Bands and SMA30 basically overlap near 3388. As for the hourly chart, the upper pressure is mainly concentrated near 3375-3377, which is also the high point of the rebound last night. If gold rebounds directly upward and encounters pressure and resistance at 3375-3385 for the first time, you can consider shorting and strictly implement stop loss.
Overall, if the current market falls to 3350-3345 for the first time and gets effective support, you can consider going long with a light position, defend 3340, and look to 3356-3362; if the decline is strong and continues to fall below 3350, the best stable long point for the day is 3330-3320, defend 3310, and earn $10-20 to leave the market.
🎯 Trading Points:
BUY 3350-3345
TP 3356-3362
BUY 3330-3320
TP 3345-3360
In addition to investment, life also includes poetry, distant places, and Allen. Facing the market is actually facing yourself, correcting your shortcomings, facing your mistakes, and exercising strict self-discipline. I share free trading strategies and analysis ideas every day for reference by brothers. I hope my analysis can help you.
TVC:GOLD PEPPERSTONE:XAUUSD FOREXCOM:XAUUSD FX:XAUUSD OANDA:XAUUSD FXOPEN:XAUUSD
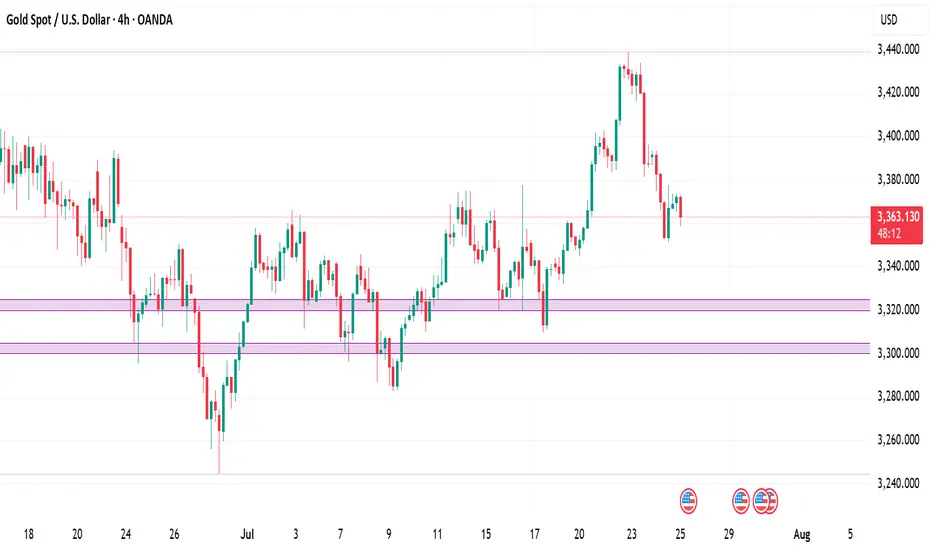
Gold Spot / U.S. Dollar (XAUUSD) - 4 Hour Chart (OANDA)4-hour chart from OANDA displays the price movement of Gold Spot (XAUUSD) from late July to early August 2025. The current price is $3,332.775, reflecting a decrease of $35.935 (-1.07%) as of 07:54 PM PKT on July 25, 2025. Key levels include a sell price of $3,332.480 and a buy price of $3,333.050. The chart shows recent volatility with a shaded support zone around $3,312.314 to $3,367.326, indicating potential price stabilization or reversal areas.

7/25: Key Levels to Watch Closely for Next Week's TradingGood evening, everyone!
Due to health reasons, I had to take a short break from updates — thank you all for your understanding and support.
This week, gold rallied to the 3440 level, forming a double-top pattern, and has since entered a phase of consolidation with a downward bias, currently retracing back to the key 3337-332 support area.
While a short-term rebound is possible from the 30-minute chart perspective, the weekly structure is not favorable to the bulls. On the daily chart, price has once again reached the MA60 support, and is currently forming three consecutive bearish candles, which suggests that bearish momentum may continue.
Unless there is significant bullish news next week, the market may remain under pressure. Key levels to monitor:
Upside resistance zones: 3343, 3352, 3358, 3366, 3372, 3378, and 3386–3392
Downside support zones: 3337, 3332, 3323, 3312
If the weekly chart breaks down, watch for: 3300 psychological level and 3260 (weekly MA20)
Additionally, during this week's decline, a price gap has been left between 3395–3398. If the market starts to rebound on the 2-hour chart, there is a chance this gap will be filled. However, this area also serves as strong resistance, and any approach toward it could result in heavy selling pressure. Caution is advised in the event of a sharp rally.
I'm still recovering and unable to monitor the markets for extended periods. Once my health improves, I’ll resume regular updates. In the meantime, feel free to leave any questions, and I’ll do my best to respond. Thanks again for your continued support, and I wish everyone success and strong profits in the market!
Gold Softens — Watching for a Tactical Long OpportunityYesterday, gold hit a low of around 3351 and then began to rebound. During the rebound, it hit a high of around 3377 and then retreated again. We can clearly see that below 3400, gold is still weak overall, and even failed to reach 3380 during the rebound. In the short term, the 3380-3390 area has become an obvious resistance area.
Yesterday, gold rebounded after dropping to around 3351. Whether the support near 3350 is effective has not been verified again, so from a technical perspective, gold still has the need to retreat again and test the support near 3350. Once gold falls below the area when testing the support near 3350, gold may continue to fall to the 3335-3325 area.
Therefore, in today's trading, the focus is still on shorting gold, supplemented by trying to go long on gold with the support.
1. Consider shorting gold in the 3380-3390 area, TP: 3365-3355;
2. Consider going long gold in the 3355-3345 area, TP: 3365-3375; strictly set SL
3. If the 3355-3345 area is broken, try to go long gold again in 3335-3325, TP: 3360-3370
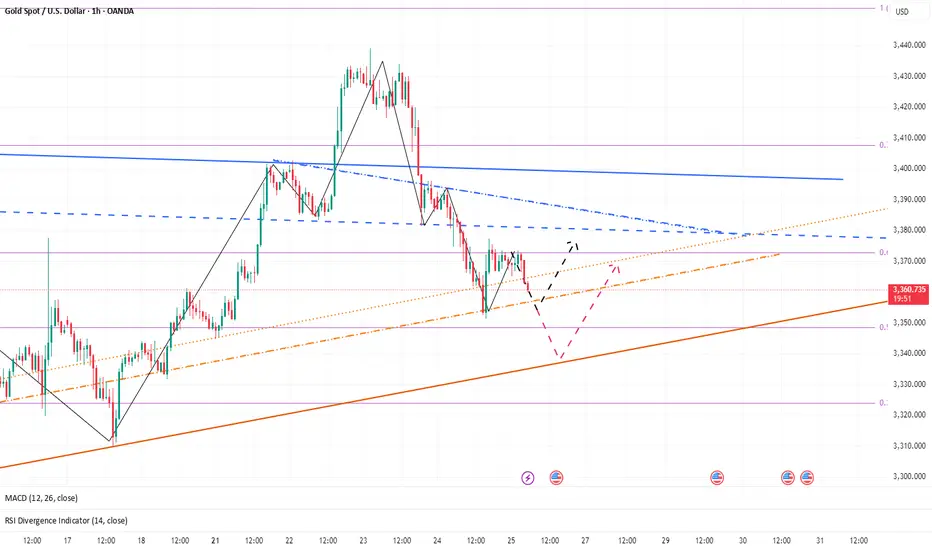
XAUUSD – The Structure Is Still Bullish... But Barely Holding 📌 In yesterday’s analysis, I mentioned that although Gold corrected deeper than expected, dropping below 3400, the bullish structure remained intact — and I stayed true to that view by buying dips.
🎯 The trade didn’t go as planned. Fortunately, the New York rebound from 3350 helped me exit at breakeven.
🧭 So now the big question is:
Is Gold reversing to the downside?
The answer: Not confirmed yet.
The structure is technically still bullish, but the chart is far from pretty.
🧨 What’s going wrong?
❌ Bearish engulfing candle on Wednesday – I chose to ignore it yesterday, but it’s still there.
❌ The breakout above 3375 (ascending triangle resistance) is failing – and could now turn into a false breakout trap.
❌ The ascending trendline from January 2025 is under pressure.
❌ And if today we close near 3350, the weekly chart will show a bearish Pin Bar – not exactly a sign of strength.
📉 My current plan:
- If price rallies back above 3380 → I’m looking to sell into strength, not buy.
- If we break below 3350 → I’ll also look to sell the breakdown.
Right now, for Gold to regain bullish momentum, it needs to reclaim 3400. No compromise.
⚠️ Summary:
Yes, the bigger structure is still bullish.
But momentum is fading, and price action is starting to turn against the bulls.
We need confirmation, not hope.
If 3350 breaks cleanly – things could accelerate to the downside.
Disclosure: I am part of TradeNation's Influencer program and receive a monthly fee for using their TradingView charts in my analyses and educational articles.
Gold at Key Support – Will Bulls Step In or Drop Continue?🌐 Market Overview
Gold has struggled to recover after yesterday's sharp drop, driven by macro-political concerns and profit-taking at recent highs.
🔻 On July 24, former President Trump made an unexpected visit to the US Federal Reserve, sparking speculation that he's pressuring the Fed to cut interest rates soon.
While the Fed has yet to make any dovish moves, short-term bond yields dipped slightly, showing growing market expectations for policy easing.
The US dollar remains strong, reflecting some skepticism around the Fed’s possible shift despite recent economic strength.
📉 Technical Outlook
On the H2 chart, gold still maintains an overall bullish structure. However, it's approaching a critical support level near 3338, which aligns with the VPOC and the ascending trendline.
📌 If this zone breaks, price may rapidly fall toward deeper liquidity zones in the 332x – 329x range.
🎯 Trade Setups
🔽 BUY SCALP (Quick Reaction Play)
Entry: 3338 – 3336
Stop Loss: 3332
Take Profit: 3342 – 3346 – 3350 – 3354 – 3360 – 3365 – 3370 – 3380
🟢 BUY ZONE (Deep Buy Area – Long-Term Potential)
Entry: 3312 – 3310
Stop Loss: 3305
Take Profit: 3316 – 3320 – 3325 – 3330 – 3340 – 3350 – 3360 – 3370 – 3380
🔻 SELL ZONE (if market retests)
Entry: 3374 – 3376
Stop Loss: 3380
Take Profit: 3370 – 3366 – 3360 – 3355 – 3350 – 3340 – 3330
🔍 Key Levels to Watch
Support: 3350 – 3338 – 3325 – 3310 – 3294
Resistance: 3374 – 3390 – 3400 – 3421
⚠️ Risk Note
As we head into the weekend, liquidity sweeps are common – especially on Fridays. Be cautious of sharp moves.
Focus mainly on scalp setups today. Avoid early long entries unless strong confirmation appears at lower liquidity zones.
Always follow your TP/SL strategy to protect your capital.

Gold in Demand Zone | Target $3,380🚨 GOLD/USD – BIG MOVE LOADING! 🚨
🔍 Price is currently reacting from a major demand zone ($3,340–$3,345) with signs of accumulation and a possible double bottom pattern forming.
📉 After a strong downtrend, this looks like a liquidity sweep and smart money trap — prepping for a reversal back to the $3,380 resistance zone where liquidity resides.
📈 Scenarios to Watch:
1️⃣ Price sweeps support again and reverses hard
2️⃣ Clean structure break above $3,365, followed by a retest
🎯 Target: $3,380–$3,385
🛡️ Invalidation: Strong close below $3,335
⚠️ Confirmation Required! Best entry would be after structural break + retest. Keep your risk tight, and let the market show its hand.
⸻
📌 Key Levels:
• Support Zone: $3,340–$3,345
• Target Zone: $3,380–$3,385
• Invalidation: Below $3,335
⸻
📣 If this setup helps you, like 👍, comment 💬, and follow 🔔 for more high-probability ideas every week!
#Gold #XAUUSD #SmartMoney #LiquidityGrab #ForexSetup #PriceAction #BreakoutTrade #DoubleBottom #TradingView #GoldAnalysis #ForYou #FXStrategy #SupplyAndDemand

Trend corrected, long funds reduced, sellers returned#XAUUSD
The current moving average is still spreading downward, and the 4-hour chart closed with a large negative line. The market has not yet given a clear feedback on the current trend. However, after a large amount of buying funds intervened, the gold price hit a high of around 3377 and then stagnated. The short-term bullish momentum has weakened, and there is a certain risk of a correction and decline. Sellers are beginning to return📉.
Currently, you can consider participating in short selling at 3370-3377💡. If it rebounds directly to 3400-3405, you can still short if it does not break🔍. The target is 3360 below, and 3350 or even 3330 if it breaks🎯.
🚀 SELL 3370-3377
🚀 TP 3360-3350
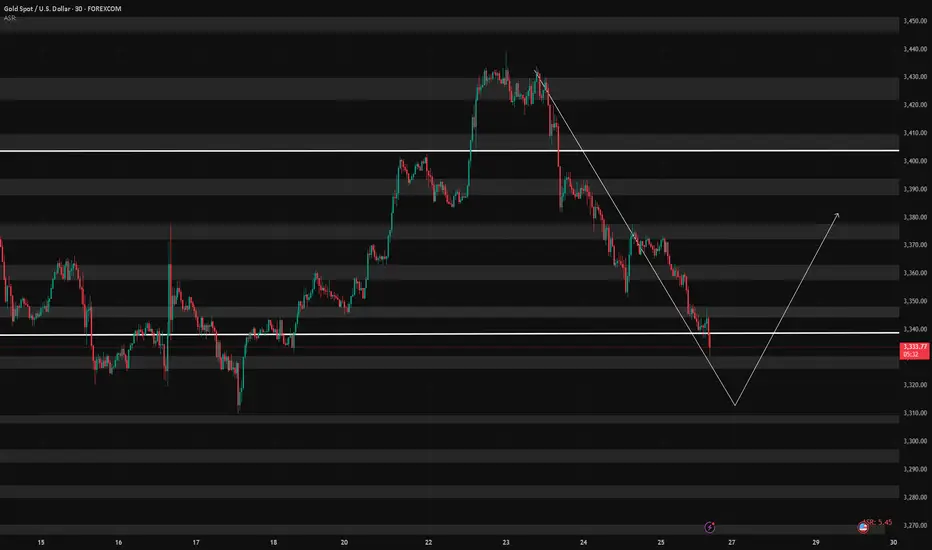
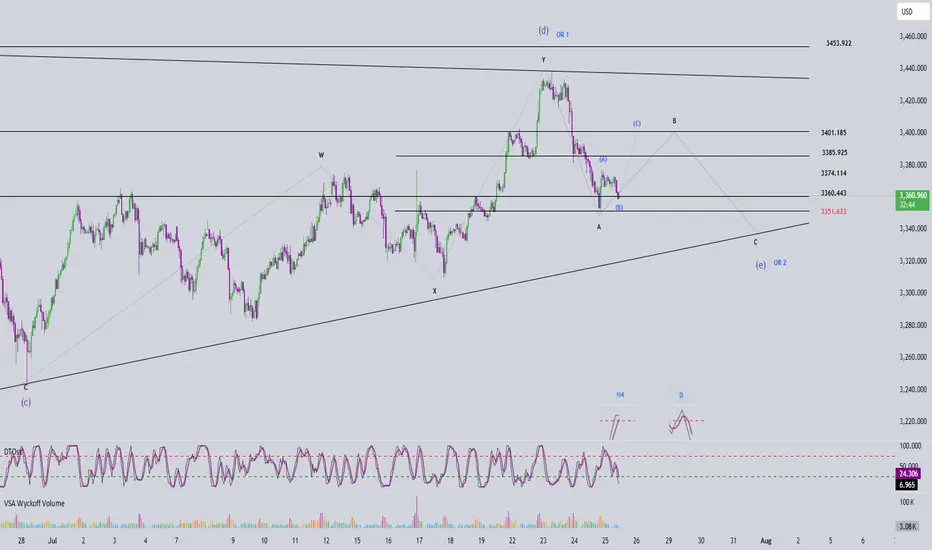
Elliott Wave Analysis – XAUUSD July 25, 2025📊
________________________________________
🔍 Momentum Analysis
• D1 Timeframe: Momentum is declining. Based on the current pace, it’s likely that only 1–2 more daily candles are needed before momentum enters the oversold zone → suggesting one more potential downward leg.
• H4 Timeframe: Momentum is about to turn bearish, indicating we might see a sideways movement or a slight drop in the short term.
• H1 Timeframe: Momentum is currently falling. By the end of the current H1 candle, momentum will likely enter the oversold zone → potential for a bullish reversal soon.
________________________________________
🌀 Elliott Wave Structure
• A clear 5-wave Wave A has already formed with no irregular patterns, so I’m expecting Wave B (black) to unfold as a 3-wave structure.
• Within this black Wave B, price is now developing Wave B (blue), meaning Wave A (blue) has already completed. Looking at the lower timeframe, I can identify a 5-wave structure → suggesting a zigzag correction in the form of 5-3-5 for black Wave B.
• Target for Wave B (blue): The 3360 area – this is a support level and also aligns with Fibonacci confluence, making it a strong candidate for the end of Wave B (blue) and a potential reversal zone.
• If price respects the 3360 level, then projected targets for Wave C (blue) would be around 3386 or 3402.
• However, if price breaks below 3351, the current wave count becomes invalid. In that case, we will shift to an alternate scenario and look for a buy opportunity near the lower edge of the triangle (c)-(e) and other confluence support zones.
________________________________________
🔄 Combining Momentum & Wave Structure
• D1 momentum shows weakening in this downward move, and the lower boundary of the triangle (c)-(e) is a prime area to look for the end of Wave e.
• Ideally, we want to see:
o A short-term bounce upward aligning with H1 momentum reversal to complete Wave C (blue).
o Then a confluence with H4 momentum turning bearish, indicating possible trend continuation or reversal.
________________________________________
📌 Trade Plan
• For experienced traders:
Watch closely around 3385 and 3401 for reversal signals to enter Sell positions.
• For beginners, I recommend the following limit setup:
o SELL ZONE: 3399 – 3402
o SL: 3501
o TP1: 3374
o TP2: 3351
Gold (XAU/USD) 4-Hour Technical Analysis Report - 25 July 2025 📌 Market Context & Sentiment Overview
The gold market is currently trading in a state of technical compression, with the price hovering just beneath the mid-3360s. After a significant rally earlier in the month, the recent sessions have seen price action coiling within a tight ascending triangle—a classic pattern known to precede breakouts.
According to recent publications by FXEmpire, FXStreet, and Investing.com, sentiment remains moderately bullish. Analysts point to strong institutional demand near the 3320–3330 zone, while also warning of resistance pressures near the 3380–3390 zone. These insights align with our technical findings, which suggest a developing structure with increasing breakout potential.
📊 Technical Structure Analysis (4-Hour Timeframe)
🔹 Price Action & Structural Patterns
The prevailing structure is a rising triangle anchored between support at 3320 and resistance near 3380–3390. Price has been forming higher lows, indicative of underlying buying pressure, while simultaneously facing resistance at increasingly frequent tests of the upper band. The contraction of candlestick bodies and volume confirms the presence of a coiling market—hinting at an imminent directional move.
The presence of upper-wick rejections near 3380 signals seller interest, while long-tailed candles at 3330 underscore buyer defense of the rising trendline. This dynamic equilibrium is the hallmark of a triangle formation nearing completion.
🔹 Support & Resistance Levels
Our analysis identifies the following zones as technically significant:
Key Support (Buy Zones):
3320–3330: This zone hosts a major bullish order block, 8/21 EMAs, and the lower trendline of the rising triangle. It is further supported by the 61.8% Fibonacci retracement drawn from the 3300 low to the 3390 swing high.
3300–3310: A psychological level and previous 4-hour swing low. Acts as a secondary defense level.
Key Resistance (Sell Zones):
3380–3390: Triangle resistance, aligned with the 50 EMA and a bearish order block.
3440–3450: An upper extension zone if breakout materializes, noted in external institutional outlooks.
🔹 Volume, VWAP & Institutional Concepts
Volume has notably contracted, a classical feature of triangle formations, with most trading volume aggregating at the mid-point (~3345–3355). VWAP sits just below the current price, reflecting mean reversion tendencies. Furthermore, liquidity pockets are observed just beneath 3320, suggesting potential for liquidity grabs before a bullish reversal.
From a Smart Money lens:
A bullish order block has formed near 3320–3330.
A bearish OB and resistance cap prices around 3380.
A small Fair Value Gap (FVG) lies around 3340–3350, acting as a potential price magnet.
🔹 Indicators & Oscillators
Moving Averages: The 8/21 EMA cluster lies just below current price, offering dynamic support.
MACD: Negative but converging—suggesting bearish momentum may be waning.
ADX: Reading ~40, indicating a trending market, though momentum has slightly slowed.
RSI: Hovering near 35–40, close to oversold; signals potential bounce.
Stochastics & CCI: Both deeply negative—supporting the case for a mean-reverting move.
🎯 Strategic Buying & Selling Zones
✅ High-Probability Buy Zones
3320–3330:
Rationale: Confluence of bullish OB, rising trendline, EMAs, and Fib 61.8%.
Confidence: High (★ ★ ★)
3300–3310 (buffer zone):
Rationale: Psychological and historical swing low support.
Confidence: Moderate
❌ High-Probability Sell Zones
3380–3390:
Rationale: Triangle resistance, prior highs, and bearish OB presence.
Confidence: High
3440–3450:
Rationale: Post-breakout measured move target and potential take-profit zone.
Confidence: Moderate
🏆 The Golden Setup: High-Conviction Trade Idea
Direction: Long
Entry: 3325
Stop Loss: 3300
Take Profit: 3390
Confidence Level: ★ ★ ★ (High)
🔍 Justification
This setup takes advantage of the strongest structural support within the triangle—centered around 3325. This level is reinforced by the 61.8% Fibonacci retracement, bullish order block activity, and EMA compression, all coalescing with the triangle’s rising support line.
Indicators are turning from oversold, and the volume profile suggests that institutional players may look to engineer a liquidity sweep under 3330 before a continuation push to test the 3380 resistance. The reward-to-risk ratio is favorable, and the setup offers clear invalidation with a tight stop at 3300.
Should momentum continue post-breakout, a secondary TP could be explored at 3440. However, for the purpose of tactical execution, 3390 is a strategically sound exit point.
🧠 Sentiment Cross-Check & Market Alignment
External sentiment and professional forecasts support the underlying thesis of a bullish breakout, pending confirmation. TradingView’s top technical authors emphasize the breakout of this ascending triangle toward 3440+, while Investing.com’s shorter-term signals reflect bearish pressure that aligns with our buy-the-dip strategy.
This synthesis of internal and external analysis increases our conviction in a long-biased tactical approach from the current support zone.
✅ Summary Table
Buy Zones Sell Zones Golden Setup
3320–3330 (primary) 3380–3390 (primary) Direction: Long
3300–3310 (buffer) 3440–3450 (extension) Entry: 3325
Stop Loss: 3300
Take Profit: 3390
Confidence Level: ★ ★ ★ (High)
🔚 Final Thoughts
Gold’s current price structure presents a rare opportunity—one defined by tight consolidation, structural clarity, and institutional footprints. As the market coils within a classic triangle, the 3320–3330 zone emerges as a high-probability springboard for long positions. With precise risk management and a disciplined approach, this setup offers traders a compelling entry with defined technical boundaries.
The golden rule now: Respect structure. React to confluence. Trade with conviction.
350pips Secured — Focus Shifts to Dip-Buying StrategyToday's trading was very successful, and the grasp of the long and short rhythm was very accurate. Today's trading situation is as follows:
1. Close the short position with an overnight entry price of around 3386 near 3380, with a loss of 60 pips, and the loss amount exceeded $6K;
2. Directly short gold near 3380, manually close the position near 3366, profit 130pips, profit amount exceeded $12K;
3. Long gold near 3356, hit TP: 3372 and end the transaction, profit 160pips, profit amount exceeded $8K;
4. Long gold near 3362, hit TP; 3375 and end the transaction, profit 120pips, profit amount exceeded $6K.
Intraday trading summary: Today, the long and short sides completed a total of 4 transactions, one of which suffered a loss, but the net profit was 350pips, and the profit amount exceeded $20K. For short-term trading, I think I can submit a satisfactory answer to myself today!
How to execute the transaction next? Gold started to pull back from around 3438 and has now reached a low of around 3351, with a retracement of more than 870pips. The retracement space is not small. However, gold has stabilized above 3350 and has started a technical rebound repair, and the upward force is not weak, so gold may have completed the retracement. Under the support of these two technical conditions, gold may regain its upward momentum and hit 3400 again.
At present, the short-term resistance is obvious, located in the area near 3380. Once gold breaks through 3380, gold will inevitably continue to rise and hit 3400 again; but I think as long as gold stabilizes above 3350, it is not difficult to break through the short-term resistance of 3380, so gold will inevitably test the 3400 mark again; and the short-term support below is in the 3365-3355 area. Gold may still retreat to this area first during the rise in order to increase liquidity and accumulate momentum, helping gold to break through 3380 more easily.
So for the next short-term trading, I think it is feasible to go long on gold in the 3365-3355 area, first looking at the target area of 3380-3390, and then 3400.

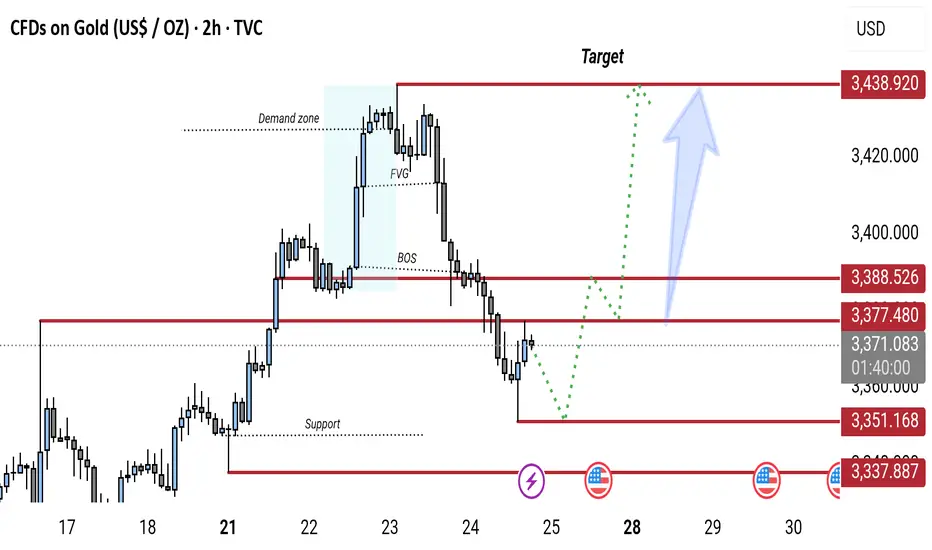
Gold 2H Chart: Bullish Reversal Expected from Key Support ZoneGold (XAU/USD) 2H chart shows a bearish break of structure (BOS) followed by a pullback toward a key support zone (around 3,337–3,351). A potential bullish reversal is expected from this zone, targeting the 3,438 resistance level. The chart highlights a demand zone, FVG (Fair Value Gap), and possible retracement before continuation to the upside.