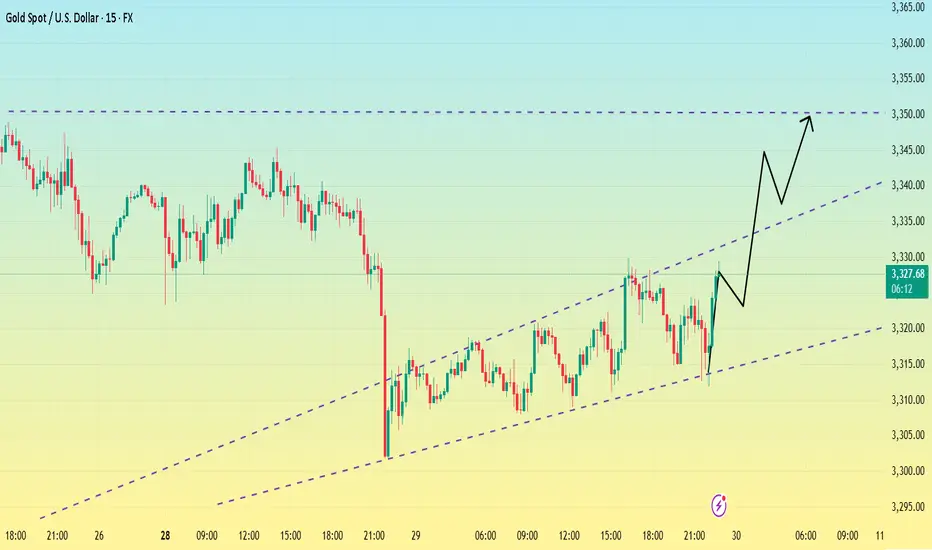
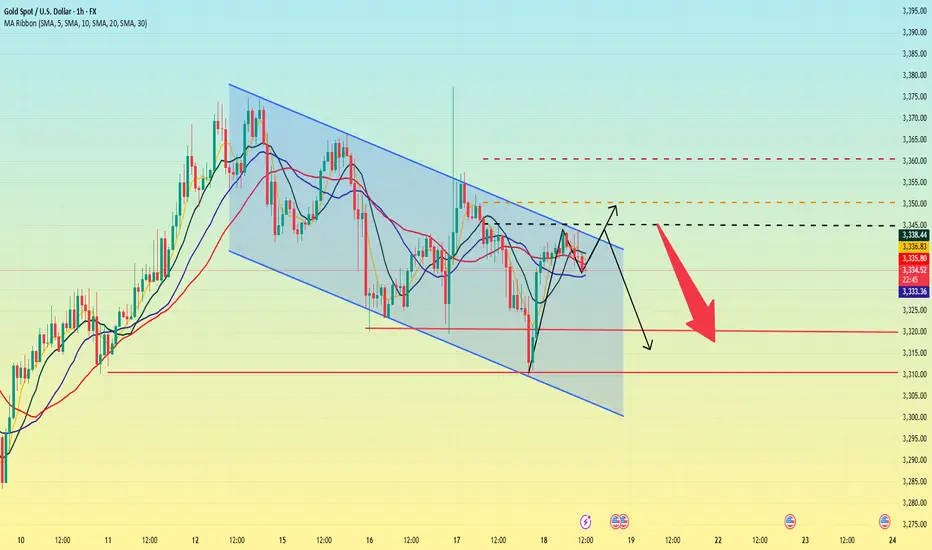
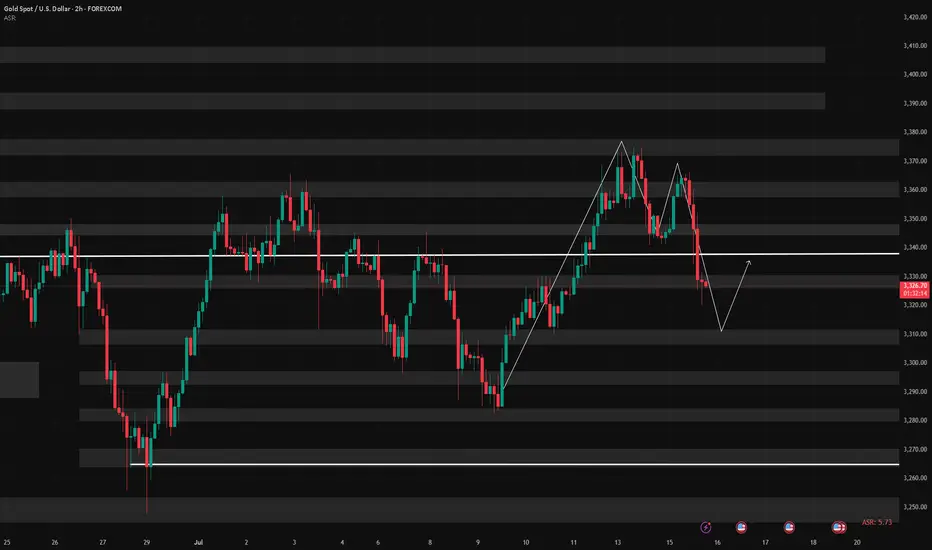
Is the uptrend complete? Will there be a pullback?On the last trading day of this week, gold prices soared, rising nearly $56, driven by the non-farm payroll data. The rally began at 3300 and peaked near 3356. The price has now retreated slightly, fluctuating around 3345.
The current uptrend has repeatedly tested the resistance level near 3355 but has failed to break through. The RSI indicator hovered around 76.8, indicating a gradual flattening of the upward trend. The 3355 high is likely the end of this uptrend.
As this is the last day of a major data week, Quaid believes the current uptrend is complete. Consider a light short position around 3350-3355. The current low has yet to be confirmed, and the pullback is likely to end around 3335.
However, we cannot rule out the possibility that the price will remain within the upward channel with slight fluctuations on the last trading day of the week.
Xauusdwave

Bottoming out? Be wary of the market.After a sharp drop to around 3300 on Monday, gold rebounded, reaching a high of around 3330 so far.
From the 1-hour chart,Gold has now broken out and stabilized within the hourly chart's downward trend channel. The key upward level is currently around 3330. If it breaks above 3330 again, caution is advised; it may test 3345-3350. Conversely, if it fails to break above 3330, gold may consolidate between 3300-3330 before the non-farm payrolls release.
From a short-term 15-minute perspective, the current 15-minute range has been broken out and stabilized. The current situation is unfavorable for bears. Based on the trend, a breakout above the 15-minute range would indicate a rebound. However, until 3330 holds, the 3320-3330 range is the only option. However, the current trend favors a bullish pullback, so I'm not too keen on shorting. Therefore, focus on support at 3320.
If it fails to break below 3320, enter a long position near 3320. The upper target is the top of the 3345-3350 range.
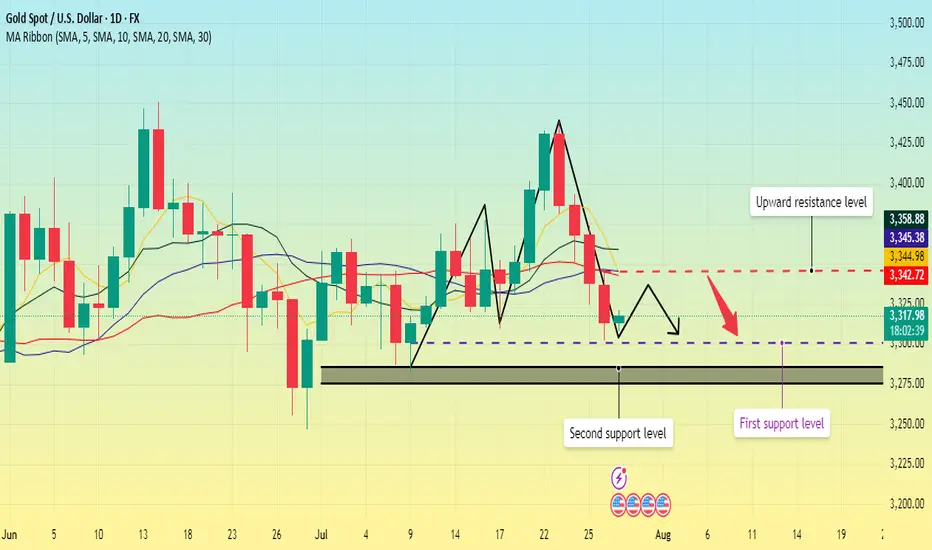
Gold repeatedly tested lows. Will it break through?On Monday, the Asian market opened low and rose in the early trading. In the European trading, it rose to around 3345. The European trading was under pressure and fluctuated. The US trading began to accelerate its decline, and the lowest point reached around 3302. Then it continued to fluctuate in the range of 3300-3320.
On July 27, the United States and the European Union reached a framework trade agreement; the agreement reduced market concerns about the global economic recession, promoted the attractiveness of risky assets, and boosted the stock market and the US dollar. Although Trump has repeatedly pressured for a substantial interest rate cut, the market has strong expectations for a September interest rate cut. The current expectation of maintaining a stable interest rate dominates the market, coupled with the strength of the US dollar, which puts gold prices under downward pressure in the short term.
Gold opened low in the early trading on Monday and then rebounded to recover the losses, but then fell below the low again, and the daily line closed in the negative, and now it has formed a four-day negative decline. MA5 and 10-day moving averages form a dead cross, and there is a downward turn.
The focus on the upper side is around Monday's high of 3345, which is also near the current position of MA5, 20, and 30-day moving averages. Below this position, gold is weak; if it breaks upward, it is necessary to prevent the possibility of a rebound correction.
The lower support first focuses on the 3300 integer mark; secondly, focus on the area around 3285-3275.
Operation strategy:
Short near 3340, stop loss 3350, profit range 3320-3300;
Long near 3300, stop loss 3290, profit range 3320-3340.
Before the release of US data on Tuesday, you can maintain this operation strategy; after the data is released, adjust the strategy based on the impact of the data.
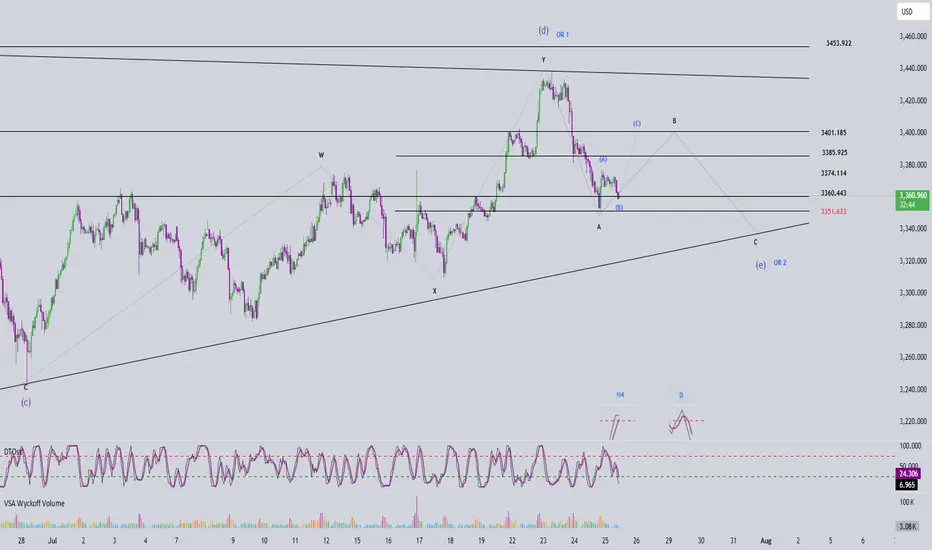
Elliott Wave Analysis – XAUUSD July 25, 2025📊
________________________________________
🔍 Momentum Analysis
• D1 Timeframe: Momentum is declining. Based on the current pace, it’s likely that only 1–2 more daily candles are needed before momentum enters the oversold zone → suggesting one more potential downward leg.
• H4 Timeframe: Momentum is about to turn bearish, indicating we might see a sideways movement or a slight drop in the short term.
• H1 Timeframe: Momentum is currently falling. By the end of the current H1 candle, momentum will likely enter the oversold zone → potential for a bullish reversal soon.
________________________________________
🌀 Elliott Wave Structure
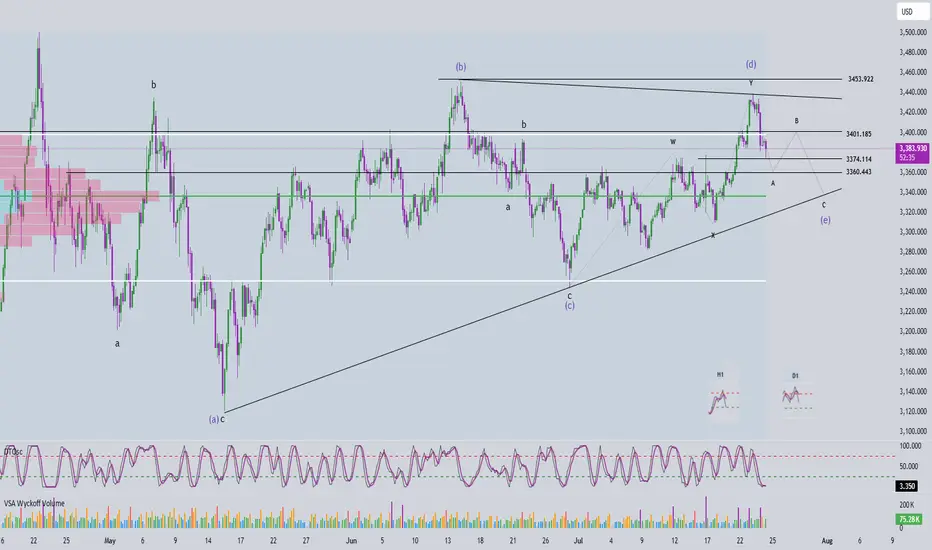
• A clear 5-wave Wave A has already formed with no irregular patterns, so I’m expecting Wave B (black) to unfold as a 3-wave structure.
• Within this black Wave B, price is now developing Wave B (blue), meaning Wave A (blue) has already completed. Looking at the lower timeframe, I can identify a 5-wave structure → suggesting a zigzag correction in the form of 5-3-5 for black Wave B.
• Target for Wave B (blue): The 3360 area – this is a support level and also aligns with Fibonacci confluence, making it a strong candidate for the end of Wave B (blue) and a potential reversal zone.
• If price respects the 3360 level, then projected targets for Wave C (blue) would be around 3386 or 3402.
• However, if price breaks below 3351, the current wave count becomes invalid. In that case, we will shift to an alternate scenario and look for a buy opportunity near the lower edge of the triangle (c)-(e) and other confluence support zones.
________________________________________
🔄 Combining Momentum & Wave Structure
• D1 momentum shows weakening in this downward move, and the lower boundary of the triangle (c)-(e) is a prime area to look for the end of Wave e.
• Ideally, we want to see:
o A short-term bounce upward aligning with H1 momentum reversal to complete Wave C (blue).
o Then a confluence with H4 momentum turning bearish, indicating possible trend continuation or reversal.
________________________________________
📌 Trade Plan
• For experienced traders:
Watch closely around 3385 and 3401 for reversal signals to enter Sell positions.
• For beginners, I recommend the following limit setup:
o SELL ZONE: 3399 – 3402
o SL: 3501
o TP1: 3374
o TP2: 3351
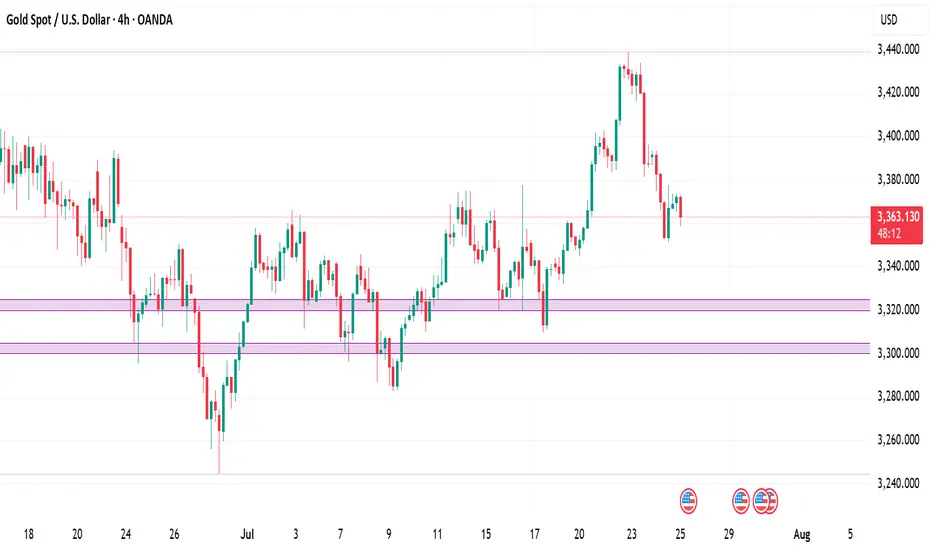
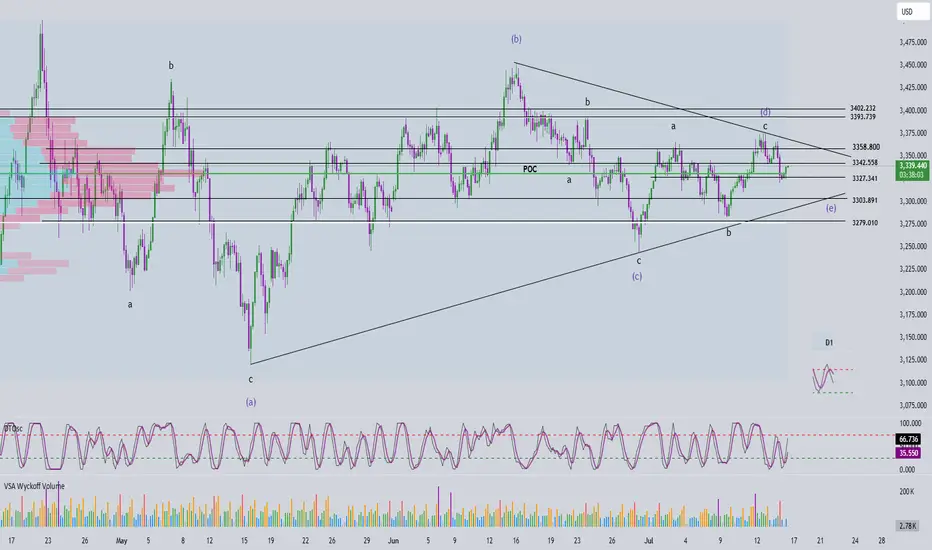
Gold (XAU/USD) 4-Hour Technical Analysis Report - 25 July 2025 📌 Market Context & Sentiment Overview
The gold market is currently trading in a state of technical compression, with the price hovering just beneath the mid-3360s. After a significant rally earlier in the month, the recent sessions have seen price action coiling within a tight ascending triangle—a classic pattern known to precede breakouts.
According to recent publications by FXEmpire, FXStreet, and Investing.com, sentiment remains moderately bullish. Analysts point to strong institutional demand near the 3320–3330 zone, while also warning of resistance pressures near the 3380–3390 zone. These insights align with our technical findings, which suggest a developing structure with increasing breakout potential.
📊 Technical Structure Analysis (4-Hour Timeframe)
🔹 Price Action & Structural Patterns
The prevailing structure is a rising triangle anchored between support at 3320 and resistance near 3380–3390. Price has been forming higher lows, indicative of underlying buying pressure, while simultaneously facing resistance at increasingly frequent tests of the upper band. The contraction of candlestick bodies and volume confirms the presence of a coiling market—hinting at an imminent directional move.
The presence of upper-wick rejections near 3380 signals seller interest, while long-tailed candles at 3330 underscore buyer defense of the rising trendline. This dynamic equilibrium is the hallmark of a triangle formation nearing completion.
🔹 Support & Resistance Levels
Our analysis identifies the following zones as technically significant:
Key Support (Buy Zones):
3320–3330: This zone hosts a major bullish order block, 8/21 EMAs, and the lower trendline of the rising triangle. It is further supported by the 61.8% Fibonacci retracement drawn from the 3300 low to the 3390 swing high.
3300–3310: A psychological level and previous 4-hour swing low. Acts as a secondary defense level.
Key Resistance (Sell Zones):
3380–3390: Triangle resistance, aligned with the 50 EMA and a bearish order block.
3440–3450: An upper extension zone if breakout materializes, noted in external institutional outlooks.
🔹 Volume, VWAP & Institutional Concepts
Volume has notably contracted, a classical feature of triangle formations, with most trading volume aggregating at the mid-point (~3345–3355). VWAP sits just below the current price, reflecting mean reversion tendencies. Furthermore, liquidity pockets are observed just beneath 3320, suggesting potential for liquidity grabs before a bullish reversal.
From a Smart Money lens:
A bullish order block has formed near 3320–3330.
A bearish OB and resistance cap prices around 3380.
A small Fair Value Gap (FVG) lies around 3340–3350, acting as a potential price magnet.
🔹 Indicators & Oscillators
Moving Averages: The 8/21 EMA cluster lies just below current price, offering dynamic support.
MACD: Negative but converging—suggesting bearish momentum may be waning.
ADX: Reading ~40, indicating a trending market, though momentum has slightly slowed.
RSI: Hovering near 35–40, close to oversold; signals potential bounce.
Stochastics & CCI: Both deeply negative—supporting the case for a mean-reverting move.
🎯 Strategic Buying & Selling Zones
✅ High-Probability Buy Zones
3320–3330:
Rationale: Confluence of bullish OB, rising trendline, EMAs, and Fib 61.8%.
Confidence: High (★ ★ ★)
3300–3310 (buffer zone):
Rationale: Psychological and historical swing low support.
Confidence: Moderate
❌ High-Probability Sell Zones
3380–3390:
Rationale: Triangle resistance, prior highs, and bearish OB presence.
Confidence: High
3440–3450:
Rationale: Post-breakout measured move target and potential take-profit zone.
Confidence: Moderate
🏆 The Golden Setup: High-Conviction Trade Idea
Direction: Long
Entry: 3325
Stop Loss: 3300
Take Profit: 3390
Confidence Level: ★ ★ ★ (High)
🔍 Justification
This setup takes advantage of the strongest structural support within the triangle—centered around 3325. This level is reinforced by the 61.8% Fibonacci retracement, bullish order block activity, and EMA compression, all coalescing with the triangle’s rising support line.
Indicators are turning from oversold, and the volume profile suggests that institutional players may look to engineer a liquidity sweep under 3330 before a continuation push to test the 3380 resistance. The reward-to-risk ratio is favorable, and the setup offers clear invalidation with a tight stop at 3300.
Should momentum continue post-breakout, a secondary TP could be explored at 3440. However, for the purpose of tactical execution, 3390 is a strategically sound exit point.
🧠 Sentiment Cross-Check & Market Alignment
External sentiment and professional forecasts support the underlying thesis of a bullish breakout, pending confirmation. TradingView’s top technical authors emphasize the breakout of this ascending triangle toward 3440+, while Investing.com’s shorter-term signals reflect bearish pressure that aligns with our buy-the-dip strategy.
This synthesis of internal and external analysis increases our conviction in a long-biased tactical approach from the current support zone.
✅ Summary Table
Buy Zones Sell Zones Golden Setup
3320–3330 (primary) 3380–3390 (primary) Direction: Long
3300–3310 (buffer) 3440–3450 (extension) Entry: 3325
Stop Loss: 3300
Take Profit: 3390
Confidence Level: ★ ★ ★ (High)
🔚 Final Thoughts
Gold’s current price structure presents a rare opportunity—one defined by tight consolidation, structural clarity, and institutional footprints. As the market coils within a classic triangle, the 3320–3330 zone emerges as a high-probability springboard for long positions. With precise risk management and a disciplined approach, this setup offers traders a compelling entry with defined technical boundaries.
The golden rule now: Respect structure. React to confluence. Trade with conviction.
Elliott Wave Analysis – XAUUSD July 24, 2025📊
________________________________________
🔍 Momentum Analysis:
• D1 Timeframe: Momentum is currently in a downtrend, indicating that the dominant trend in the short term (at least until early next week) is likely to remain bearish or sideways.
• H4 Timeframe: Momentum has entered the oversold zone and is showing signs of a potential bullish reversal. This suggests that a corrective upward move may occur today.
• H1 Timeframe: Momentum is still declining and is expected to need around two more H1 candles before entering the oversold zone, implying that one more leg down may occur before a recovery begins.
________________________________________
🌀 Elliott Wave Structure Update:
Yesterday’s expectation of a breakout above the resistance zone at 3453 to confirm the start of a new bullish trend did not materialize. Instead, price dropped to the 3374 region, opening up two primary scenarios:
✅ Scenario 1: The correction is still unfolding
• Wave (d) in blue appears to be complete.
• The current leg is likely wave (e), the final leg in a contracting triangle correction.
• In this case, the lower boundary of the triangle and overlapping support zones will serve as key levels to watch for the completion of wave (e).
✅ Scenario 2: Wave 1 of a new bullish trend has completed
• The current decline is wave 2 in a new bullish impulsive sequence.
• The objective here is to identify the bottom of wave 2 to prepare for a potential buy entry into wave 3, which is expected to be stronger and longer than wave 1.
📌 Key difference between the two scenarios:
• Scenario 1 → Wave (e) completes, followed by wave 1 of wave 5.
• Scenario 2 → Wave 2 completes, followed by a powerful wave 3 of wave 5.
________________________________________
🧩 Current Wave Structure:
• A five-wave bearish structure is currently unfolding on the chart.
• According to Elliott Wave Theory, corrective patterns do not typically form five-wave structures.
• Therefore, this is likely wave A in a zigzag (5-3-5) formation.
• Possible targets for wave 5 within wave A:
o Target 1: 3374 – current reaction zone.
o Target 2: 3360 – next significant support level.
________________________________________
📌 Combining Wave Structure with Momentum:
The D1 momentum is firmly bearish, reinforcing the view that the market is undergoing a larger ABC correction.
On the H4 timeframe, momentum is oversold and showing early signs of reversal, aligning with the potential formation of wave B — typically a weak, sideways upward move. The likely resistance zone for the end of wave B lies between 3401 and 3410.
Meanwhile, H1 momentum is still falling and not yet in the oversold zone, suggesting there may be one more move down to complete wave 5. The ideal target for this final leg is around 3360.
Summary:
• D1 bearish → confirms ongoing major correction.
• H4 oversold → supports a potential weak wave B.
• H1 still declining → wave 5 may complete around 3360 before a recovery begins.
________________________________________
💼 Suggested Trading Plan:
For traders with limited experience or those not yet confident in reading live market signals, a Buy Limit strategy at clear support levels is recommended:
• Buy Zone: 3362 – 3360
• Stop Loss: 3352
• Take Profit:
o TP1: 3384
o TP2: 3400
🎯 For experienced traders, it is advised to observe price action at the target support zones and look for real-time reversal signals to optimize entry timing.
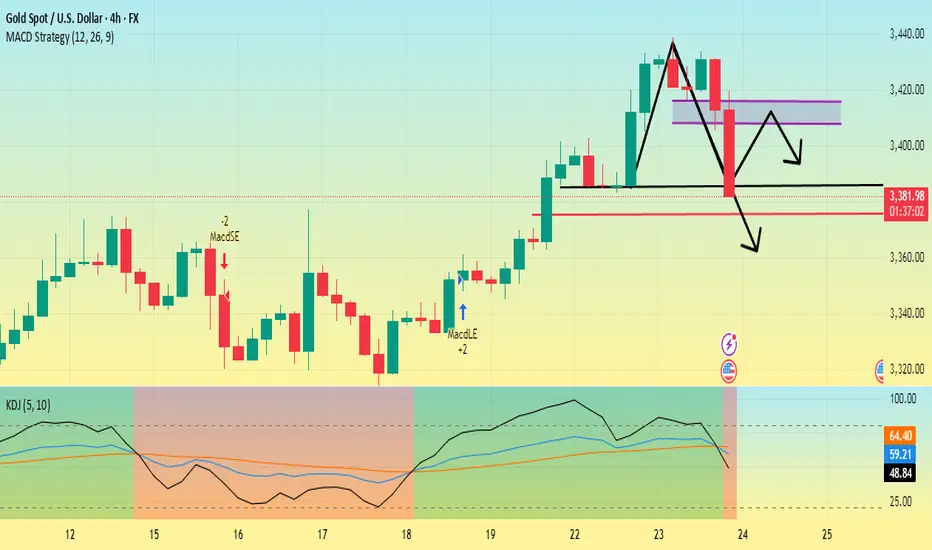
Gold is going down. Can it break through?First, we can look at the daily chart,Currently, the support below the gold daily chart is around 3385, which is also the low point on Tuesday. The current price drop has already touched the support near 3385.
Secondly, from the 4-hour chart, the low point of yesterday's US market retracement was around 3405, and the high point on Monday was 3400. So the first pressure point of this price correction is 3400-3410, followed by the suppression position near 3420.
The 4-hour chart shows that the gold price fluctuated in the 3410-3440 range in the early stage, the MACD red column shortened, and the KDJ dead cross began to appear, facing the pressure of correction in the short term.
At present, the main focus is on whether the 3385 support line can be broken. If it falls below this support level, it will most likely touch around 3375. Then gold will most likely start a downward trend and the rebound will be weak.
Elliott Wave Analysis – XAUUSD July 23, 2025________________________________________
🔍 Momentum Analysis:
• D1 Timeframe: Daily momentum is showing signs of a potential bearish reversal. We need to wait for today’s daily candle to close to confirm this. It signals that the bullish momentum is weakening.
• H4 Timeframe: Momentum is turning down. It may take around 2 more bearish H4 candles to push momentum into the oversold zone → suggesting continued downside movement today.
• H1 Timeframe: Momentum is already in the oversold zone and the indicators are “clinging” together → implying possible continued minor declines or sideways movement.
________________________________________
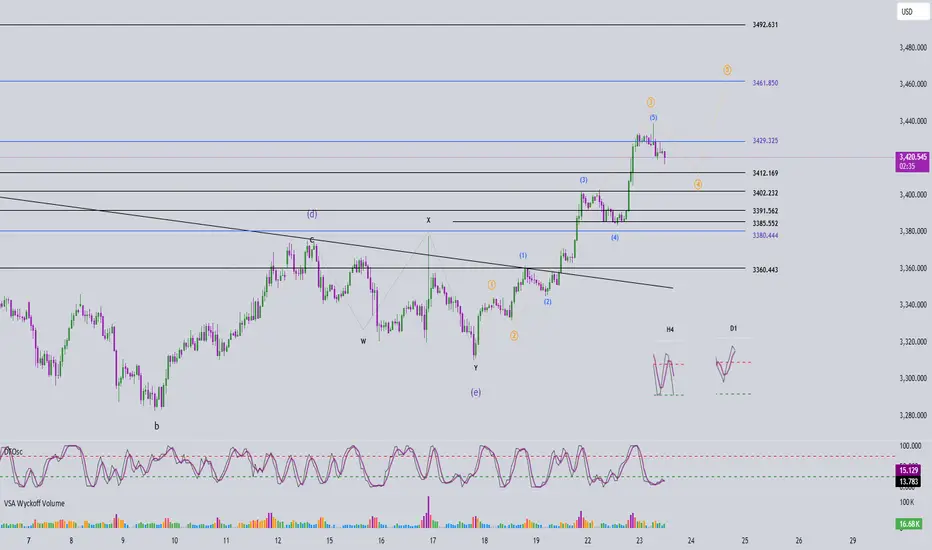
🌀 Elliott Wave Structure Update:
• On the H1 chart, a 5-wave structure (yellow) is unfolding.
o Wave 3 (yellow) appears completed, supported by a clear 5-wave internal structure in blue.
o The market is currently in Wave 4 (yellow) – a corrective move.
🔸 Potential Wave 4 (yellow) targets:
• Target zone 1: Around 3412
• Target zone 2: Around 3402
📌 Once Wave 4 (yellow) completes, we anticipate the market will form Wave 5 (yellow).
🔸 Projected Wave 5 (yellow) targets:
• TP1: 3461
• TP2: 3492 (in case of an extension)
________________________________________
🔄 Combining Momentum & Wave Structure:
• The potential bearish reversal in D1 momentum suggests the current bullish trend may be nearing its end – consistent with Wave 5 being the final push before a broader correction.
• H4 and H1 momentum support the ongoing correction in Wave 4.
✅ Wave 4 typically takes the form of a zigzag, flat, or triangle → Wait for a strong bullish H1 candle to confirm the end of Wave 4 and initiate a buy entry.
________________________________________
📊 Trade Plan:
🟩 Buy Zone 1:
• BUY ZONE: 3414 – 3412
• SL: 3407
• TP1: 3439
• TP2: 3461
• TP3: 3492
🟩 Buy Zone 2:
• BUY ZONE: 3403 – 3401
• SL: 3393
• TP1: 3439
• TP2: 3461
• TP3: 3492
Gold is strong. Can it continue?On Tuesday, the overall gold price showed an upward trend. The highest price rose to 3433.32 on the day, and the lowest price fell to 3383.21, closing at 3431.46. On Tuesday, gold prices fluctuated during the early trading session and then corrected downward. During the European session, the price fluctuated mainly and fell weakly. It rose before the US session and hit the high point of the week again in the US session, and finally ended with a big positive line.
From the four-hour level, the technical adjustment needs, but the speculation of risk aversion suppressed this demand. There is a contradiction between the fundamentals and the technical aspects, and it is necessary to wait for the market sentiment to stabilize before clarifying the direction.
In the early Asian session, it hit a high of 3438 and then fell back. It is necessary to pay attention to the possibility of reaching the top. The support position is 3400-3405. If it falls to 3400, it may continue to adjust to around 3385. The probability of closing the negative line today is relatively high. If the price stabilizes above 3400, it is likely to maintain high fluctuations.
Today's market is complicated. Although the bullish trend has not changed, it is not advisable to be overly bullish. The operation is mainly shorting on rebounds, supplemented by long positions on pullbacks. The upper pressure position focuses on 3440-3450.
Operation strategy:
Short near 3440-3450, stop loss 3460, profit range 3420-3410.
Long near 3390, stop loss 3380, profit range 3420-3430.

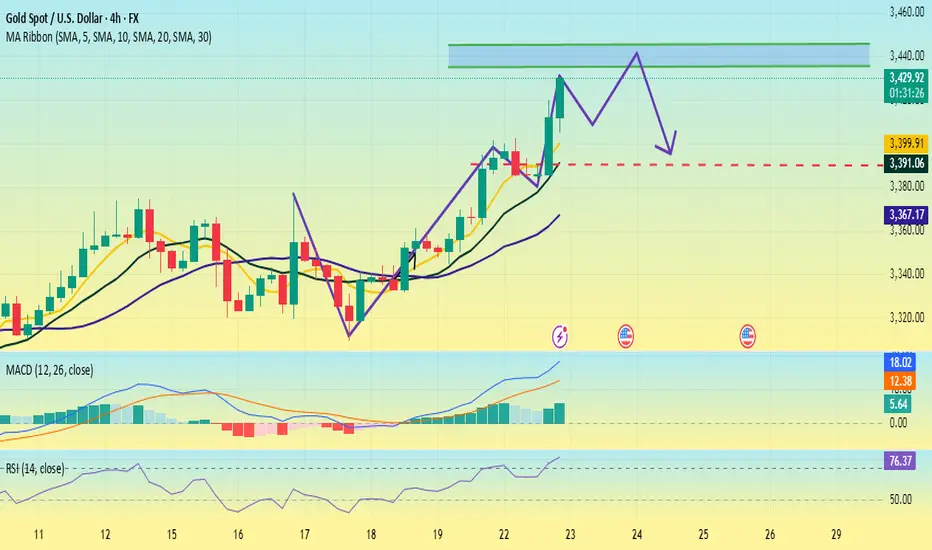
Gold is under pressure. Can it break through?Since the "W bottom" pattern was formed at the low of 3344 US dollars, the gold price broke through the neckline of 3380 and further stabilized at 3400 today, confirming the continuation of the medium-term upward trend. The moving average system is arranged in a bullish pattern, with the 5-day, 10-day and 20-day moving averages diverging upward in turn, and the support strength is stable.
The MACD indicator golden cross continues to expand, the upward momentum is enhanced, and no divergence occurs; the RSI indicator rises to around 76. Although it enters the overbought range, there is no obvious turn, indicating that the bullish momentum is still being released.
The current support level has risen to around 3390, and the support level has risen sharply. The resistance position needs to pay attention to 3430-3440. At present, several times have tested above 3430, but they have not stabilized above this position.
Operation suggestions:
3390-3400 light position to try more, stop loss 3360, profit range 3435-3445.
If it encounters resistance and falls back near 3435, you can consider short-term short orders with stop loss at 3445 and profit range at 3400-3380.
Although the upward momentum continues, some risk information still needs to be paid attention to; this week, we need to pay attention to the US June existing home sales data (July 23), the preliminary value of the second quarter GDP (July 25) and the core PCE price index (July 26). If the data is stronger than expected, it may trigger expectations of interest rate cuts.
Elliott Wave Analysis – XAUUSD | July 22, 2025
🔍 Momentum Overview
• D1 timeframe: Momentum has entered the overbought zone, signaling a potential reversal within the next 1–2 sessions. That said, the current bullish leg may still extend — it’s important to wait for tomorrow’s D1 candle close for confirmation. Entering overbought territory is a warning that upside momentum is weakening.
• H4 timeframe: Momentum is currently declining. Unless a strong bullish candle closes above 3391 to trigger a reversal, the price is likely to continue moving sideways or downward today.
• H1 timeframe: There are signs of a bullish reversal. If the price holds above 3385 and posts a strong breakout candle above 3391, it could present a short-term buying opportunity.
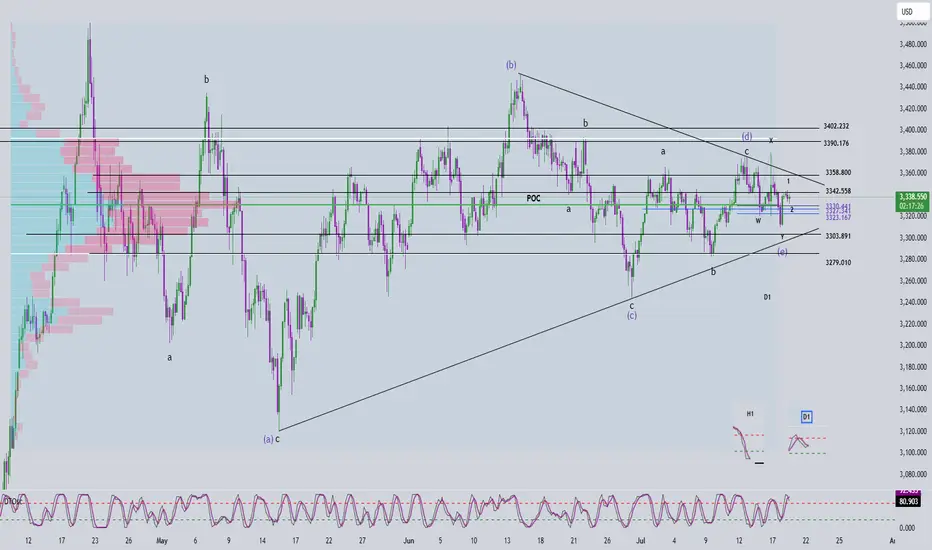
🌀 Elliott Wave Structure Update
• Price is consolidating within the 3390 – 3402 range — a key zone to monitor closely.
• The 3380 level is a critical threshold, aligned with the 0.382 Fibonacci retracement of Wave (3). A daily close below this level would raise the possibility that the move is part of a correction rather than Wave 4.
• A flat ABC correction is currently unfolding, with the 1.618 extension of Wave A already reached at 3385.
• If price breaks below 3360, it would overlap with the previous Wave 1, invalidating the current impulsive wave count. In that case, we should consider the potential continuation of a larger abcde triangle correction.
🔗 Momentum & Wave Structure Combined
• H1 is showing early signs of a bullish reversal, but H4 momentum remains bearish. Without a strong breakout candle above 3391, price is likely to drift sideways or lower until H4 reaches the oversold zone.
• Conservative approach: Wait for H4 to enter oversold territory before considering any long positions.
• The ideal buy setup would be a bullish reaction from the 3382 – 3380 zone.
📈 Trade Setup
• Buy Zone: 3382 – 3380
• Stop Loss: 3372
• Take Profit 1: 3402
• Take Profit 2: 3412
• Take Profit 3: 3428

Gold is under pressure. There is hope for another rise.Today's important news:
At 8:30, Fed Chairman Powell delivered a welcome speech at a regulatory meeting; at 13:00, Fed Governor Bowman hosted a fireside chat session at the large bank capital framework meeting hosted by the Fed.
Market conditions:
The current daily trend is mainly "strong rise" (Monday closed positive and broke through the shock, and the moving average turned upward). The core logic is that short-term bullish momentum is dominant, and it is necessary to focus on the effectiveness of support and the rhythm of breaking through resistance.
Today, we need to focus on the support belt 3365-3360 area (this position is the 5-day moving average position and the low point of yesterday's European session). As a short-term moving average support, this area is the first line of defense for bulls today. If it can stabilize here, it can be regarded as a signal of short-term strong continuation.
The key pressure level is still around 3420. As a trend line resistance that has been under pressure many times in the early stage, if it can break through, it means that the bulls will break the shock suppression and open up more room for growth.
In terms of operation, it is still mainly low-long. The current gold is still strong. Operation strategy:
Short around 3420, stop loss 3430, profit range 3400-3380
Long around 3360, stop loss 3350, profit range 3380-3400

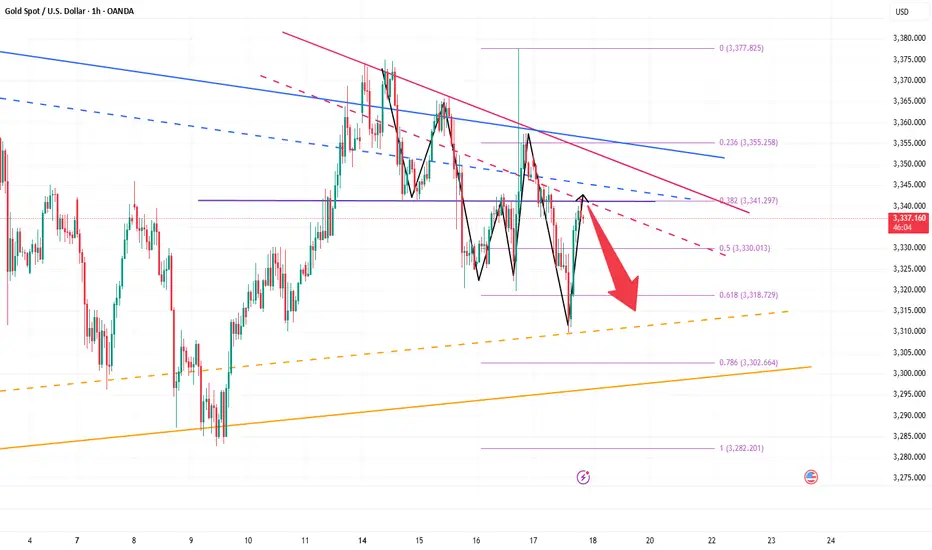
Elliott Wave Analysis – XAUUSD July 17, 2025
🔍 Momentum Analysis
D1 timeframe: Momentum is still trending downward, but we’re starting to see signs of convergence between the indicator lines. Normally, we would expect another two daily candles to reach the oversold zone and trigger a potential reversal. However, with the current narrowing pattern, we cannot rule out the possibility of an earlier reversal. Today’s daily close will be crucial for confirmation.
H4 timeframe: Momentum is clearly declining, suggesting that the market may either continue downwards or consolidate sideways throughout the day.
🌀 Elliott Wave Structure
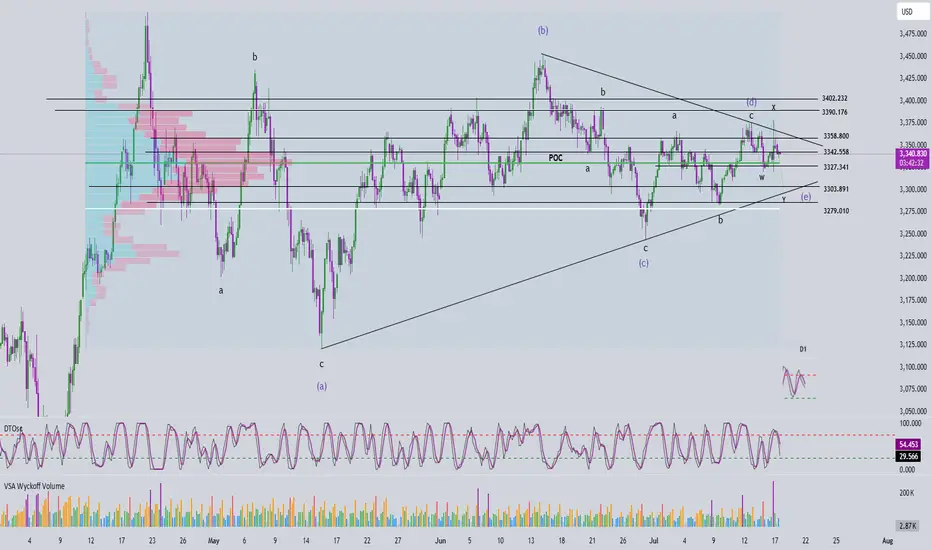
On the H4 chart, price action is compressing tightly at the end of a symmetrical triangle pattern – a classic setup in Elliott Wave theory. Notably, this final point of compression coincides with the POC (Point of Control), indicating a key price level where high volume has accumulated.
Wave W (in black) follows a 3-wave structure. Yesterday, price surged to the beginning of wave W and then sharply reversed, forming the basis for two potential scenarios:
Scenario 1 – WXY structure with current price completing wave Y within wave e (green):
+ Target 1: 3327
+ Target 2: 3303
Scenario 2 – Wave e (green) evolves into a triangle:
+ In this case, price may consolidate sideways above the 3327 zone.
🔗 Combining Wave and Momentum Analysis
Both D1 and H4 momentum indicators are still pointing downward. However, the price candles appear overlapping and lack clear directional strength – a common trait of compression near the triangle’s apex. With price sitting right on the POC, there’s a high chance of continued tightening before a breakout. At this stage, the recommended strategy is to wait for a strong bullish candle at one of the target zones before entering a BUY position.
📈 Trade Setup
✅ Scenario 1 – BUY at 3327 – 3326
+ Stop Loss: 3317
+ Take Profit 1: 3342
+ Take Profit 2: 3358
+ Take Profit 3: 3402
✅ Scenario 2 – BUY at 3305 – 3302
+ Stop Loss: 3295
+ Take Profit 1: 3327
+ Take Profit 2: 3358
+ Take Profit 3: 3402
Elliott Wave Analysis – XAUUSD | July 21, 2025
🔍 Momentum Analysis
- D1 Timeframe: Momentum is currently rising → the dominant trend over the next 3 days is likely to remain bullish.
- H4 Timeframe: Momentum is approaching the oversold area → just one more bearish H4 candle could complete the entry into oversold territory.
- H1 Timeframe: Momentum is about to reverse downward → suggesting a short-term corrective pullback in the current session.
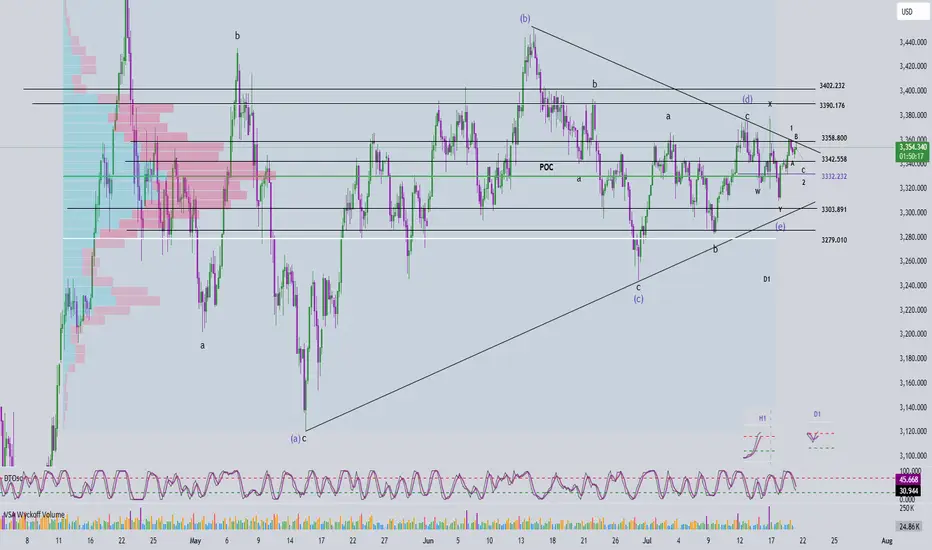
🌀 Elliott Wave Structure Update
On the H4 chart, price continues to consolidate within a corrective triangle structure. According to our previous plan, price approached the 3358 zone, and we expect:
- Wave 1 (black) may have completed at the 3358 high.
- Currently, Wave 2 (black) is likely unfolding:
+ Wave A appears to have completed.
+ The current upward leg is part of Wave B.
+ A final drop in Wave C is expected, with two key target zones:
- Target 1: 3342
- Target 2: 3332
🔎 Combining Momentum & Wave Structure
- If price breaks above 3358, we want to see a sharp, impulsive, and steep rally to confirm the beginning of Wave 3.
- If price movement remains choppy or overlapping, the market is likely still in a corrective phase.
- Key resistance zone to monitor: 3390–3402 – a clean breakout above this range would significantly strengthen the Wave 3 scenario.
📌 Trade Plan
1️⃣ BUY Setup #1
Entry Zone: 3343 – 3341
Stop Loss: 3337
Take Profit 1: 3358
Take Profit 2: 3390
2️⃣ BUY Setup #2
Entry Zone: 3333 – 3331
Stop Loss: 3323
Take Profit 1: 3358
Take Profit 2: 3390
📎 Note: Prioritize entries that come with clear confirmation signals from price action and momentum. Avoid buying during choppy or indecisive market conditions.
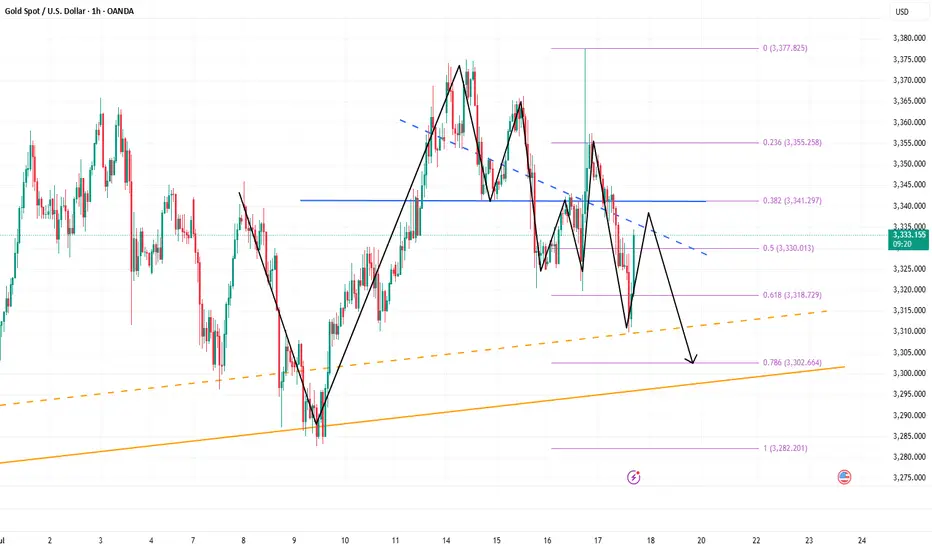
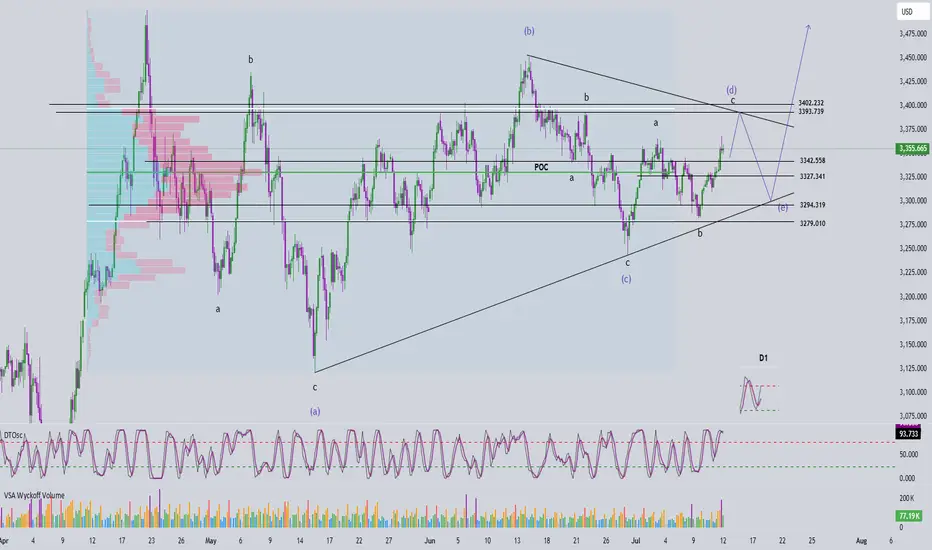
Elliott Wave Analysis – XAUUSD July 18, 2025📈 Elliott Wave Analysis – XAUUSD July 18, 2025
🔍 Momentum Analysis
D1 Timeframe: Momentum is showing signs of a bullish reversal. While we need to wait for today's D1 candle to close for confirmation, it's likely that yesterday’s upward move marks Wave 1, signaling the beginning of a new bullish trend.
H4 Timeframe: Momentum is preparing for a bearish reversal → suggesting a potential corrective pullback, likely forming Wave 2.
H1 Timeframe: Momentum is about to reverse upward → supporting the expectation of a short-term bullish move during the current session.
🌀 Elliott Wave Structure Update
On the H4 chart, the abcde triangle correction structure remains largely unchanged.
However, a strong H4 bullish candle appeared yesterday, indicating unusual market behavior that deserves attention.
There are two main scenarios:
- Wave 1 (black) has already completed, and the market is now entering Wave 2 correction.
- Alternatively, the current movement could be Wave 4 within Wave 1 (black).
🔎 Combining Momentum & Wave Structure
- With D1 momentum signaling a potential uptrend lasting the next 4–5 days, it suggests that Wave e (blue) may have completed.
- This opens the door for an impulsive 5-wave advance. Specifically:
+ If H1 continues its bullish reversal, the current move could be Wave 5 of Wave 1 (black), targeting the 3358 level.
+ Afterwards, a retracement toward the 3330–3323 zone would form Wave 2 (black).
+ Alternatively, price might drop directly to 3330–3323, implying Wave 1 has already finished and the current move is Wave 2.
🎯 => Both scenarios converge at the 3330–3323 price zone, making it a high-probability BUY ZONE.
🧭 Trade Plan
BUY ZONE: 3330 – 3327
Stop Loss: 3320
Take Profits:
TP1: 3342
TP2: 3358
TP3: 3402
📌 Note: Since this is a relatively wide entry zone, it's best to wait for price action confirmation at this level before entering.
Gold is in danger. Could it fall?Gold started to fall slowly after the Asian market opened on Thursday, and continued to fluctuate and fall in the European market. The impact of the initial data in the US market fell sharply to around 3310, then stabilized and rose. It reached a high of around 3341 and then maintained a high sideways fluctuation, and the daily line closed with a negative line.
The price trend of gold this week was erratic. On Wednesday, it rose and fell, closing with a positive line, indicating that there was strong resistance above; on Thursday, it fell and rebounded, closing with a negative line, indicating that there was some support below. The current moving average system is chaotic, which further confirms that the overall situation is in a wide range of fluctuations.
Connecting the highs and lows of this week can form a fluctuating downward channel, which still has an important guiding role in the market. The current channel resistance is at 3345. If the gold price can break through this resistance level, it is expected to open up further upward space; and the channel support is around 3320. Once it falls below, it may trigger a new round of decline.
Overall, the upward resistance levels of gold are 3345, 3350, and 3360; the downward support levels are around 3320 and 3310. Operation strategy:
Short around 3350, stop loss at 3360, profit range 3330-3310.
Long near 3315, stop loss 3305, profit range 3330-3350.
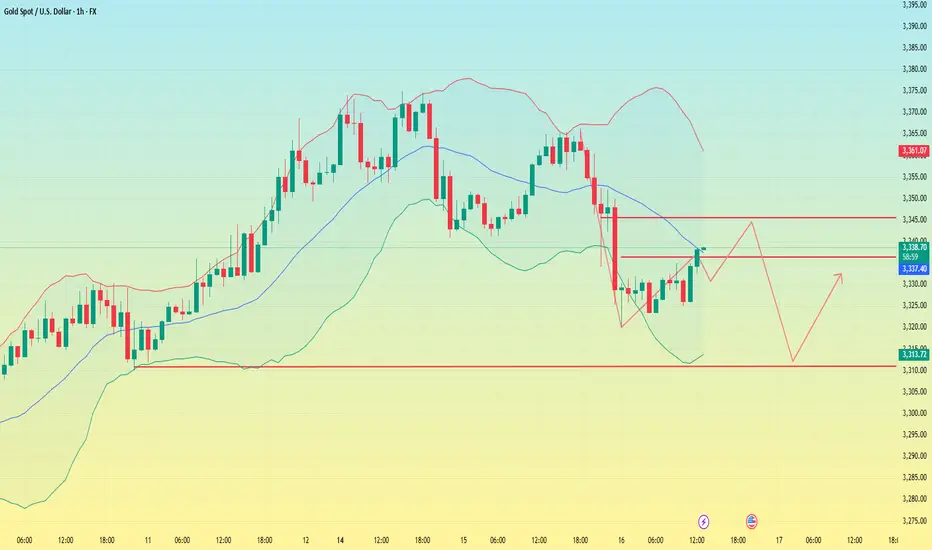
Gold’s Last Stand? Major Retest at 3310–3300 Under the influence of negative news, gold today fell below the recent low of 3320 and continued to fall to around 3310. The current gold structure looks particularly obvious, the center of gravity of gold gradually moves downward, and the short trend is extremely obvious; however, as gold repeatedly probes the 3320-3310 area, we can clearly see the resistance of gold to falling, and multiple structural supports are concentrated in the 3320-3300 area. So as long as gold does not fall below this area, gold bulls still have the potential to rebound.
However, for now, after experiencing discontinuous sharp rises and falls, gold needs to undergo a short-term technical repair, so it may be difficult for a unilateral trend to appear in the short term. So I have reason to believe that gold will focus on rectification and repair next. The important resistance area we have to pay attention to above is in the 3340-3350 area; and the important support below is in the 3310-3300 area.
Currently, gold is fluctuating in a narrow range around 3340, and the short-term rebound momentum is sufficient, but I still believe that gold will fall back again and test the support of 3320-3300 area after consuming the bullish energy. So for short-term trading, first of all, I advocate shorting gold in the 3340-3350 area, and expect gold to retreat to the 3320-3300 area during the consolidation process.
3340-3300: Lock in the buy high and sell low in this area!Under the influence of unemployment benefits and zero monthly sales data, gold fell sharply in the short term, but it did not effectively fall below 3310 during multiple tests, effectively curbing the further downward space of the shorts. Multiple structural supports are also concentrated in the 3310-3300 area, so as long as gold does not fall below this area, gold bulls still have the potential to rebound.
However, for the current gold market, it may be difficult to see a unilateral trend in the short term. After experiencing discontinuous surges and plunges, gold may focus on consolidation and repair, and the consolidation range may be limited to the 3340-3300 area.
So for short-term trading, first of all, I advocate going long on gold in the 3320-3310 area, and expect gold to rebound and reach the 3330-3340 area;
If gold reaches the 3335-3345 area as expected, we can start to consider shorting gold, and expect gold to step back to the 3320-3310 area during the shock and rectification process.
Elliott Wave Analysis – XAUUSD July 16, 2025🔄 Momentum Analysis
D1 timeframe: Momentum is currently reversing to the downside, suggesting that the price may continue to decline or move sideways in the short term.
H4 timeframe: Momentum is rising, indicating that the current recovery may continue. The next resistance zones to watch are 3342 and 3358.
🌀 Elliott Wave Structure
At present, price action is being compressed within a contracting triangle corrective pattern, with its range narrowing further—signaling market consolidation. We should closely monitor for signs of a breakout that could end this correction.
Based on the current wave structure, it is expected that wave d (green) has completed, and the current downward move is likely part of wave e (green).
The trading strategy focuses on waiting for the price to approach the lower boundary of the triangle—drawn from the low of wave a to the low of wave c—looking for confluent support areas near this trendline to identify a potential BUY opportunity.
🎯 Target & Trade Plan
BUY ZONE: 3303 – 3300
Stop Loss (SL): 3290
Take Profits (TP):
- TP1: 3327
- TP2: 3358
- TP3: 3402
Gold fluctuates downward. Can it break through?The CPI data released is in line with expectations, the tariff storm is still continuing, inflation rebounds and the Fed's expectations of interest rate cuts have cooled. Gold rebounded to 3366 and then fell, and is currently fluctuating around 3330.
From the current trend, gold fell strongly and broke through the Bollinger middle rail and the moving average support. The daily line focuses on the Bollinger middle rail under pressure near 3340, and the short-term support is at 3310. At present, a staged top pattern has been formed and the K-line double top is around 3366. The Bollinger moves downward and the price is in a downward channel.
For short-term operations, Quaid believes that the strategy of rebound shorting can still be followed.
Short near 3345, stop loss 3355, profit range 3330-3310
Long near 3310, stop loss 3300, profit range 3330-3345
7/16: Will Gold Reclaim 3350 or Fall to 3250?During today’s session, gold briefly broke through the 3352–3358 resistance zone, but due to news-driven pressure during the pullback, bullish momentum weakened, and the price retreated to the MA60 support level on the daily chart.
Given the significant retracement, there is a possibility that a short-term bottom may form during the upcoming Asian session, potentially leading to a retest of the 3337-3343/3352-3358 resistance area:
If the price breaks above this zone and holds above it after a pullback, the bullish trend could resume;
However, if it fails to break through or is rejected again, caution is warranted, as this could signal a larger-scale downtrend on the weekly chart, possibly targeting the 3250 area.
Elliott Wave Analysis – XAUUSD | July 14, 2025
🔍 Momentum Analysis
D1 Timeframe: Momentum is currently reversing to the upside, indicating that the bullish trend may continue into early next week (Monday).
H4 Timeframe: Momentum has entered the overbought zone, suggesting that a short-term correction is likely to bring momentum back down into oversold territory.
🌀 Elliott Wave Structure
On the H4 chart, we observe a contracting triangle pattern (abcde) approaching its final stages.
In the Friday trading plan, we anticipated that the corrective phase had ended and price was entering a new impulsive wave. However, there are two irregularities worth noting:
A pin bar candle with high volume has appeared at the resistance zone near 3365, while H4 momentum is overbought. This signals a likely short-term correction — something that ideally should not happen if price is already in wave 3. Ideally, price should have surged to 3402 on Friday to strengthen the bullish case.
On the H1 chart, bullish candles are small and overlapping, reflecting weak bullish momentum and a lack of conviction from buyers.
These two signs suggest that the market may still be within the correction phase, and the 3402 level will serve as a key confirmation zone to determine whether the correction has truly ended.
💡 Trading Outlook
The bullish momentum on the D1 chart still supports BUY positions for the coming week.
However, since the H4 chart is overbought, a short-term pullback is likely.
We will look to buy on dips toward lower support zones, targeting a move toward 3393 – 3402, which remains the target area as outlined in Friday’s plan with the original entry at 3332 – 3330.
📊 Trading Plan
BUY Zone: 3342 – 3340
Stop Loss (SL): 3330
Take Profit 1 (TP1): 3370
Take Profit 2 (TP2): 3393
Elliott Wave Analysis – XAUUSD | July 15, 2025🟢 Trade Update
The BUY order at the 3342 – 3340 zone was triggered at 3341. As of now, price has moved up by 140 pips, and the market is still following the planned scenario from the previous analysis.
📊 Momentum Analysis
D1 Timeframe: Momentum is in the overbought zone, and indicator lines are showing signs of crossing — a warning signal of a potential reversal on the daily chart.
H4 Timeframe: After a 6-candle decline from 3377 to 3342, H4 momentum has reversed upward. With 2 bullish candles already formed, we expect another 3–5 bullish candles, aiming toward the 3390 zone.
🌀 Elliott Wave Update
Price action is currently moving toward the end of the abcde contracting triangle. We are monitoring two potential scenarios:
Scenario 1 – Ongoing Triangle Correction
If price returns to the lower boundary of the triangle, it is likely forming wave e, which would present a buy opportunity for the final leg of the triangle.
Scenario 2 – 5-Wave Impulse Extension
The current structure shows a 5-wave impulsive move, with wave 4 completed and wave 5 now beginning.
The projected target for wave 5 aligns with the resistance zone at 3398 – 3402.
After completing wave 5, the market could enter a corrective phase, consistent with the idea that wave d ends at this resistance.
🔔 If the price breaks above 3402, it would likely confirm that the abcde correction is complete and that a new impulsive bullish wave has started.
🎯 Trade Plan
📍SELL Zone: 3396 – 3398
⛔️ Stop Loss: 3406
🎯 TP1: 3376
🎯 TP2: 3327
📍BUY Zone: 3295 – 3293
⛔️ Stop Loss: 3285
🎯 TP1: 3327
🎯 TP2: 3365
🎯 TP3: 3402
✅ Note: Prioritize entries only after confirmation from price action and momentum at key levels.
