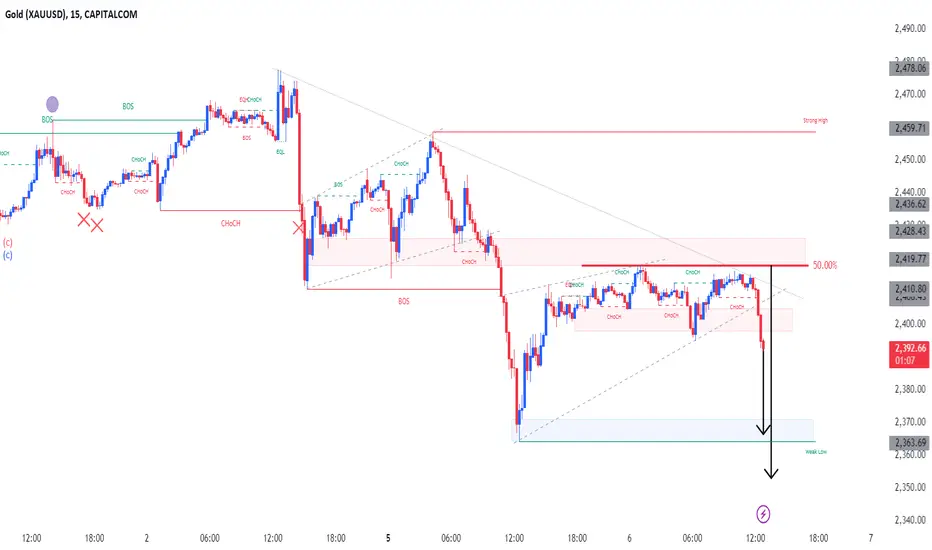
XAUUSD 26/8/2024 Will the uptrend continue?
Last week we saw a special increase on Friday.
- This increase confirmed the completion of the ABC correction wave and the price continued to increase.
- Looking at the current uptrend, we see a structure of short candles with weak momentum. So this could be a big wave 1 in the uptrend structure. Looking at the bullish wave structure, we see that there are 5 black waves
- Currently, I am leaning towards the black ABC correction structure
- Looking at the chart, we see that the black wave A has been completed and the price is currently completing the black wave B
- The target for completing the black wave C is I predict at the price range of 2500 - 2497 or the price range of 2489 - 2486, this will be my BUY target
- Above, we see that there is still a very strong supply zone at the price range of 2531 - 2534, this is the old peak, so if the price wants to surpass the old peak, it needs to absorb all of this supply. So I will set the SELL target down here
Trading plan:
SELL ZONE: 2531 - 2534
SL: 2541
TP1: 2519
TP2: 2509
TP3: 2500
BUY ZONE: 2500 - 2407
SL: 2400
TP1: 2509
TP2: 2519
TP3: 2530
BUY ZONE: 2489 - 2486
SL: 2479
TP1: 2499
TP2: 2509
Tp3: 2530
Xauusdwave

XAUUSD 23/8 has the uptrend started?
Looking at H1 we see
- Yesterday we saw a sharp decline after the PMI news, the price reached our BUY Entry, up to now we have a 190 pips victory, congratulations to all of us.
- Now looking at the uptrend we see a 3-wave structure, on the other hand we see that yesterday's downtrend has the characteristic of sharp and fast movement, so we expect wave 3 to have formed and currently the price is correcting wave 4.
- With the target of wave 4 I measured, wave 4 has reached the price target and now we are waiting for wave 5 to complete.
- Wave 5 is confirmed when the price breaks through 2470.7 and the target is measured at the price zone of 2460 - 2457
- Because the price zone of 2470 is also the target price zone of wave 5 that we measured from the previous day's plan, we cannot rule out the possibility that the downtrend structure has been completed and it is confirmed if the price does not break through the 2470 zone. Then the price will continue the uptrend.
Our trading plan will aim to BUY when the price breaks through 2470
BUY ZONE: 24600 - 2457
SL: 2450
TP1: 2470
TP2: 2486
TP3: 2498
SELL ZONE: 2499 - 2502
SL: 2509
TP1: 2486
TP2: 2479
TP3: 2470
SELL ZONE: 2531 - 2534
SL: 2541
TP1: 2519
TP2: 2501
TP3: 2486

XAUUSDPair : XAUUSD ( Gold / U.S Dollar )
Description :
Break of Structure and Retracement
Completed " 12345 " Impulsive Waves
Bearish Channel as an Corrective Pattern in Short Time Frame
RSI - Divergence
Fibonacci Level - 38.20%

XAUUSD 8/21/2024 has the price peaked?
Looking at H1, we see that yesterday the Gold price peaked at 2532, which is a new ATH, then the price dropped sharply to the 2501 area, so it is very likely that the price has completed the 5-wave structure 1 2 3 4 5 and now the price is entering the 3-wave ABC correction structure.
- The sharp drop to the 2501 area means that wave A is likely to have completed and so the price is in wave B
- Our expectation is that the end zones of wave B are at 2521 - 2524. And the end target of wave C is at the price zones 2487 - 2484 and the price zone 2476 - 2473. These are our trading target price zones.
Trading Plan
SELL ZONE: 2521 - 2524
SL: 2531
TP1: 2509
TP2: 2499
TP3: 2487
SELL ZONE: 2531 - 2534
SL: 2541
TP1: 2519
TP2: 2509
TP3: 2499
BUY ZONE: 2487 - 2484
SL: 2477
TP1: 2499
TP2: 2509
TP3: 2519
BUY ZONE: 2476 - 2473
SL: 2466
TP1: 2484
TP2: 2499
TP3: 2509

XAUUSD GoldPair : XAUUSD ( Gold / U.S Dollar )
Description :
Bullish Channel as an Corrective Pattern in Short Time Frame
RSI - Divergence
Fibonacci Level - 361.8%
Completed " 12345 " Impulsive Waves
Break of Structure

XAUUSD GoldPair : XAUUSD ( Gold / U.S Dollar )
Description :
Fibonacci Level - 261.8%
Completed " 12345 " Impulsive Waves
Break of Structure
RSI - Divergence
Bullish Channel as an Corrective Pattern in Short Time Frame

XAUUSD 19/8/2024 price has created ATH?Last weekend we had a strong increase on Friday that broke the old peak to create a new ATH.
This increase has caused the RSI indicator to enter the overbought zone. In my experience, when the price moves quickly and sharply while looking at the RSI entering the oversold zone, this is a sign of wave 3.
- Currently we see the price falling to the 2500 zone, so we expect an ABC downtrend structure of wave 4.
- I measured the wave 4 target at the 2485 - 2483 zone, after reaching the wave 4 target, we expect a wave 5 increase to complete the 5-wave uptrend structure.
- I measured the wave 5 target at 2517 - 2520 and 2531- 2534 zones, these are the 2 target zones I expect to SELL down.
Trading Plan
BUY ZONE: 2467 - 2463
SL: 2457
TP1: 2493
TP2: 2500
TP3: 2517
BUY ZONE: 2485 - 2482
SL: 2475
TP1: 2500
TP2: 2509
TP3: 2517
SELL ZONE: 2517 2520
SL: 2527
TP1: 2506
TP2: 2500
TP3: 2484
SELL ZONE: 2531 - 2534
SL: 2541
TP1: 2519
TP2: 2500
TP3: 2484

XAUUSD 16/8/2024 Has the Uptrend Started?
Yesterday after the PPI news, we saw a strong shakeout and the price came close to the 2nd BUY target zone that I had given and then bounced strongly. But I did not expect such a strong downtrend, so the price zone of 2445 - 2442 did not set a BUY order.
Today I expect a correction wave to the 2447 - 2444 zone to complete wave 2 in red and then continue the uptrend according to wave 3.
During the price increase according to wave 3, we pay attention to large supply zones such as the 2476 zone, the 2484 zone and the 2500 zone, these are the zones I choose as targets to SELL down
Trading plan
BUY ZONE: 2447 - 2444
SL: 2437
TP1: 2458
TP2: 2468
TP3: 2476
SELL ZONE: 2484 - 2487
SL: 2494
TP1: 2476
TP2: 2468
TP3: 2458
SELL ZONE: 2497 - 2500
SL: 2507
TP1: 2484
TP2: 2476
TP3: 2468

XAUUSD 15/8/2024 Has the uptrend started?
Yesterday's CPI news showed a sharp increase in price when it was announced and then a sharp decrease. This is a move to shake off the sellers so that the price can complete wave C.
- The sharp decrease in wave C is still, in my opinion, the final shakeout before the price starts to increase to complete wave 5
I predict that this week the price will likely create a new ATH followed by a further correction.
- The wave 4 target I set yesterday has been completed at the price range of 2442 to 2445. With a Buy order at this price range, we have a profit of 100 pips. You can close a part of it and raise the SL to Entry. I have a backup target at 2430 - 2427 we will look at this target if price breaks out 2439
- I see a big supply zone at 2468 - 2471 so I will set a Sell scalp target at this zone
- Our main Sell target is the end of wave 5 now I am targeting the first wave 5 target which is 2500.
Trading Plan
BUY ZONE: 2430 -2427
SL: 2420
TP1: 2439
TP2: 2458
TP3: 2476
SELL ZONE: 2468 - 2471
SL: 2478
TP1: 2458
TP2: 2452
TP3: 2444
SELL ZONE: 2497 - 2500
SL: 2597
TP1: 2484
TP2: 2476
TP3: 2458

#XAUUSD/H4 Model 2 peaks appear, gold's correction rhythmAnalysis of the gold trend in the Asia-Europe session on 14/08/2024:
After forming a double bottom pattern at 2380, gold experienced a nearly 100-point increase. Yesterday, the PPI did not help gold break through the resistance zone of 2473-2475. If gold breaks the area of 2458-2460, it will officially confirm the double top pattern.
However, today's CPI is still a mystery. Is this a correction phase or just a fake breakout? The long-term trend remains a BUY, but short-term SELL trades can be made at the peak area.
Key price levels to watch: 2473-2475, 2444-2447, and 2430-2434.
Recommended orders:
Plan 1: SELL XAUUSD zone 2473 - 2475
SL 2479
TP 2468 - 2458 - 2445.
Plan 2: BUY XAUUSD zone 2444-2447
SL 2441
TP 2455 - 2468 - 2485 - 2509.
Plan 3: BUY XAUUSD zone 2430-2433
SL 2427
TP 2444 - 2458 - 2468 - 2509.

XAUUSD GoldPair : XAUUSD ( Gold / U.S Dollar )
Description :
Symmetrical as an Corrective Pattern in Long Time Frame and Rejection from Upper Trend Line
Break of Structure
RSI - Divergence
Completed " 1234 " Impulsive Waves
Triple Top

XAUUSD 13/8/2024 Has the Downtrend Started?
Yesterday was an unusual bullish day, although we had profit with sell orders, the price increased to the 2476 area, which gave us an extended yellow wave 5, which also means that the black wave 3 has been completed
- Currently the price is in the 4th wave correction, we expect a yellow ABC correction and this is an opportunity for us to trade in the direction of wave 5.
- Trading plan
BUY ZONE: 2442 - 2439
SL: 2432
TP1: 2450
TP2: 2458
TP3: 2469
BUYZONE: 2435 - 2432
SL: 2425
TP1: 2440
TP2: 2450
TP3: 2458
SELL ZONE: 2470 - 2473
SL: 2480
TP1: 2458
TP2: 2450
TP3: 2442
SELL ZONE: 2492 - 2495
SL: 2502
TP1: 2476
TP2: 2469
TP3: 2458

XAUUSD 12/8/2024 Is the bullish wave over?Looking at H1, we see that the 5-wave bullish structure is completing.
Wave 4 has now completed and the price is continuing to complete wave 5
- Measuring the target of wave 5, we have 2 targets to pay attention to, the first is the 2435 zone and the second is the 2455 zone
- Currently, the price has reached the target zone of 2435. Looking at the momentum indicator, we see that the price is preparing to reverse at the oversold zone, so we wait for the price to recover. There will be 2 cases
- Case 1: The price does not break through the 2435 zone, so we will enter a Sell order in this area
- Case 2: The price breaks through 2435, so the next target will be the 2455 zone
Personally, I am leaning towards the 2455 price zone, which will be the price zone where I set the SELL target
Trading plan:
BUY ZONE: 2422 - 2419
SL: 2402
TP1: 2435
TP2: 2440
TP3: 2447
SELL ZONE: 2455 - 2458
SL: 2465
TP1: 2447
TP2: 2435
TP3: 2428

Where will XAUUSD want to go !!!Dear All
This is a very BIG picture of XAUUSD price moving as you see in yearly basis that is in impulse wave 3 of bull-run standard Elliot wave; I think we are in the middle of this big big bull-run move and we should fasten our seat belts for next minimum 3K moving up price which will happen maybe in a decade.

XAUUSD up to new year 2025Dear All my friends
As I told you the big picture of XAUUSD Elliot waves, we will going to touch our targets and the first step until Jan 2025 is showing in this analysis.

XAUUSD 9/8/2024 Is the Uptrend Over?
Yesterday we saw a significant rally that confirmed my bullish view from yesterday.
- We see the price has broken above the 2406 zone so this price action has confirmed that the black wave 1 and 2 have formed and the price is currently in wave 3
- The characteristic of wave 3 is to move quickly and sharply, the target of wave 3 we measure will be in the 2428 zone or the 2453 zone, looking at the current price I am expecting the target of wave 3 to end in the 2428 zone
- And then there is a correction of wave 4 and continuing wave 5 the price bounces to the 2453 zone
Our trading plan will trade according to wave 5
BUY ZONE: 2412 - 2409
SL: 2402
TP1: 2428
TP2: 2442
TP3: 2450
SELL ZONE: 2450 - 2453
SL: 2463
TP1: 2442
TP2: 2428
TP3: 2406

XAUUSDPair : XAUUSD ( Gold / U.S Dollar )
Description :
Symmetrical Triangle as an Corrective Pattern in Short Time Frame
CHoCH
Break of Structure
Completed " 1234 " Impulsive Waves
Impulse Correction

XAUUSD 8/8/2024 Is this decline over?
Looking at H1, we see that after yesterday's decline to the 2380 price zone, the price has recovered to the 2396 zone.
- Yesterday's decline, we wanted to see the price stop at the 2389 zone to confirm that wave 2 had ended and started wave 3, but in fact, the price has dropped deeply to 2380. Although the previous wave counting process has not been denied, the price's deep drop to 2380 has given us a complex correction model of wave 2 in black, so we still bet that the uptrend is the current main trend.
- Today, the price has recovered to the 2396 zone, suggesting to us a triangle correction model abcde. Obviously, I will not make a subjective conclusion because with a complex correction model, we have to patiently wait for the complete model to have the exact direction of the price.
- Current Trading Plan
BUY ZONE: 2374 - 2371
SL: 2364
TP1: 2381
TP2: 2400
TP3: 2412
SELL ZONE: 2415 - 2418
SL: 2425
TP1: 2406
TP2: 2495
TP3: 2389
SELL ZONE: 2425 - 2428
SL: 2435
TP1: 2418
TP2: 2406
TP3: 2495

XAUUSD 7/8/2024 Will the downtrend continue?
Looking at H1, we see that we have achieved the target of wave 2 in yesterday's plan.
Now we expect wave 3 to continue. The characteristic of wave 3 is a strong and sharp increase. Therefore, we expect a strong increase
- Wave 3 is confirmed when the price breaks through the 2418 zone, then we will have a wave 3 target at the 2467 zone
- Currently, we are in a very good buy price range, the target zone I gave in yesterday's plan
I have a backup buy plan at 2374 - 2371
Our target is the wave 3 increase, so buying up is the main thing, and the sell orders are just to catch the corrective down waves
Trading plan
BUY ZONE: 2374 - 2371
SL: 2364
TP1: 2403
TP2: 2413
TP3: 2428
SELL Scalp ZONE: 2312 - 2315
SL: 2322
TP1: 2408
TP2: 2403
TP3: 2498 SELL Scalp ZONE: 2424 - 2427 SL: 2432 TP1: 2417 TP2: 2409 TP3: 2403

XAUUSD Gold 06/08Pair : XAUUSD ( Gold / U.S Dollar )
Description :
Completed " 12345 " Impulsive Waves and " ABC " Corrective Waves
Break of Structure
RSI - Divergence
Fibonacci Level - 50.00%
Rising Wedge as an Corrective Pattern in Short Time Frame
XAUUSD 6/8/2024 Is this rally over?
This past week we have seen a lot of volatile news that has affected the direction of gold prices
With the unstable geopolitical situation causing large fluctuations in gold prices
- Looking at H1 we see a completed ABC corrective wave structure. Following an ABC corrective structure we expect a 5 wave bullish structure. Obviously not excluding the possibility of a complex correction wave then I will update if it happens
- Currently we expect a bearish correction to confirm wave 1 and wave 2 completed and wave 1 and 2 confirmed when price closes above 2365.6
- This current correction we expect a yellow abc wave pattern and target at 2385 price zone or 2377anh price zone
Trading plan
BUY ZONE: 2385 - 2382
SL 2363
TP1: 2393
TP2: 2404
TP3: 2418
SELL ZONE: 2421 - 2424
SL: 2447
TP1: 2408
TP2: 2396
TP3: 2385

According To Elliot Wave Gold Must Drop Until 2360According To Elliot Wave Gold Must Drop Until 2360
As I Simply Calculated Gold Must Drop To 2360 Zone To Complete 5th Wave.
And Gold Is Falling From Ending Diagonal. And Also As My Previous Elliot Wave Long Turn Analyze
Gold Must Fall To 2170 At least
Watch This : -

XAUUSD 5/8/2024 correction is over?
Looking at H1 we see the ABC correction wave structure.
Looking at the ABC correction model, we see that we are likely to have an unusual correction model, when wave C does not exceed wave A.
- So now we need to observe to confirm whether the correction wave has ended
- The confirmation condition is that if this downtrend closes above the 2413 zone, then we have the price entering the uptrend wave and then the target price zone is the 2500 zone.
Currently we have a trading plan
SELL ZONE 2456 - 2459
SL 2466
TP1: 2447
TP2: 2442
TP3: 2433
BUY ZONE: 2426 - 2423
SL: 2416
TP1: 2433
TP2: 2442
TP3: 2455
