Elliott Wave Analysis – XAUUSD July 11, 2025
🔍 Momentum:
D1 timeframe: Momentum is currently rising, suggesting that the bullish trend is likely to continue for the next few days.
H4 timeframe: Momentum is also bullish, indicating that the uptrend is likely to dominate today.
🌀 Elliott Wave Pattern:
On the H4 chart, price action is in the final stage of a contracting triangle correction.
Price is now approaching the upper boundary of the triangle. With both D1 and H4 momentum in alignment, the probability of a breakout to the upside is high.
If this breakout occurs, we can expect a move toward the 3393 area, which is a key level to confirm whether the corrective phase has truly ended.
🎯 Price Targets:
Current area (3330–3332): A potential opportunity for a scalp BUY, supported by bullish momentum on H4.
Next support zone: 3315–3317 – a solid area for a mid-term BUY entry if there’s a pullback.
⚠️ If price breaks below 3279, the current wave count becomes invalid and a new analysis will be provided.
✅ Trade Plan:
🔹 SCALP BUY
Entry: 3332 – 3330
SL: 3327
TP1: 3363
TP2: 3390
🔹 MID-TERM BUY ZONE
Entry: 3317 – 3315
SL: 3307
TP1: 3342
TP2: 3363
TP3: 3390
Xauusdwave

Elliott Wave Analysis – XAUUSD July 10, 2025
🌀 Elliott Wave Structure
On the H4 timeframe, price has returned to test the upper boundary of the converging triangle – currently acting as dynamic resistance. Based on the current wave count, wave e (purple) may have completed at the 3279 low, and price is potentially starting a breakout move.
👉 A confirmed breakout above the triangle would validate the end of the abcde correction and mark the beginning of a new upward trend.
🔋 Momentum Analysis
D1 timeframe: As forecasted yesterday, momentum is entering oversold territory and showing early signs of a reversal. This suggests that an upward trend could dominate over the next 5 days.
H4 timeframe: The two momentum lines are sticking together, indicating a weakening upward drive. A minor pullback may be needed before the next leg up. Key nearby resistance levels to watch are 3330 and 3342.
🎯 Key Price Levels & Validation Zones
The following support zones are crucial for identifying potential entries:
Support Zone 1: 3306 – 3308
Support Zone 2: 3294 – 3297
‼️ Important: A break below 3294 would invalidate the current wave structure, and a new count would be required.
📌 Trade Plan
Scenario 1 – Buy at higher support:
Buy Zone: 3308 – 3306
SL: 3303
TP1: 3342
TP2: 3366
TP3: 3390
Scenario 2 – Buy at deeper support (if stronger correction occurs):
Buy Zone: 3297 – 3294
SL: 3287
TP1: 3342
TP2: 3366
TP3: 3390
Scenario 3 – Safer option (breakout confirmation):
Wait for a breakout above the triangle, then enter on the retest (around 3325–3330)
SL: Based on structure formed during the retest
TP range: 3366 – 3390
📌 Preferred strategy: Wait for H4 to reach oversold or wait for a confirmed breakout and retest to enter safely in alignment with the new uptrend.

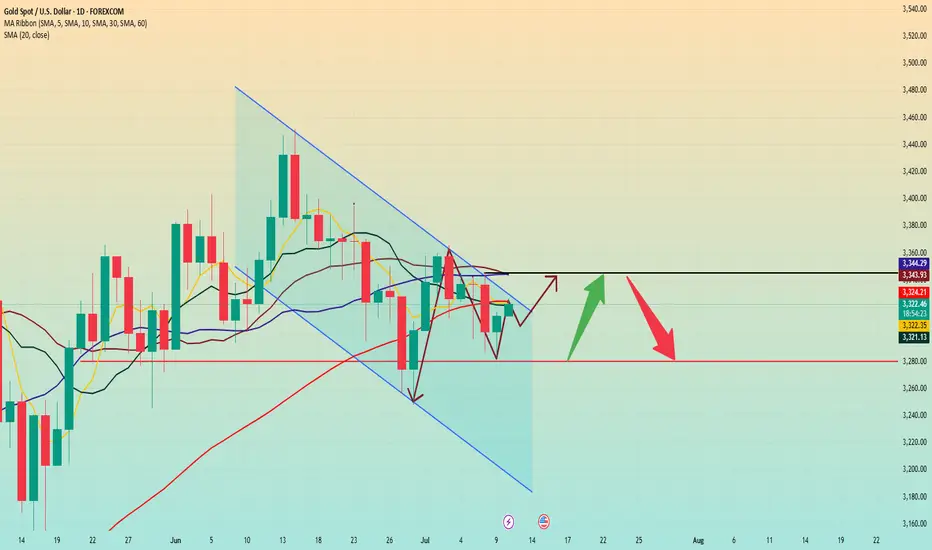
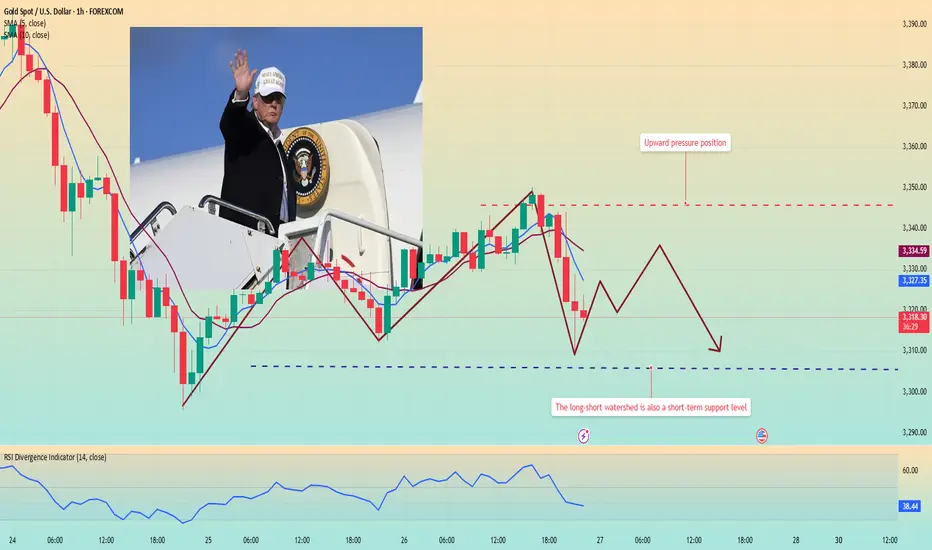
Gold rose. Trend reversed.Gold rose slightly in early Asian trading on Wednesday, but fell under pressure near 3308. It fluctuated in the European trading range of 3296-3282. It broke through the US trading range and rose to around 3317 in the late trading. The daily line closed with a positive line with a lower shadow.
After a sharp drop on Tuesday, gold showed a downward recovery trend on Wednesday and closed positive. It rose slightly in early Asian trading today. From the daily level, in the short term, we should first pay attention to the resistance near 3325-3330. This area brings together the current positions of the 5-day moving average, the 10-day moving average and the 60-day moving average, which is an important gateway for the game between long and short forces in the short term. If the gold price continues to be under pressure in this area, it means that the short-term upward momentum is insufficient, and we need to be alert to the risk of a market decline.
If the above resistance area can be broken and the price continues to rise strongly, the next target will be the resistance near 3345, which is not only the high point on Tuesday, but also the current location of the 20-day moving average and the 30-day moving average, which has a strong technical resistance significance.
In terms of support below, first pay attention to the support near 3280, which is the current support level of the trend line formed by the low points of May 15 and June 30, which provides certain support for the gold price.
Operation strategy:
Short at price rebound near 3345, stop loss at 3355, profit range 3320-3300
Long at price drop near 3315, stop loss at 3305, profit range 3320-3340
Elliott Wave Analysis – XAUUSD July 9, 2025
🔻 Momentum Analysis
D1 timeframe: Momentum is approaching the oversold zone and may reverse upwards today or tomorrow.
H4 timeframe: Momentum is already in the oversold zone. The two momentum lines are converging, signaling weakening downward pressure and a potential reversal.
🌀 Elliott Wave Structure
The price level around 3318 (previous buy zone) failed to hold, despite a ~100-pip bounce before continuing to decline.
Currently, price is nearing the lower boundary of a contracting triangle – a typical abcde corrective pattern.
Based on the current wave structure:
- Wave d (purple) appears to be complete.
- Price is now likely forming wave e, expected to end near 3279, which coincides with the triangle’s bottom support.
If the pattern holds, a strong breakout above the upper triangle boundary is expected once wave e completes.
However, note: the formation of a triangle during a corrective wave often signals that the uptrend is nearing its end in the longer term.
📌 Trading Plan
Given the complex 3-wave structure typical of triangles, risk is elevated, so:
Trade with reduced position size, or
Preferably wait for a confirmed breakout above the triangle before entering.
Suggested Trade Setup:
✅ Buy Zone: 3280 – 3277
❌ Stop Loss: 3270
🎯 Take Profits:
TP1: 3309
TP2: 3342
TP3: 3390

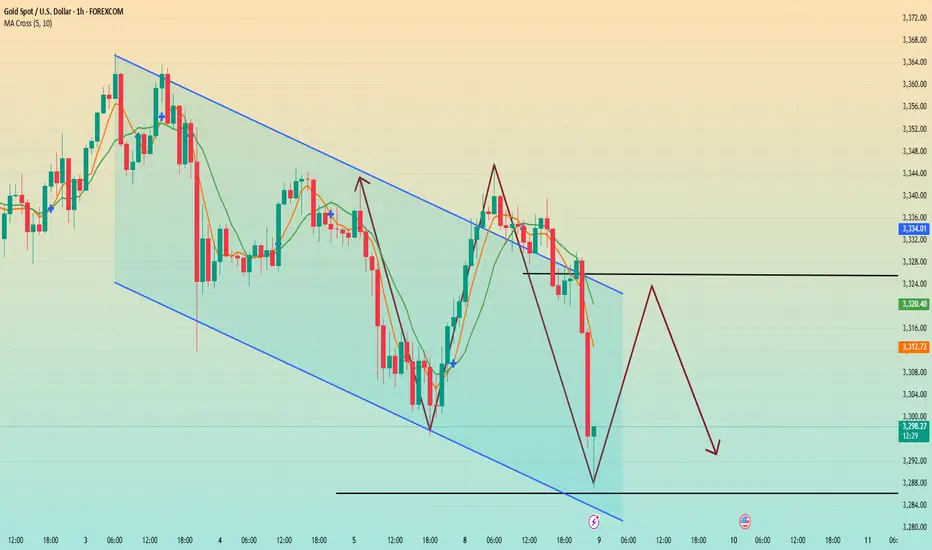
Gold is going down without any signs. Will it continue?Yesterday's seemingly strong rise in gold's safe-haven market may make people mistakenly think that gold is going to rise sharply, but the recent safe-haven market has poor sustainability and poor upward momentum, and cannot maintain the continuation of the upward trend.
Looking at gold in 1 hour, after the price surged, it continued to fall under pressure at 3345. 3345 is also the recent key position for long and short positions. The 1-hour moving average of gold is still in a short position and continues to diverge downward. The short-term short momentum of gold still exists. I think the price will still fall after the rebound. Gold started to fall directly at 3330, and 3330 formed a strong resistance for gold in the short term. The downward low point did not continue after touching 3288. The current price rebounded and fluctuated around 3295. So we can sell high and buy low around 3385-3325.
Elliott Wave Analysis – XAUUSD – July 8, 2025🔎 Momentum Analysis
On the daily (D1) timeframe, momentum is currently declining. At the same time, the 4H momentum is showing signs of reversing downward. This suggests a likely short-term corrective decline, which provides a basis for projecting potential Elliott Wave patterns.
🌀 Elliott Wave Structure
On the 4H chart, I currently see two main possible scenarios:
Scenario 1: Contracting Triangle Correction (abcde – purple)
This scenario assumes a contracting triangle correction labeled abcde in purple.
The market appears to be in wave d (purple), which is unfolding as a wxy corrective structure. Currently, it is likely in wave y.
The projected target for the end of wave y is between 3393 – 3402.
However, due to the declining momentum, I expect a short-term pullback to the 3318 – 3321 region before price resumes upward to complete wave d.
Scenario 2: Larger WXY Correction
In this case:
Wave W has completed as a standard 3-wave abc.
Wave X has also completed as a double zigzag.
Wave Y appears to be forming a small contracting triangle abcde in red.
Currently, the price is being compressed between the upper and lower boundaries of the red triangle, suggesting that it is in the final wave e.
In this scenario, the projected retracement also aligns with the 3318 – 3321 zone. After completing wave e, price is expected to break out strongly above the upper boundary of the red triangle.
✅ Strategic Conclusion
Both scenarios point to a confluence zone at 3318 – 3321, making this a key potential buying area. Two trading approaches can be considered:
Aggressive Entry: Buy within the 3318 – 3321 range.
Conservative Entry: Wait for a confirmed breakout above the red triangle before entering a long position.
📈 Suggested Trade Plan
Buy Zone: 3318 – 3321
Stop Loss: 3308
Take Profit 1: 3342
Take Profit 2: 3362
Take Profit 3: 3393

Gold fluctuates downward. Do not short blindly.Today, gold is in a consolidation downward trend, with the lowest point reaching around 3296; it has rebounded slightly to around 3310. From the overall market, gold is indeed in a short trend. However, do not continue to short, which is very dangerous.
Because from the hourly chart, although the low point of gold is constantly refreshing, the key hourly chart support range position has not yet broken.
So, here I may think that gold may still be tempting to short in the short term. There is still a possibility of a pullback here on the hourly chart. From the current point of view, there is still a probability of a pullback to 3320-30 before the range is broken. In terms of the next operation, I suggest that you can pay attention to 3320-30.
However, if it really pulls up again, as long as it does not stand above 3330 again. Then, we can short here at 3320-30. On the contrary, if the rebound directly breaks above 3340, then be careful. The rebound may turn into a trend reversal, and it is very likely to replicate the rhythm at the beginning of last week.

Elliott Wave Analysis – XAUUSD – June 8, 2025🌀 Elliott Wave Structure Timeframe: H4
Currently, price action is overlapping with multiple abc correction patterns. To reduce noise and gain a clearer perspective, I’ve shifted the analysis to the H4 timeframe.
From the 3500 level down to now, the entire corrective move has been composed of overlapping abc patterns rather than sharp, impulsive rallies. This suggests we are likely forming a contracting triangle correction in the form of abcde (green) as shown on the chart.
At the moment, price appears to be in wave d (green), which is unfolding as a wxy structure (red).
Trading during triangle corrections is particularly challenging due to the complex interweaving of corrective waves. Additionally, price is consolidating within the Volume Profile’s high-liquidity zone, as shown on the chart. Therefore, it is best to remain patient and wait for the triangle pattern to complete.
📉 Momentum
Daily (D1) momentum: Currently showing signs of a bearish reversal → suggesting that price may move sideways or lower this week. (Toward the end of a triangle, price tends to compress and lose clear directional bias.)
H4 momentum: Also shows reversal signals, and a strong bearish candle has recently formed. Thus, a short-term bearish bias is preferred until H4 momentum reaches the oversold region.
🎯 Price Targets
Since the market is currently forming overlapping abc structures, setting precise wave targets is difficult. Therefore, I rely on Volume Profile zones to define key levels:
3342 Resistance Zone: Marks the boundary between high and low liquidity areas → This is a Sell Zone, supported by confluence with D1 and H4 momentum signals.
3294 Support Zone: Represents the lower boundary of high liquidity → This is the projected end of wave X (red) and serves as our Buy Zone.
🧭 Trade Plan
🔻 Sell Zone:
Entry: 3340 – 3342
SL: 3350
TP1: 3320
TP2: 3300
🔺 Buy Zone:
Entry: 3295 – 3293
SL: 3285
TP1: 3312
TP2: 3342
TP3: 3390
📌 Personal Note:
At this stage, I prefer to wait for the abcde triangle to complete or for more structural confirmation. If you decide to trade, focus on short-term setups with reduced position size to manage risk during this complex correction phase.

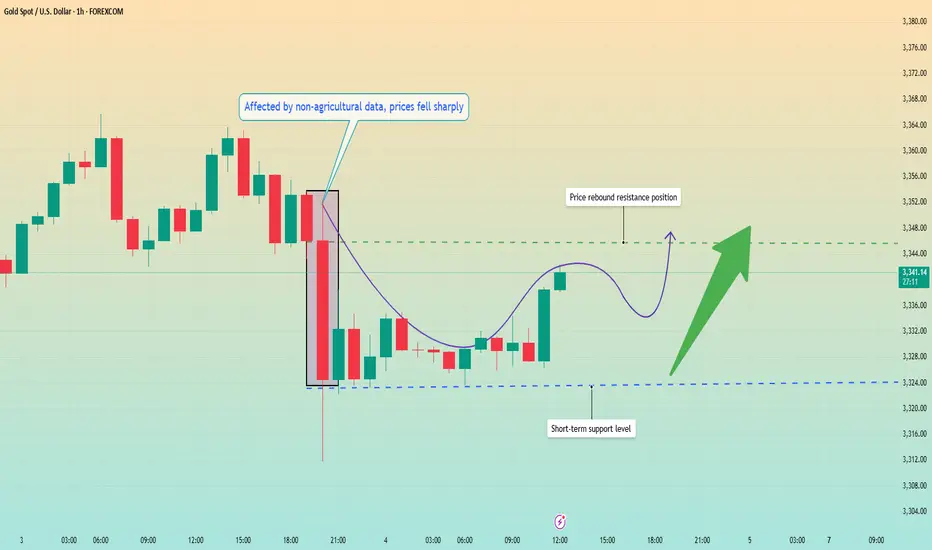
Non-farm data exceeded expectations. Will prices fall temporarilInformation summary:
Affected by the US Independence Day, the June non-farm data was released in advance. This non-farm data surprised the market, far below expectations and previous values, with a significant increase in employment exceeding expectations and previous values, and a sharp drop in unemployment to 4.1%.
The market bet that the July rate cut plan would be directly scrapped. After the employment data was released, the gold price quickly plummeted to $3,312, but the sharp drop in the market had poor continuity and ultimately did not form a unilateral decline.
Market analysis:
Due to the US Independence Day holiday, the US market was closed. In fact, the only thing left for us is the Asian and European markets. And today is the last trading day of this week, and the market is likely to maintain a state of consolidation.
From the 1-hour chart, the price fell after testing the 3,360 high twice. The negative impact of the non-farm data accelerated the decline, and the decline did not continue, and a new support level was formed near 3,323 after the decline. At present, the price is impacting around 3,345, and the bulls are expected to rebound upward and return to the upward trend.
I think the current market continues to rebound, with the lower low of 3323 as the dividing point, and high sell and low buy operations in the consolidation area of 3320-3350.
This is the last trading day of this week. I wish all traders a perfect ending and a perfect weekend.
Revealed: Beware of a strong counterattack from gold bears!Perhaps due to the impact of the NFP market later, gold fluctuated relatively cautiously today, and neither the long nor the short side showed signs of breakthrough, and the overall trend remained volatile. However, as gold rebounded, the market bullish sentiment gradually tended to be optimistic. In the short term, the lower support area was relatively obvious, that is, the second pull-up point 3335-3325 area, followed by 3315-3305 area;
However, as gold rebounded twice and fell after touching 3365, the suppression above was also obvious. In the short term, it faced the suppression of 3375-3385 resistance. If gold cannot effectively break through this area, gold bears may make a stronger counterattack, so I don’t think gold bears have no chance at all.
Therefore, I think there is still a good profit opportunity to try to touch the top and short gold. You can consider trying to short gold in the 3365-3375-3385 area and look at the target: 3340-3330-3320.
Elliott Wave Analysis – XAUUSD, March 7, 2025🌀 Elliott Wave Structure
On the H1 chart, wave 3 appears to have completed, and price is now entering a phase with an unusual structural behavior.
Wave 3 previously showed strong momentum, moving steeply and continuously, with no clear internal pullbacks – a classic impulse wave. Following this, we observed a corrective abc pattern in black, suggesting the end of wave 3.
Interestingly, although yesterday's ADP report was extremely bullish, gold only managed a mild breakout above the wave 3 high before pulling back this morning. Notably, the upward move followed a 3-wave abc structure in green, and price action is now showing overlapping waves with no clear directional momentum.
🧩 These signs suggest a high probability that:
🔹 Wave 5 is forming as an Ending Diagonal – a 5-wave structure with a 3-3-3-3-3 pattern.
🔹 This is typically seen at the end of a bullish cycle and often precedes a sharp reversal.
Although it's too early to confirm, we should patiently observe the upcoming price action. If the ending diagonal completes, it may present a strong sell opportunity.
🎯 Target for wave 5: around 3395, provided all 5 sub-waves within the diagonal complete.
⚠️ If price breaks below 3324, we must consider that the full 5-wave structure is already done, and a new abc corrective phase may have begun.
🔍 Momentum Analysis
Daily (D1): Momentum is about to turn bearish from overbought territory → suggests a weakening uptrend.
H4: Momentum is turning upward → likely a mild rally or sideways movement today before H4 reaches overbought again.
📌 Trading Plan
Given the current wave behavior and overlapping structure, it is best to remain patient and wait for confirmation before taking a strong position. If the Ending Diagonal structure is confirmed, it could signal a major reversal.
SELL Zone: 3392 – 3395
Stop Loss: 3403
Take Profits:
• TP1: 3368
• TP2: 3340
• TP3: 3324

Elliott Wave Analysis – XAUUSD | February 7, 2025🌀 Elliott Wave Structure (H1 Timeframe)
Looking at the current price structure, we can see that the price is moving sharply and steeply—this suggests the formation of a 5-wave impulsive structure.
Specifically:
- Waves 1, 2, and 3 (green) appear to have completed.
- Currently, wave 4 is forming as a 3-wave corrective structure (abc in black).
- Once wave 4 completes, we anticipate the next upward move as wave 5, which will complete the full 5-wave cycle (green).
🎯 Potential Price Targets for Wave 4
Based on the structure of the abc correction and support zones, we identify two key target areas:
+ Target 1: 3324
+ Target 2: 3311
When the price breaks above the top of wave b (black), it will serve as a strong confirmation that wave 4 has ended and wave 5 is beginning.
📈 Momentum Analysis
Daily (D1): Momentum is still rising and likely needs 2–3 more days to enter the overbought zone, supporting the continuation of the uptrend.
H4: Momentum is about to turn upward, signaling wave 4 may be nearing completion.
H1: Momentum is also preparing to turn up, suggesting the price is approaching the end of the wave 4 correction zone.
💼 Trading Plan
BUY ZONE: 3325 – 3322
STOP LOSS: 3215
TAKE PROFIT 1: 3345
TAKE PROFIT 2: 3368
TAKE PROFIT 3: 3395
📌 Wait for H1–H4 momentum alignment before triggering a BUY entry for wave 5.

Gold fluctuates upward. Is the decline over?On Monday, gold opened at around 3282, and then fell back quickly to around 3247 under pressure; the downward low was blocked, and then rebounded strongly to around 3297; the market currently maintains a small upward trend.
At present, we need to focus on the resistance range of the upward trend.
From the 4-hour chart, the upper short-term resistance is around 3295-3300, followed by the suppression range of 3310-3315. The main direction of short-term operations maintains the rebound short-selling strategy. The support below is around 3255; the overall short-term operation relies on 3260-3300 to maintain the main tone of high-altitude participation unchanged.
Operation strategy:
Short near 3305, stop loss 3320, profit range 3270-3260.
A new week has just begun. I wish you all gain something from the market fluctuations.

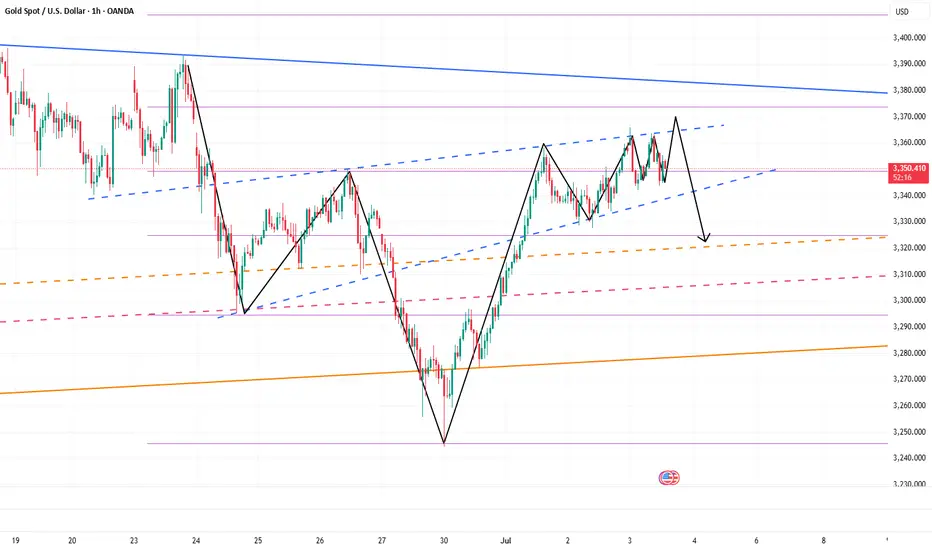
Elliott Wave Analysis – XAUUSD Trading Plan for June 30, 2025
🌀 Elliott Wave Structure
On the H1 chart, we observe a double zigzag correction WXY (in red). Currently, Wave Y appears to be developing as a green abc structure.
In this abc structure:
+ Wave a started with a leading diagonal (5-wave triangle).
+ Wave b followed as a typical abc correction (in black).
+ Wave c is currently unfolding as a clear 5-wave impulsive move, characterized by sharp and rapid price action.
The key issue now is to determine whether:
+ The price has completed wave 5 (black), or
+ It has only completed wave 3 (black) within the green wave c.
If the current movement is wave 3 (black), we should expect a wave 4 correction, followed by one more leg down to complete wave 5. In this scenario, wave 5 will be confirmed if the price breaks below 3255. There are two potential target zones for wave 5:
+ Zone 1: 3247
+ Zone 2: 3224
If wave 5 has already completed, the upward move to 3283 could be wave 1 of a new bullish trend. The next pullback would be wave 2, with an expected target between 3266 – 3261.
⚡️ Momentum Analysis
D1 timeframe: Momentum is in the oversold region, suggesting a high probability of a bullish trend in the upcoming week. This supports the view that wave c (green) of wave Y (red) is nearing completion.
H4 timeframe: Momentum is turning bullish, indicating the current upward movement may continue. This adds to the uncertainty about whether wave 3 or wave 5 has ended.
🧭 Trading Plan
📍 BUY ZONE 1
Entry: 3264 – 3261
SL: 3254
TP1: 3283 | TP2: 3297 | TP3: 3315
📍 BUY ZONE 2
Entry: 3247 – 3244
SL: 3237
TP1: 3283 | TP2: 3297 | TP3: 3315
⚠️ Important Note
This trading plan assumes either wave 3 or wave 5 has completed. Therefore, if in the early Asian session, the price does not touch the 3264 – 3261 zone but instead rises above 3283 without closing above 3297, and then drops back below 3283, we should avoid buying at 3264 – 3261.
Instead, we should wait for a potential entry at the 3247 – 3244 zone.

Gold volatility intensifies. Waiting for direction?The price of gold fluctuated greatly this week, which means that the end point of sentiment will not disappear so easily for the time being; in the short-term K-line pattern, there are continuous ups and downs. If you want to trade steadily, you can wait and see for a while.
From the hourly chart, the MA5-day and 10-day moving averages cross downward, and the RS indicator hovers around 40.7. This shows that the market trend is weak. The current price has bottomed out near 3310 and rebounded to fluctuate around 3320. The price may continue to decline after a slight rebound.
Today, focus on the long opportunities near 3305 and the pressure position above 3345.
Quaid has always believed that only by insisting on detailed analysis of the market and reducing losses, can we slowly accumulate the principal of the account.
Good luck to everyone.
Elliott Wave Analysis – XAUUSD Plan for June 26, 2025
🌀 Wave Structure
On the H1 chart, our previous plan anticipated price movement within green wave 3. However, the current price action lacks the sharp, impulsive characteristics typically seen in wave 3. Instead, the overlapping structure of minor waves suggests that we may not be in wave 3. This leads us to consider two primary scenarios:
🔹 Scenario 1 – abc Correction (black):
Price may be forming wave c (black). However, due to the overlapping nature of recent price moves, it is likely that wave c is developing as an ending diagonal (wedge).
➡️ Confirmation signal: A sharp, steep decline that breaks below the 3297 level would signal that wave c has completed.
🎯 Target zone for wave c: 3352 – 3356
🔹 Scenario 2 – Leading Diagonal in Wave 1:
The overlapping price structure could also be forming a leading diagonal (3-3-3-3-3) as wave 1. In this case, price is currently in wave 3 or 4 of this formation.
➡️ Once wave 1 completes, we expect a retracement to the 0.618 Fibonacci level of the entire wave 1 – forming wave 2.
🎯 Target zone for the end of wave 1: 3352 – 3356
📉 Momentum Analysis
Momentum plays a crucial role in determining which wave structure is unfolding.
D1 Timeframe: Momentum is turning upward from the oversold zone – indicating that the downtrend may be ending. This supports the scenario of a leading diagonal wave 1 and suggests we may see a sustained bullish move over the next 5 days.
H4 Timeframe: Momentum is preparing to reverse downward from the overbought zone. This is a key signal to monitor today, especially during tonight’s news events.
If price continues to move sideways within a wedge, it would support the leading diagonal scenario.
If price breaks down sharply, it would favor the abc correction scenario.
🧭 Trade Plan
🔻 Sell Zone: 3352 – 3355
⛔️ Stop Loss: 3362
🎯 Take Profit 1: 3333
🎯 Take Profit 2: 3323
📌 The market’s behavior during the U.S. session tonight will be critical in confirming the wave structure. Stay alert and ready to adjust the trade plan accordingly.

Gold continues to fluctuate. Waiting for a trend?Today, gold has been suppressed below the high of 3345, and the hourly line tends to be weak. Looking at the number of Yin and Yang lines on the hourly line during the fluctuation, we can see that the typical Yin line is continuous and the Yang line is few, plus the weak suppression of the previous day, from the rhythm point of view, it is a weak signal.
From the hourly chart, around 3312, this is the 0.618 position of the retracement of the 3295-3337 fluctuation range. The decline is slow during the day, and the 0.618 position has become a support rebound.
And the current trend, like the previous day, may continue to rebound and then fall. At the same time, there was no cyclical decline in the early Asian session. Instead, it fluctuated sideways, bottomed out and rebounded, and then continued to return to the high of the previous day.
Judging from the current market situation, the Asian market bottomed out and rebounded in the morning, reaching a high of around 3343, and then began to fall back, and is currently fluctuating around 3335.
The trend of the European session is very critical, and the focus is on the watershed below 3328. If this position falls below, the price will most likely continue to fall.
Operation strategy:
Short around 3340, stop loss 3350, profit range 3320-3310.

Gold may continue to rebound to 3350-3360If gold can stand above 3330 today, it will stimulate long trading behavior to a certain extent, especially the self-rescue behavior of trapped longs. Gold may continue to rebound and is expected to reach the 3345-3355 area. So there is no need to risk shorting gold near 3330 for the time being; although gold may continue to rebound, it is still under pressure in the 3350-3360-3370 area; and gold is still weak overall, so we can consider shorting gold in the 3350-3360 area and look at the target area of 3325-3315.
The Premium privilege of my account will end on June 26, and it will stop updating here from tomorrow. Friends in the channel have already made a lot of money by following my trading strategy. Friends who have not joined yet can join and receive the latest trading strategies and trading signals as soon as possible to escort your trading!

Elliott Wave Analysis – XAUUSD Plan for June 25, 2025🌀 Elliott Wave Structure
Looking at the H1 chart, we can see a 5-wave black triangle structure has formed within wave Y. This suggests two possible scenarios:
Scenario 1: Wave Y has completed → the current upward move is wave 1 of a new 5-wave green structure. The ongoing pullback would then be wave 2 of this sequence.
Scenario 2: Wave A of wave Y has completed as a 5-wave move → we are now in wave B of wave Y, which typically forms a 3-wave pattern. In this case, wave a (black) has formed and wave b (black) is currently developing.
✅ In both scenarios, the ongoing decline is a shared element — representing a buying opportunity.
🎯 Key Target Zones
Target 1: 3313 – 3310
Target 2: 3301
⚠️ If price breaks below 3297, the current wave count is invalidated, and we must prepare for a deeper correction. Updates will follow if that happens.
🔁 Momentum Outlook
D1 Timeframe:
Momentum is about to reverse upward. We expect at least 5–6 days of bullish movement for D1 momentum to reach overbought territory ⇒ This supports a potential short-term uptrend and favors both bullish wave counts.
H4 Timeframe:
Momentum is about to reverse downward from the overbought zone → A further decline to our buy zones is likely.
H1 Timeframe:
Momentum is currently declining → The ongoing pullback is expected to continue.
📌 What to wait for: A bullish reversal in H1 momentum aligned with H4 in the oversold region will confirm the bottom is in.
✅ Trade Plan
🔹 BUY ZONE 1: 3313 – 3310
• SL: 3306
• TP1: 3335 | TP2: 3350 | TP3: 3376
🔹 BUY ZONE 2: 3303 – 3301
• SL: 3296
• TP1: 3335 | TP2: 3363 | TP3: 3376

Start going long on goldAlthough gold is under pressure and weak at present, gold still rebounded near 3295 under the influence of yesterday's major negative news, proving that there is still a large amount of buying funds below, limiting the retracement space of gold; and from 3295 to 3335, there is still a rebound space of $40, proving that gold is not extremely weak. Moreover, there is a gap left above, and there is a technical need to rebound to fill the gap;
In addition, yesterday gold fell sharply due to news, and there should be many longs trapped in the market. If gold is relatively stable, there may be self-rescue behavior of the trapped longs, so gold longs still have the opportunity to rebound to 3340-3350. At present, the main focus is on the short-term support area of 3315-3305, and we can moderately consider going long on gold in this area.

Elliott Wave Analysis – XAUUSD June 24, 2025
🌀 Wave Structure
Looking at the H1 chart during the Asian session today:
+ Price broke below the previous low at 3341, invalidating the idea that Friday’s rally marked the beginning of a new uptrend.
+ Instead, the rally appears to be forming a wave X in a larger WXY corrective structure.
+ Given the current complex corrective pattern, it’s challenging to precisely define the exact wave shape and targets.
🔻 Wave Y Structure:
+ The price action suggests the formation of a 5-wave decline, with the market currently in wave 4.
+ Wave 4 target zone: 3357 – 3363 → Sell zone.
+ After completing wave 4, we expect a continuation of the downtrend via wave 5, with a target around 3327 – 3324 → Buy zone.
+ Once wave 5 completes, we anticipate at least a corrective upward retracement, with targets at 3363 – 3376 (these are the TP levels for the buy trade).
⚡️ Momentum Analysis
+ D1 timeframe: Momentum is turning bullish, suggesting a potential rally lasting around 5–8 D1 candles after wave 5 finishes.
+ H4 timeframe: Momentum is declining and may enter oversold territory within 1–2 candles, supporting the completion of wave 5.
+ H1 timeframe: Momentum is rising and approaching overbought levels, indicating a likely end of wave 4 within 1–2 H1 candles.
📌 Trade Plan
🔹 SELL ZONE: 3363 – 3365
+ SL: 3373
+ TP1: 3342
+ TP2: 3330
🔹 BUY ZONE: 3327 – 3324
+ SL: 3317
+ TP1: 3342
+ TP2: 3363
+ TP3: 3376
+ Important Note:❗️
- If price reaches these zones with a Mazuboru candle (long-bodied candle with no wick) and fast volatility, do not enter immediately.
- Wait for the candle to close. If the zone breaks, keep an eye on the next support area around 3313 for potential reactions.

Dark moment for prices. Will it fall even lower?Information summary:
Due to the ceasefire in the 12-day war between Iran and Israel, market risk appetite has rebounded, demand for safe-haven assets has declined, and gold prices have plummeted. As an interest-free asset, gold prices are under pressure against the backdrop of declining risk aversion, but there is still buying support at low levels.
Investors are currently focusing on the speech of Federal Reserve Chairman Jerome Powell at a hearing of the House Financial Services Committee. Powell has been cautious about whether to cut interest rates in the near future.
Market analysis:
The current market selling sentiment has increased significantly, and for gold, falling has become the only path. It seems that the market has lost hope in gold, and the current gold price has fallen to around 3295, then rebounded slightly, and is currently fluctuating around 3313. The break of 3300 declares that gold still has further room to fall, and from the trend point of view, it is likely to continue to fall.
The current trend shows that the important support is around 3285. It is possible that it will fall directly to the current position. The Fed is still speaking, and it is unpredictable whether it will cause drastic fluctuations in gold in the future. However, from today's trend, shorting is the best solution at present, and the upper resistance position is in the range of 3315-3325.
Operation strategy:
Short around 3320, stop loss 3330, profit range 3290-3285.

Israel and Iran have a truce. Gold fluctuates sharply.Information summary:
Trump said on Truth Social that Israel and Iran have fully agreed and there will be a complete and thorough ceasefire. (About 6 hours from now, when Israel and Iran have finished and completed the last mission they are doing!).
After 12 hours, the war will be considered over. Iran will start a ceasefire first, and after the 12th hour, Israel will start a ceasefire, and 24 hours later, the world will salute the official end of this 12-day war.
Senior Iranian officials have confirmed that Tehran has agreed to a US-proposed ceasefire with Israel brokered by Qatar.
Market analysis:
From the current point of view of gold, the news market has been digested in the early Asian market, and gold has also fallen to around 3330. Now it is obvious that there may be a bottoming rebound.
But from the trend point of view, gold is still in the short position, and 3380 and 3400 have not been stabilized.
Judging from the current hourly chart, gold is likely to rebound to 3370-3380. Then it will quickly fall from this position to the early trading low of 3330. At the same time, we can also see that the trend near 3378 is at the Fibonacci 0.382 position. Moreover, the previous trend also rebounded from 3330 to 3380, and then fell back again.
So we need to be patient and wait for the price to rebound before going short. Of course, we can also choose an aggressive long strategy. Of course, we can also choose an aggressive long strategy.
Operation strategy:
Short near 3380, stop loss 3390, profit range 3350-3330.
Long near 3345, stop loss 3335, profit range 3370-3380.
