It's an Evacuation Through Green Candles💥 "One Last Leap of Faith?" - What Bitcoin Might Be Hiding Before September
The world’s on fire: Israel, Iran, Strait of Hormuz, oil, elections, the dollar, rates, black swan whispers.
And someone’s out here saying Bitcoin might still go up?
Yes. We are. Not because we believe - but because we see.
📉 Everyone’s afraid. The whales aren’t.
When the crowd goes into survival mode, the real game begins.
Whales aren’t exiting - they’re accumulating.
ETFs aren’t pausing - they’re inflowing.
The technical setup isn’t breaking - it’s compressing like a spring.
$104,000. Coil building.
If we break out - targets at $132K–$140K are absolutely in play.
👉 But that’s not the point.
The point is why this is happening while the world is burning.
🧠 The idea: Bitcoin isn’t a safe haven. It’s a distribution machine.
Gold is for panic.
Bitcoin is for structure.
Institutions don’t ask “is it scary?” - they ask “where’s liquidity?”
Everything is aligning for one last upside move.
Until September. After that - chaos is back on the table.
💣 The Global Playbook:
Now (Summer) - Consolidation, ETF flows, geopolitical fear - Strategic entries, low exposure
Breakout - FOMO panic, retail rushes in - Profit-taking via options
September–Fall - Macro/geopolitical shock - Already in cash or hedged
📌 Bottom Line
Yes, Bitcoin might pump. Not because the world is fine - but because someone needs to exit beautifully.
If you're reading this - you're early enough to think.
Markets don’t reward justice. They reward positioning.
🛠 What to do right now:
Watch the $104,000 level - it's the pivot
Breakout = final upside push to $132K–140K
Keep your eyes on September - reversal zone
Think in scenarios: entry, exit, protection
Follow EXCAVO - we don’t guess, we read the game
I've been talking about this scenario for a long time
Xbt

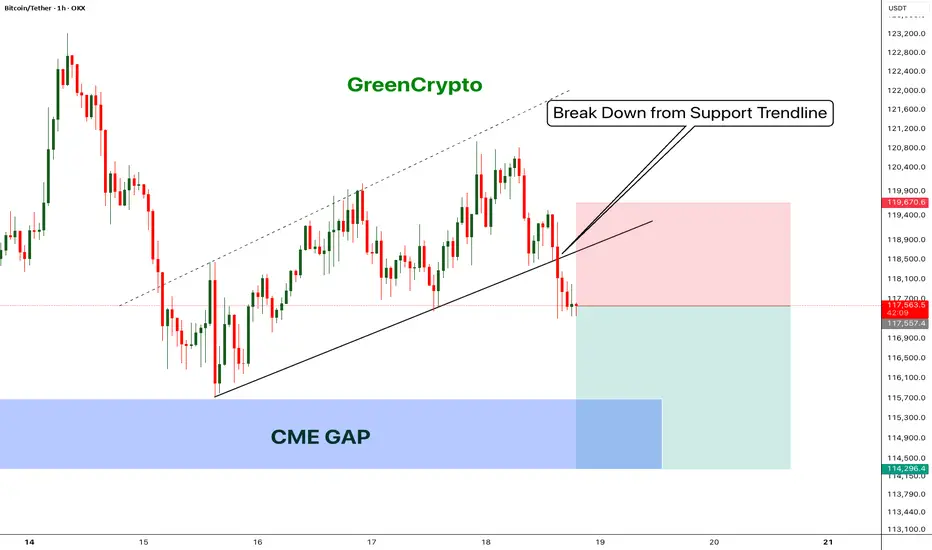
Bitcoin - Bears will push the price fill CME Gap- Bitcoin has broken down from the trending support,
- Price has been going down without any retracement on 1H candle.
- Looks like bitcoin will CME gap before going up further.
- A high risk Short Trade opportunity is here
Entry: 117,431
Stop Loss: 119,670
TP1: 116152.8
TP2: 114403.6
Move SL to Breakeven on TP1 hit
Don't forget to like and follow
Cheers
GreenCrypto
Bitcoin - Flag pattern is brokenBitcoin had been consolidating within a flag pattern for the past three months. That pattern has now officially broken to the upside, with the price surging to $109K — a strong bullish signal fueled by encouraging news around institutional adoption.
Based on both the technical flag breakout and ongoing fundamental momentum, the next target for Bitcoin is $145K. Any move beyond that would be considered a bonus in this current bull cycle.
Stay tuned for more updates.
Cheers,
GreenCrypto

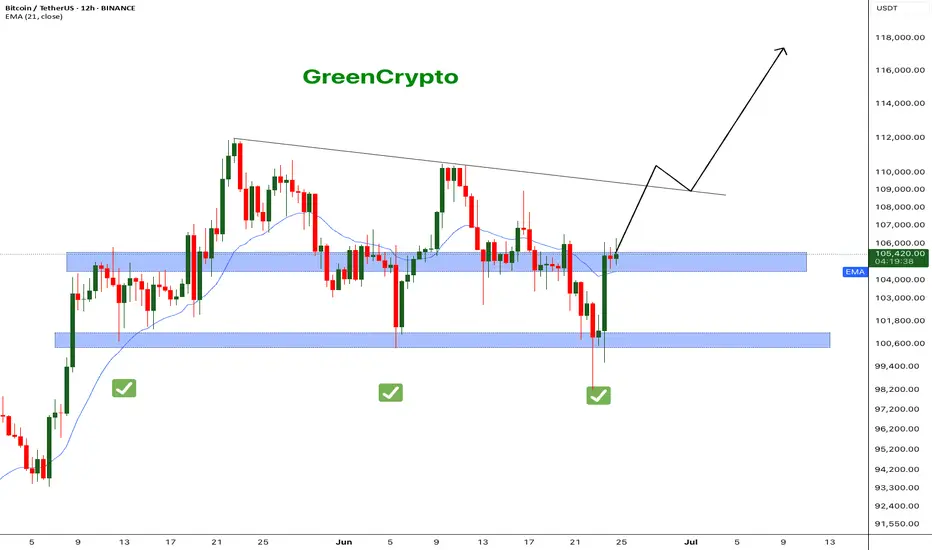
Bitcoin - What's next ? BINANCE:BTCUSDT (12H CHART) Technical Analysis Update
Now that ceasefire is announced, bitcoin price has successfully recovered to the resistance level and currently trading at the resistance zone. It's critical that bitcoin breaks this resistance for it to hit the next resistance around 110K .
I'm expecting price to reach 110k this week and we can see some consolidation in that range before moving further up.
Follow our TradingView account for more technical analysis updates. | Like, share, and comment your thoughts.
Cheers
GreenCrypto
2️⃣ Who's Next? Or: Operation: "Saving Private Saylor2️⃣ Who's Next? Or: Operation: "Saving Private Saylor"
❗️ Disclaimer: This idea is only a part of an article with a forecast for Bitcoin and the cryptocurrency market for 2025-2028. To fully and completely understand what is being discussed here, please refer to the root idea via the link:
1️⃣ Main Idea: Analysis of US Treasury Documents
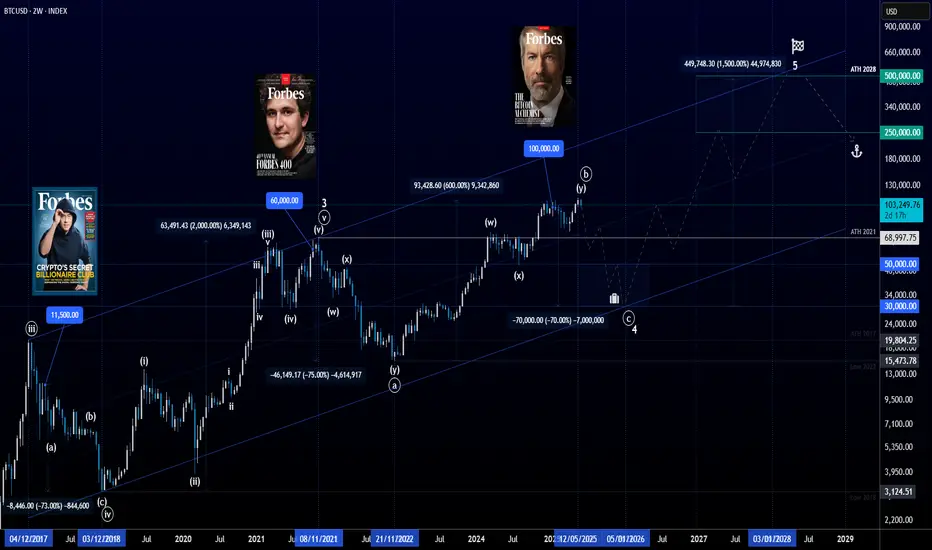
📰 Forbes: Your Cover – Our Margin Call. Saylor, Get Ready!
You've heard it, haven't you? Those stories about Forbes covers and the subsequent fall of crypto empires? It's no longer a superstition; it's, damn it, statistics:
Changpeng Zhao (CZ), Forbes, February 2018: "Binance's Crypto King!" – the headlines screamed. And what then? He served four months in prison. Well, not immediately, of course, but the "seed" of the curse was sown.
Sam Bankman-Fried (SBF), Forbes, October 2021: "The New Warren Buffett of Crypto!" – the fanfares shrieked. And what was the result? He's sitting pretty now, enjoying prison romance.
And now, our incomparable Michael Saylor enters the stage! Forbes puts him on the cover in January 2025 "Michael Saylor: The Bitcoin Alchemist"!
Why a Forbes cover is not glory but a warning for Michael Saylor (and a signal for the US government): This is not just a coincidence; it's a systemic pattern. Forbes, whether out of naivety or, conversely, subtle calculation, acts as an unwitting harbinger. They choose those who are at the peak of hype, those who have "believed in themselves" and are ready to tell the whole world about their "brilliant" strategy. And the peak of hype, as we know, is the beginning of a fall. And this is where it gets interesting. The US government, which carefully reads such magazines (after all, they write about "financial stability" and "national interests" there), sees Michael Saylor on the cover and thinks: 💭 "Well, well, this guy has accumulated half a million Bitcoins. And he's currently at the peak of self-admiration. Excellent! Get ready for 'Operation: Coercion to Stability'!"
❌ Why this cover for Saylor is not just a photoshoot, but a "liquidation marker" for the US government:
"The Forbes Curse" as a "Market Overheat" Indicator: For our financial strategists from the Treasury and the Fed, Saylor's appearance on the cover is not just a signal of "overheating"; it's a green light for activating the "Crypto-Reserve" plan. They see: "Oh, this guy got too relaxed. He has too much 'digital gold' at an average price of $74,000. And we love to buy at a discount, especially if the discount can be 'arranged'!"
Recession and Crash as "Natural Selection": Remember that TBAC in its documents constantly reminds us of Bitcoin's "volatility" and the "necessity of hedging." The perfect storm for Saylor is an "unexpected" recession in the US and a sharp stock market crash. At this moment, Bitcoin, which has always historically behaved as a "high-beta" asset (DA&TM, p. 5), will fall even faster. When BTC is in the range of $30,000 - $40,000, this will not just be a "loss" for Micro Strategy – it will be absolute financial hell for their leveraged positions, which they so "cleverly" accumulated.
Margin Calls: Music to Regulators' Ears: Saylor's average purchase price of $74,000, and Bitcoin has fallen to $30-40k? This is not just "oh, we're in the red" . These are massive margin calls and the threat of liquidation of MarginCallStrategy MicroStrategy's positions, which mortgaged its shares and Bitcoin itself to buy even more Bitcoin. The banks holding them as collateral (and which are, of course, "friendly" with the Fed) will start to get nervous. And then, as if by magic, the "saving hand" of the government will appear.
"Humanitarian Aid" (at a Bitcoin price of $30-40k.): They won't come waving checkbooks to buy Bitcoin for $100,000. They will come when Saylor is on the verge of collapse, and they will say: 💬 "Michael, we see your pain. To avoid 'systemic risk' and 'protect investors' (who are in your fund because you bought so much Bitcoin), we are ready to 'help'. We will 'acquire' your Bitcoin at a 'fair' price (which, of course, will be significantly lower than Saylor's purchase price) to 'stabilize' the situation. Naturally, this is not a purchase, but 'crisis prevention'."
Bitcoin in the "Crypto-Reserve": Mission Accomplished! Thus, the government, without directly buying a "speculative asset," will receive half a million BTC at a "bargain" price, using market crashes and financial pressure. And then they will be able to proudly declare: "We have 'digital gold' that will protect our financial system from external shocks. And yes, it is now in our hands, not some 'Alchemist's'."
✖️ The Forbes Curse: When a Magazine Becomes a Catapult for Crypto-Kings
The cover of Forbes magazine is not just paper and ink; it's the financial equivalent of an "X" on your back, appearing exactly when "Big Brother" decides you've gotten too big for your "digital gold" britches. Let's recall the chronicles of this "curse" to understand what awaits our Michael Saylor:
1. CZ (Changpeng Zhao), Binance:
▫️ Forbes Cover: Feb. 2018. Headlines trumpeted "crypto-king."
▫️ BTC Price: $11,500. The entire crypto-brotherhood rejoiced, thinking the moon-run was endless.
▫️ What happened next: By the end of 2018, Bitcoin plummeted to $3,000. A -73% drop. And Changpeng, after several years of legal battles, eventually ended up behind bars for 4 months.
2. SBF (Sam Bankman-Fried), FTX:
▫️ Forbes Cover: Oct. 2021. "The Billionaire Saving the Crypto World!" indeed.
▫️ BTC Price at the time: Around $60,000. The market was at its peak; everyone was talking about $100k, "diamond hands," and a "new financial era."
▫️ What happened next: A year later, by the end of 2022, Bitcoin was already around $16,000. A -75% drop. And Sam? Sam is enjoying government cuisine and the company of cellmates, sentenced to 25 years (but according to recent data, the term may be reduced by 4 years).
3. Michael Saylor, Micro Strategy:
▫️ Forbes Cover: Jan. 2025. Our "Alchemist" Michael, with brilliance and faith in his eyes, has concocted somewhere around half a million bitcoins and has finally received this "honor."
▫️ BTC Price: As of today, around $100k. Imagine the hype! Saylor tells everyone that "we've only just begun," that Bitcoin is "financial sovereignty" and "the future of humanity," whose price is about to fly to $500k without you! Buy now, don't miss out!
▫️ What will happen next (according to the "Big Brother" scenario): If history is not just a collection of boring dates, but a cyclical performance with notes of tragicomedy, then the following awaits us. A year after the Forbes cover, by early 2026, the price of Bitcoin in this scenario could plummet by -70% from its ATH. This means Bitcoin would be in the range of $30-40k. dollars. And what about Michael? I don't want to jinx it, but if CZ served four months, Sam will likely serve 4 years, then how long will our BTC-prophet and "crypto-Moses" get? Forty?
In conclusion: The Forbes curse is not magic; it's a harbinger of a systemic blow. So, when you see another crypto-hero on the cover of Forbes, don't rush to rejoice for him. Most likely, it's the last call before the "system" begins its complex, multi-step plan for "coercion to cooperation."
So, let's dream. No, not about flights to Mars, but about much more down-to-earth, but far more probable scenarios, where Washington finally gets its hands on "digital gold." After all, as stated in DA&TM, Bitcoin is "a store of value, aka 'digital gold' in the decentralized world of DeFi" . Well, since it's "gold," it should be in our "gold reserve," right? But to buy it directly? Oh no, that's a "speculative asset," it's "volatile" ! But "acquiring" it at a discount – that's a whole different song.
📝 The "Digital Couping" Scenario (or how to take Bitcoin without buying it on the open market):
◻️ Phase 1: Deflation of the US Stock Market Bubble
▫️ "Recession? Stock market crash? Perfect time for 'healing'!" The government and banksters will always find a way to "help" the market. If the American economy, as many are whispering now, faces a serious recession, and the stock market tumbles, then Bitcoin, as a "high-beta" asset, may well follow suit. Remember how Bitcoin reacted to "crashes" in 2017, 2021, 2022 (DA&TM, p. 5, chart). If Michael Saylor's average purchase price is $74,000 today, then a drop into the $30,000 - $50,000 range is not just a "correction"; it will be an absolute financial hell for his margin positions, which he so "cleverly" accumulated.
▫️ Margin-call for Micro Strategy. Michael Saylor didn't just buy Bitcoin; he bought it with borrowed funds, collateralizing his shares and even Bitcoin itself. In the event of a deep market downturn and, consequently, a fall in BTC's price, Micro Strategy will face serious problems servicing its debt and maintaining collateral. The banks that issued them loans (and these are, most likely, banks very "friendly" to the government) will start to get nervous. And then the most interesting part will begin.
◻️ Phase 2: "Operation: Buyout"
▫️ "An offer you can't refuse." When Micro Strategy is on the verge of default or bankruptcy due to its Bitcoin positions, "saviors" will appear on the scene – perhaps some specially created "Digital Asset Stability Fund" or even directly "government-friendly" large financial institutions that have received a "green light" and, possibly, even funding from the Fed (naturally "to ensure financial stability").
▫️ "We are not buying; we are 'stabilizing'!" They won't say: "We are buying Bitcoin." They will say: 💬 "We are preventing systemic risk! We are providing liquidity to the market during a crisis, buying back their 'high-beta' asset at a 'fair' price (which, of course, will be significantly lower than Saylor's purchase price)." And this is where the "digital gold" narrative, which has already permeated even official documents (DA&TM, p. 2), will come into play. "It's gold, and gold should be in the state reserve, shouldn't it? "
◻️ Phase 3: Nationalization of 'Digital Gold' and control over the narrative
▫️ "Congratulations, Michael, you've become a 'pioneer'!" After most of Saylor's Bitcoins are "saved," they will end up in the hands of, say, a "special depository" or a "strategic digital asset reserve." At the same time, the government will not "own" them in the traditional sense, but will "manage" them for "national interests."
▫️ "Now we have 'digital gold,' and it will work for us!" With this significant reserve of Bitcoins (576k "taken" from Saylor + 200k "confiscated" Bitcoins earlier – that's no joke), the US government suddenly becomes the largest sovereign holder of an asset that they will now officially recognize as "digital gold." This will allow them to:
▫️ Influence the market: If necessary, they will be able to use this "crypto-reserve" to "stabilize" prices, intervening in the market (for example, by selling small portions to curb too much growth, or conversely, by buying if the market falls sharply, but through their affiliated structures).
▫️ Legitimize "digital gold": If the US government has a Bitcoin reserve, then it's no longer "speculative nonsense," but part of the official financial system. This will open doors for broader institutional adoption, but on their terms.
▫️ Pump capitalization through stablecoins for national debt: A crucial strategic step will be to use this new "digital gold standard" to address the growing national debt. By aggressively legitimizing Bitcoin as "digital gold" and creating controlled mechanisms for its storage and trading (e.g., through regulated ETFs and tokenized assets), the US government will create a powerful incentive for capital inflow. In parallel, by strengthening regulation and encouraging the growth of fiat-backed stablecoins, collateralized by short-term US Treasury bonds (T-Bills), a colossal "cushion" of demand for US national debt will be created. The larger the capitalization of stablecoins, the greater the need for T-Bills to back them. The goal is to first build up a large BTC reserve, then, by boosting stablecoin capitalization, inflate the overall crypto market capitalization and the price of Bitcoin itself, to ultimately create a new powerful tool for "monetizing" or, at least, facilitating the servicing of US national debt. This will look like a brilliant financial maneuver, turning "wild" cryptocurrency into a tool for strengthening US financial stability and national security.
◽️ A rescue that looks like a robbery. So the scenario is not that the US government will "pump" Bitcoin by buying it expensively; the scenario is that they will create conditions and wait for the market to "drown" the most ambitious hodlers, and then come to the rescue to "save" their assets. And this "help" will look like the acquisition of a strategic asset at a bargain price, using existing market pressure mechanisms and crisis phenomena. This is a classic "good cop, bad cop" game, where the "bad cop" is an "unexpected" market recession, and the "good cop" is the government that "saves" assets to then use them for its geopolitical and financial interests. And all this under the guise of "financial stability" and "national security," of course. After all, who better than the government can manage your "digital gold"? Of course, no one!
❗️ Disclaimer: This idea is only a part of an article with a forecast for Bitcoin and the cryptocurrency market for 2025-2028. To learn more, refer to the root idea via the link:
1️⃣ Main Idea: Analysis of US Treasury Documents
1️⃣ Bitcoin. Analysis of US Treasury DocumentsHello, crypto enthusiasts, decentralization adepts, and those who still believe in "financial freedom". Get ready, because what you are about to read might shatter your template, but it will clarify where your beloved market is heading.
In June 2016, the blockchain world witnessed an unprecedented event – the hacking of The DAO , which called into question the fundamental principles of decentralization and smart contract security. This incident not only led to Ethereum's historic hard fork but also became a powerful impetus for the development of safer and more reliable solutions in DeFi and DAOs. This article is dedicated to that event.
Now, we won't be talking here about "future technology," "blockchain revolution," or how your shitcoin will fly to the moon. No. First, we'll talk about how the "system" is preparing to digest and rebuild the crypto market to suit its needs, using everything from Forbes covers to global economic crises. Here, the author shares not just predictions, but presents in an accessible form a broad understanding of the interconnected global processes, where crypto is just one 🧩 puzzle piece of the overall picture of the future digital "brave new world" of cyberpunk . This scenario is not someone's wishful thinking, but the most plausible course of events. You may like it, you may not, it doesn't matter; what matters is what you will do with this information next.
The article will be divided into three separate ideas:
1️⃣ Main Idea: Analysis of US Treasury Documents
2️⃣ Who's Next? Or: Operation "Saving Private Saylor"
3️⃣ Altcoins and the US Crypto Reserve
Get ready, the article will intentionally be long to immediately filter out all "clip-thinking" gamblers. In general, everything as you love it, written with love in a rebellious style, with a 🤏"touch" of cynicism, sarcasm, and tragicomedy. If you are interested in continuing any of the topics, follow the links (which will be below), and then return to this root idea. So, let's go!
1️⃣ Main Idea: Bitcoin and Crypto. Analysis of US Treasury Documents
For a long time, the world of cryptocurrencies was the "Wild West" – a place where anonymity, quick money, and the dream of complete independence from traditional banks and governments reigned. Bitcoin, with its idea of "digital gold," became a symbol of this freedom, promising refuge from inflation and manipulation by fiat currencies. But, as they say, the "Wild West" doesn't stay wild for long, especially when trillions of dollars and a threat to global financial stability – which is, of course, always "national" – loom on the horizon.
It's no longer a secret that US authorities and major financial institutions are carefully studying and analyzing the digital asset market. In this article, we will uncover a multi-step scenario where the "invisible hand of the market" is actually controlled by quite visible structures. We will show how a series of seemingly independent events – from the media's "Forbes curse" to an inevitable financial crisis – perfectly fits into a plan to create a US "crypto-reserve" and fully integrate (read: subjugate) digital assets into the traditional, centralized financial system.
Prepare for the harsh truth. This is not a story about crypto saving the world from fiat slavery. This is a story about how the fiat system, when faced with a challenge, adapts and absorbs the threat, using its own ideas. And, unfortunately for some, it will do so at the expense of those who believed in unlimited growth. Let's dive into the details of this cunning plan, where Michael Saylor is not just an investor, but a key figure in this spectacle of life unfolding before our eyes.
📜 Our "sacred scriptures" – this is an analysis of three crucial documents published on the US Treasury website:
1. The Future of Money and Payments (FM&P, September 2022): This is like Grandpa's first tentative step into using a smartphone. "Oh, what's this interesting thing you have here? Fast? Cheap? And here we old folks are still rustling with checks..."
2. Digital Assets and the Treasury Market (DA&TM, October 2024): Here Grandpa already figured out that the smartphone can count money. "So, these 'stablecoins' of yours – they're buying our bonds? That's even better than the Chinese!"
3. Digital Money (DM, April 2025): And here Grandpa is confidently tapping the screen and even seems to be trying to take a selfie. "Alright, stablecoins are our new MMFs, and if anything happens – I'll arrange a 'run' for you, like in 2008! And your Bitcoin is just 'digital gold' for nervous investors who run from our inflation to it, and then back to us for a hedge!"
Forget about conspiracy theories – they're writing it themselves! Documents like those presented by the Treasury Borrowing Advisory Committee (TBAC) clearly outline their views on "Digital Assets" and "Digital Money." In these reports, Bitcoin is no longer a "speculative toy," but a "store of value, aka 'digital gold' in the decentralized world of DeFi". And if it's "gold," then, by their logic, it should belong to the state, shouldn't it? Prepare yourselves, because today we're going to look under the hood of how serious gentlemen from the American financial elite suddenly "fell in love" with digital assets.
❓ So, what are these US financial authorities really trying to achieve? By studying and analyzing this open information, one can understand the scope and plans of the US financial elites. The main aspects extracted from those three documents are highlighted below:
1. The dollar is the world's drug, and we will control the dose, even in digital form!
Stablecoins? They're our "digital servants"! In DA&TM and DM, they are no longer just "digital assets," but "ubiquitous cash on the blockchain". And most importantly – these naive crypto-enthusiasts (without even knowing it) are buying short-term US Treasury bonds as collateral! This is a goldmine! We're already printing debt, and now the crypto market is financing it. "Thank you for using our services to ensure your unstable stability!"
"Wildcat banknotes" vs. "real dollar": DM doesn't hesitate to draw direct historical parallels. "Remember those 'wildcat banknotes' in the 1800s? Poorly collateralized, constant runs... And then the government came and said: 'Want reliability? Here's our dollar!'" It's the same story with stablecoins: "Your USDT and USDC are nice, of course, but only if they are 100% backed by our T-bills. Otherwise – no offense, but we remember the Terra/Luna story (and can repeat it if necessary), and you certainly don't need such happiness!"
"Your 'stable' coins must be our stable coins!" DM explicitly states: "Stablecoins will be regulated as narrow banks or money market funds!" This means: no more shenanigans with 'algorithmic' wonder-coins, like Terra! Now you will be backed only by highly liquid, risk-free assets... guess which ones? That's right, our own, American Treasury bonds ! Hello, Tether, you are now officially our best client!
"Our CBDC is not 'Bitcoin for the people,' but a 'prison blockchain' for control!" FM&P cautiously hints at CBDC as a "safe" alternative. But let's be honest: they don't just want a "convenient" digital currency. They want complete control. To know where every cent went, so that no Uncle Vasya can conduct a suspicious transaction without oversight. It's as if the NSA released its own crypto in 2008 – super-duper secure and decentralized, but every sneeze you make on the blockchain is recorded and tracked.
2. "We're for innovation! But only if it's on our platform, under our control, and preferably – on a private blockchain where you won't stick your curious nose!"
"Blockchain is cool! But not the one you're on!" DA&TM clearly states: "Public, permissionless blockchains? Oh, no, that's a nightmare! Scalability is lame, security is questionable, and let's not even talk about money laundering! We don't want every John Doe to be able to anonymously transfer millions. We need 'private and permissioned blockchains' where we know who's doing what, and can control everything."
"Tokenization is not a revolution, it's just a new Word for old documents!" Yes, they talk about "increasing efficiency" and "atomic settlements". But, in essence, they want to take their old, dusty Treasury bonds, slap a "token" on them and say: "Look, we're trendy too! Now you can 'instantly' exchange our bonds!" It's like buying a new iPhone but installing Windows 95 on it. Looks trendy, but works old-school. Tokenization of Treasury bonds is not for your pet hamster to buy a share in a T-bill, it's for "atomic settlements" and "improved collateral management" between large banks and institutions. If anything gets faster, it's their corporate ⚙️ gears, not your small transactions.
3. "Financial stability means your money is with us, not on some DeFi protocol!"
"We remember 2008 and 2020! And your stablecoins are MMFs on steroids!" DM very clearly shows that "runs" on stablecoins are exactly the same as "runs" on money market funds during a crisis. And the consequences? "Fire sales" of Treasury bonds, falling prices, chaos. "So, folks, if you want to be 'stable,' be like our MMFs – backed only by our government's risk-free securities!"
"Banks are sacred, and don't encroach on their deposits!" DM expresses unambiguous concern that these "interest-bearing stablecoins" could draw deposits away from banks. And this, begging your pardon, "could negatively affect banks' ability to attract deposits and make loans". That is, on bank profits. And we cannot allow that, because banks are the pillars of our system!
Thus, the "US financial authorities" are not just a group of boring accountants. They are strategists who play the long game. They cannot (or do not want to) stop the crypto revolution, but they can direct it into a channel that is beneficial to them. They want to:
"Regulate" stablecoins so they are simply a digital embodiment of their Treasury bonds.
Use blockchain for their own infrastructure, but with such centralization and control that Satoshi Nakamoto would turn over in their anonymous grave.
Ultimately, issue their own "digital dollar" (CBDC), which will be both "innovative" (in words) and "controlled" (in practice), so that no "private digital currency" infringes on their monopoly.
This is not about "freedom," it's about "controlled dominance". They are not chasing the crypto train – they are buying it, repainting it in the colors of the American flag, renaming it the "Financial Stability Express," and selling tickets that you will buy with your own, strictly regulated, stablecoins. Our three documents are not just bureaucratic papers. They are, in essence, a strategic plan to "tame the beast" and redirect its energy in the right direction. Or, as some official would say, "optimization of national interests". And in our language – "how not to lose global financial hegemony while these hipsters play with their numbers".
In the end, the US financial authorities are engaged in a kind of "digital colonialism". They cannot ignore blockchain and crypto, because it's no longer just "internet money for geeks," but a multi-trillion dollar market. Therefore, their goal is not to fight windmills, but to build their own, much more efficient windmills on the wind of digital innovations. And at the same time, ensure that all these windmills grind flour for their loaf of bread, that is, for the US dollar.
They want you to continue using the dollar, even if it's "digital".
They want your "stable" assets to generate income for them by buying their bonds. They want any "effective" blockchain solutions to be under their watchful eye, so that no one escapes into the "wild, unregulated" world of anonymity and decentralization. This is not about "freedom of financial innovation," it's about "innovation under strict supervision". Or, if you prefer, "controlled digital expansion". After all, what's the point of new technology if it doesn't serve the interests of good old hegemony?
🔍 Let's examine in more detail what is stated in the document: "Digital Money" (DM, April 2025). Or "The American Pump: Why Washington Wants 2 Trillion of Your 'Stablecoins' (and what they'll get for it)"
Imagine, our bureaucratic friends from TBAC (a club of clever people who whisper with the US Treasury) held a secret meeting in April 2025. And what did they see there? A prophecy! 💥 A prophecy that the stablecoin market, currently hovering around $234 billion, will soar to $2 trillion by 2028! That's an 8.5x increase, if you can count! A typical crypto bro would say: "Whoa, pump! We're making x's!" But a serious uncle from the Treasury would say: "Excellent structural demand for our Treasury bonds! Finally, these 'digital monies' are working for us!" So, how is the US government going to arrange this "pump" without admitting it?
📝 The "Digital Milking Machine" Scenario (or why your stablecoin is their new wallet):
"Our Dollar – Your Problem!"
▫️ "Stablecoins? They're our best friends!" At first, they frowned, saying, "anonymous, decentralized, risky." But then they saw that 99% of stablecoins are just digital dollars, pegged to their own paper! And they are used as "cash on the blockchain," meaning people in the crypto world are already actively using them. "Aha," they thought, "so the world has already accepted our dollar in digital form, even without our direct involvement. Excellent! Now we need to ride this and monetize it."
▫️ "Hey, stablecoins, buy more of our bonds!" The cherry on top from DA&TM: "Stablecoins hold $120 billion in Treasury bonds!" And if the market grows to $2 trillion, imagine: how much will that be in our precious, ever-deficient T-bills? It's just a celebration! "Please, keep issuing your stablecoins, the more the better! And we will give you paper with interest. And you, naive ones, will think it's 'collateral,' and we will think it's 'a new source of financing our debt'!"
"Regulation is Love (for our interests)!"
▫️ "We will regulate you to death... so you can be 'stable'!" TBAC explicitly states: "If history teaches anything, stablecoins must be regulated like 'narrow banks' or 'money market funds'". This is not for your safety, folks, it's for theirs. "We don't want you playing with 'algorithmic stability' and crashing markets like Terra/Luna. No, no, now you will walk the line, backing every dollar of yours with OUR Treasury bonds. Because only that is 'real' risk-free collateral, right?"
▫️ "But your 'interest-bearing' stablecoins... we don't really like them!" Why? Because they can "compete with bank deposits" and "undermine banks' ability to make loans". That is, if your stablecoins start earning you real interest, you'll run from the banks! And that's an assault on the sacred. "Propaganda for 'Tokenization' is a new 'quantum leap' (for our national debt)!"
▫️ "Tokenization? What's that? Oh, it's just our new way to sell bonds!" FM&P and DA&TM talk about "increasing efficiency of clearing and settlement" through tokenization. Sounds boring, but the meaning is this: "We want to make our national debt even more liquid and accessible. If these crypto-guys love tokens so much, then let our bonds be tokens too! And then, who knows, retail might follow, through these 'tokenized Treasury bond funds'!"
▫️ "Forget 'decentralization' for bonds, that's only for 'us'!" DA&TM clearly states: "Public blockchains are garbage for Treasury bonds". They need "private, permissioned blockchains". This means: "Blockchain is cool, but only if it's controlled by us, our banks, and you sit there like mice and don't make a peep. No anonymous movements!"
So yes, the US government will indeed "pump" the crypto market, but not in the way you think. It won't buy Bitcoin or Ethereum (at least not openly). It will "pump" the stablecoin market because it's:
A brilliant way to finance its own national debt by attracting capital from the crypto world.
An ideal tool to expand the global influence of the dollar, making it convenient "digital cash" in decentralized ecosystems, but under its control.
A method of "taming" the wild crypto-west, forcing it to play by its rules of financial stability, lest any glitch should harm their "traditional" system.
It's as if a casino decided to "pump" its players by saying: "We'll let you play with chips that are backed by our own debts. The more chips you make, the more of our debts you buy! And if your chips crash, that's your problem, because we warned you it was 'risky'!" So, yes, expect stablecoin capitalization to grow by at least $2 trillion by 2028.
🎮 All right, if you want to delve deeper into these documents yourself, follow the links above, and we'll move on. Now let's play a guessing game with you. The task: by elimination, figure out who on this list are "their guys" for the US government, who is a "stranger," and who cannot be touched, and who can or even should (from the US perspective) be "taken advantage of"?
📊 Largest Known BTC Holders (as of May 2025):
1. US Government: ~200,000 BTC (confiscated during investigations)
2. Satoshi Nakamoto: ~1.1 million BTC (not moved since mining)
3. BlackRock (iShares Bitcoin Trust - IBIT): ~650,000 BTC
4. Fidelity (Fidelity Wise Origin Bitcoin Fund - FBTC): >200,000 BTC
5. MicroStrategy (MSTR): ~576,000 BTC (as of May 2025)
6. Grayscale Bitcoin Trust (GBTC): ~187,000 BTC (outflows occurring)
7. Coinbase (reserves): >600,000 BTC (exchange balance, including client funds)
8. Binance (reserves): >500,000 BTC (exchange balance, including client funds)
9. Bitfinex (reserves): ~400,000 BTC (exchange balance, including client funds)
10. Gemini (reserves): >127,000 BTC (balance including client funds)
11. Tether (USDT, own reserves): ~100,000 BTC (in addition to fiat reserves)
🧮 Who are "their guys" and who is a "stranger"? Distribution of influence in the crypto market. In the grand game for control over the future financial landscape, especially in the digital asset sphere, the US government and its affiliated traditional financial institutions act strategically. Their goal is not to destroy cryptocurrencies, but to integrate and subjugate them on their own terms , creating a "National Crypto Reserve" and a new, controlled digital financial infrastructure. This process implies a clear distinction: who is "one of us" (a useful or tamed element of the system), and who is a "target" (a source of assets or a potential object for threat elimination). There are also unique cases that fall outside this dichotomy. Let's analyze the list of the largest BTC holders as of May 2025 from this perspective:
"Their Guys" (fully integrated, tamed, or cooperating): These players are already deeply embedded in the traditional US financial system or are actively striving for full regulatory compatibility. For the US government, they are either direct partners or "tamed" assets that contribute to achieving strategic goals. They are not touched, but used as tools or components.
1. US Government (~200,000 BTC): Status: absolute "their guy" and main player. They are the ones who will "take advantage" of others. They are the ones who set the rules and collect dividends. Their Bitcoins are confiscated assets, a "free" replenishment of the future "National Crypto Reserve".
2. BlackRock (iShares Bitcoin Trust - IBIT: ~650,000 BTC) and Fidelity (Fidelity Wise Origin Bitcoin Fund - FBTC: >200,000 BTC): Status: key institutional "their guys" from traditional finance. These are Wall Street giants who have received SEC approval for their spot Bitcoin ETFs. Their massive BTC accumulations are not speculation, but a strategic integration of cryptocurrencies into the existing system. They act as main gateways for institutional capital, channeling it into a regulated stream. They are actively involved in shaping the new financial architecture, for example, BlackRock with the BUIDL fund for tokenized Treasury bonds, which fully aligns with the TBAC vision. They cannot be touched; they are part of the control mechanism.
3. Grayscale Bitcoin Trust (GBTC: ~187,000 BTC): Status: tamed "their guy." After the trust's conversion to an ETF and massive outflows, GBTC came under direct SEC control. Despite asset losses, the remaining assets are now in a regulated product. Grayscale was forced to fully adapt to the system's rules. There's no need to touch it – it's already in the system.
4. Coinbase (reserves: >600,000 BTC): Status: key "their guy" in the US crypto market. This is the largest regulated American crypto exchange that actively cooperates with authorities. Coinbase serves as the "main entrance" for retail and institutional investors in the US. Its transparency and compliance make it indispensable for the system as a tool for data collection and control over fund movements. It will not be touched, but will be used as part of the regulated infrastructure.
5. Tether (USDT, own reserves: ~100,000 BTC): Status: "tamed" and useful "their guy." Tether, being the largest holder of US Treasury bonds, is already deeply integrated into the financial system. The system does not seek to destroy it, but to fully subjugate it to regulatory control. For the government, it is a source of demand for their debt (Treasury bonds) and a potential tool for controlling digital flows. It will be "regulated" in the sense of "finally brought to heel," so that it becomes absolutely transparent and controllable, essentially a private digital dollar under supervision. (See DA&TM pp. 4, 17, 25).
6. Bitfinex (reserves: ~400,000 BTC): Status: "their guy" through affiliation with Tether. Since Tether is already recognized as "their guy" and is under regulatory pressure, its affiliated structures, such as Bitfinex, also automatically fall under this logic. If Tether is "tamed," then Bitfinex, as part of the same ecosystem and holding significant assets, will also be forced to comply with the same standards of transparency and compliance. This is not a "stranger" in the full sense, but rather a "younger brother" controlled through the elder.
7. Binance (reserves: >500,000 BTC): Status: already "regulated." Lawsuits, multi-billion dollar fines, and CZ's removal are classic examples of how the system forced the largest global, but previously less regulated, player into submission. Now Binance, although still a powerful force, is forced to operate within the given rules. It no longer needs to be "touched" in the same sense – it has been "tamed" and included in the sphere of influence.
8. Gemini (reserves: >127,000 BTC): Status: "their guy," but with caveats. Gemini is an American exchange actively striving for compliance. Despite past regulatory difficulties (e.g., with the Earn program), it remains part of the regulated American crypto infrastructure. It will be used to control flows, but also kept under constant supervision.
Neutral Player (not participating in the game): This anonymous entity is outside the system of control and is neither "their guy" nor a "target" in the traditional sense. Satoshi Nakamoto (~1.1 million BTC): Status: Neutral, not participating in the game, and untouchable. These Bitcoins remain untouched and symbolize true decentralization and uncontrollability. The US government cannot touch them , unless "Satoshi" himself decides to move funds to a regulated platform or an incredible cryptographic vulnerability is found.
So, the only major target that can be 'taken advantage of' is, 🥁 drumroll: Micro Strategy (MSTR: ~576,000 BTC) Status: 🎯 Main Target. Although Michael Saylor is a prominent Bitcoin supporter, and Micro Strategy is a public company, their aggressive accumulation strategy (often through debt) makes them extremely vulnerable to the price of Bitcoin. In the event of a serious market crash, Micro Strategy will face enormous pressure (margin calls, debt obligations). In such a scenario, their significant assets could become targets for forced liquidation or acquisition by organizations with deeper pockets and government backing. Their "high-beta" nature (as described in TBAC documents) makes them vulnerable.
For the continuation of Michael's story, see the separately published idea:
2️⃣ Operation: "Saving Private Saylor." Or how Uncle Sam "nationalizes" Bitcoin while Michael is busy with micro-strategies.
🎼 "History doesn't repeat itself, but it often rhymes" – and for Michael Saylor, this rhyme echoes with unsettling persistence.
In 2000, he, the shining dot-com hero, faced the prose of numbers when the Securities and Exchange Commission (SEC) knocked on his door . The overstatement of revenue by MarginCallStrategy MicroStrategy and non-compliance with "Generally Accepted Accounting Principles" (GAAP) – all this led to a restatement of financial results and a stock collapse of -60% in a day, and then almost -90% in a few weeks. But this episode was just the first line in a long poem.
Two decades later, Michael Saylor re-emerged on the scene, now as a prophet of "digital gold," transforming his company into the largest corporate holder of Bitcoin. His passionate belief in decentralization and the unique nature of BTC is striking. He claims that Bitcoin is a hedge against inflation, an eternal store of value, immune to the manipulations of the fiat system. But the louder his sermons about Bitcoin, the more they rhyme with the past: excessive confidence, public bravado, and disregard for fundamental risks.
History does not repeat itself literally, but it rhymes. Michael Saylor in 2000 and Michael Saylor today are two lines of the same poem, where the final chord will belong not to "digital gold" in its pristine, decentralized form, but to "tokenized government bonds" and CBDCs, which will become the foundation of a new, controlled financial order. Bitcoin, of course, will survive another -70% collapse, but in a completely new role that better suits Washington's needs than the dreams of crypto-anarchists.
Let's delve deeper. To avoid overloading the article, it has been decided to publish the section on altcoins and the scenario for replenishing the US "Crypto-Reserve" separately from the main root idea. If you are interested in learning how the government intends to make the US the "crypto capital of the world," and the fate of altcoins with a forecast for 2025-2028, follow the link:
3️⃣ Altcoins and the US "Crypto-Reserve"
Excellent, let's continue. Now we are on the home stretch! Connecting all the dots: the Forbes curse, the inevitable crash, the insidious plans of the US government, and finally, the final mega-pump.
Washington's Grand Crypto-Gambit: How they will crash the market to orchestrate a 'Final Pump' (and why they need your altcoins at dirt-cheap prices for this)
My previously published basic crypto forecast is not just relevant – it is becoming even more ominously realistic; it's just (as usual) slightly shifted in time. Because the "big guys" in Washington are not some Elon Musks who pump with tweets. They work on a schedule, and their schedule is called "global economic recession," which the Democrats have stubbornly delayed until Trump's presidency since 2023.
◻️ Part 1: "Pre-Pump Cleanse" – Why a crash is coming (and why Bitcoin won't hold up either) 2025-2026.
While you rejoice that Bitcoin is demonstrating "phenomenal resilience," trading around $75,000 - $100,000 (thanks to Bitcoin ETFs and migrating Chinese, at least some demand!), I'll tell you straight - it's an illusion. It's like the last dance before the fall.
▫️Bitcoin – king, but on a shaky throne: Yes, demand from ETFs and "fleeing capital" from China have kept the price around $100k for the last three quarters. But, let me remind you what TBAC said (and that, by the way, is the voice of the Treasury!): Bitcoin is a "high-beta asset." This means it amplifies market movements. If the stock market sneezes pretty hard (down -30-40%), Bitcoin will catch pneumonia (down -60-70%).
▫️Alts – it's already a "bloodbath": While Bitcoin is setting its historical highs (essentially drawn on the enthusiasm of new funds), alts are already howling in pain. The altcoin index CRYPTOCAP:OTHERS is already -40% lower since the beginning of the year, with its capitalization falling from $450 billion to $260 billion.
The Impending (US-Managed) Armageddon in the Markets:
"Debt market? What's that?" The absence of buyers in the debt market (hello, USA, Japan, EU!) – this is not just a "small problem," it's a systemic crack. Who will finance all these government expenditures if no one wants to buy bonds?
"Liquidity? What liquidity?" The liquidity problems in the global "Eurodollar" financial system are no longer a joke. When the world's largest financial arteries become clogged, blood stops flowing.
US stock market (SP500 and NDQ100) crash of -30-50% from their ATH in 2025. This is not just a "scare," it's a controlled demolition of an old building to construct a new one. And in the still "very small cryptocurrency market" (by traditional market standards, of course), this will result in a further -60-80% drop from current levels!
Buckle up, Bitcoin to $30,000 - $50,000! Yes, my forecast is harsh, but realistic. Before a new phase of growth for the entire cryptocurrency market (yes, not just Bitcoin, but your beloved altcoins too), we are obliged to see a final sell-off.
◻️ Part 2: "Final Pump: When Uncle Sam Becomes Your Crypto-Manager" (2026-2028)
This is where it gets really interesting. After the market is flushed out, "weak hands" are eliminated, and Michael Saylor's (and many others') "digital gold" is "nationalized" at a bargain price, they will enter the stage – the US authorities.
"Our dollar – your digital wallet!" Remember TBAC's forecasts that the stablecoin market will grow to $2 trillion by 2028? This is no coincidence. It's a plan. They don't want to "pump" Bitcoin; they want to "pump" their stablecoins, which, of course, will be 100% backed by their own Treasury bonds. This is the ideal mechanism for financing their bottomless debt!
"Regulation? No, it's controlled growth!" They will "regulate" the market to make it safe... for them. Stablecoins will become "narrow banks," and private blockchains – "permissioned." This means: "Use our 'digital currency' (stablecoins), buy our bonds with them, and everything will be fine. And if you want 'innovations,' only on our centralized infrastructure!"
"Tokenization of all America": When traditional markets are in ruins, they will announce a "new era" – the era of tokenization! Tokenized Treasury bonds (convenient for buying with your stablecoins!), tokenized stocks (after the crash, they will become very "attractive" for buying via blockchain!), tokenized real estate... And all this under the supervision of "reliable" centralized structures.
"Final explosive growth" (under control): It is precisely this controlled growth, this inflow of liquidity through stablecoins and the tokenization of traditional assets, provoked and financed by the US authorities, that will be the "final explosive growth" for the entire crypto market in 2027-2028. Crypto will grow not because it is "decentralized," but because it has finally been "tamed" and integrated into the global financial system, but on Big Brother's terms.
📉 Periodic Crashes – A Tool for Capital Redistribution
Many current fresh gamblers "investors" don't understand a simple thing: periodic crashes in financial markets, be it stocks or cryptocurrencies, are not a "bug" or an accident, but a built-in "feature" of the system itself. This is a powerful tool for redistributing capital, constantly transferring wealth from some to others. At each turn of the economic cycle, when "bubbles" inflate (be it dot-coms, mortgages, or crypto), and then deflate with a resounding crash, a massive redistribution of wealth occurs. This is not a natural disaster, but rather a well-oiled mechanism.
Accumulation of assets by "dumb money": During periods of rapid growth, when markets are overheated and assets are rising rapidly, "dumb money" enters the game – that is, ordinary retail investors, small speculators, newcomers without a deep understanding of risks. Inspired by stories of successful success and the fear of missing out (FOMO), they pour their savings into the market at its peak, often using borrowed funds or buying the most volatile and overpriced assets. They buy "hype," not value. It is here that MicroStrategy, aggressively buying Bitcoin with borrowed funds, becomes a symbol of this vulnerability, albeit on a larger scale.
Shaking out weak hands: For the "system," there are two main methods to get rid of "excess passengers" and "weak hands" in the market. The first is sharp, panic-driven crashes, when fear forces investors to sell assets at a loss, just to "get out of the game." The second, no less effective, is the exhaustion of enthusiasm over time (prolonged periods of stagnation). These are months or even years of boring "sideways" trading (trading in a narrow range) or slow but steady price declines. At such moments, the belief in quick profits fades, and investors, especially those who invested in altcoins without fundamental understanding, lose patience and leave, abandoning their assets at throwaway prices. Both methods effectively "clear out" inexperienced or insufficiently patient participants.
Creating "liquidity" for institutions: Crashes and price declines, as well as periods of stagnation, create what is called "liquidity" – an opportunity for large players to buy assets at significantly discounted prices. When the market is "bleeding," or when "hamsters" get tired of waiting and sell everything in despair, that's the "meat" that the "falling knife" provides for "smart money."
Benefits for "smart money": Giants like BlackRock, Fidelity, Vanguard, or legendary investors like Warren Buffett, do not invest in "hype." They create trends and wait. They possess enormous capital reserves, access to insider information (analytics, government plans, such as TBAC documents), and, most importantly, iron discipline and patience. They do not succumb to panic; they create it when needed! When markets are bleeding and "ordinary mortals" sell everything in a panic, these "sharks" of the financial world go hunting, buying quality assets (be it stocks, real estate, or even Bitcoin, which is already recognized as "digital gold" in certain circles) at prices inaccessible to small players.
Centralization of wealth: As a result of each such cycle, a further centralization of wealth occurs. Capital flows from less informed, less disciplined, and more emotional market participants to those who play by the rules of the "big game," having access to resources, analytics, and, possibly, even a certain influence on the system itself. Market crashes are not system errors, but its key redistribution function, allowing capital to remain in the hands of the elite and constantly increasing their share of the overall wealth pie. This is a brutal but extremely effective mechanism of "natural selection" in the world of finance.
And these are not some "conspiracy theories" but the harsh truth, whether someone likes it or not. According to 2022 data, people with capital over $1 million, making up only 1.1% of the world's population, own ~50% of the world's wealth, while the richest 12.2% of people own over 85%. At the same time, the poorest 55% of the planet's population controls only 1.3% of the world's wealth. Between these two poles, about half of the global wealth is (for now) dispersed. And in 2026-2028, you will have the last chance to enter this "middle class," which is systematically being destroyed by those at the top of the pyramid.
✴️ Your place in the "New World Crypto-Order" (or why freedom is an illusion)
We live in an era when even the seemingly most "decentralized" and "independent" market, like crypto, ultimately finds itself under the close scrutiny of those who hold the strings of the global financial system. Documents like TBAC (which you will hopefully now read with double attention) are not just bureaucratic reports; they are roadmaps to how "Big Brother" intends to integrate, and essentially subordinate, the "wild" world of digital assets to its interests. So, we have established that:
The upcoming stock market crash and, consequently, crypto crash in 2025-2026 – this is not just an "unexpected market correction," but an inevitable managed stage of "cleansing" that will allow the "system" to get rid of "weak hands" and acquire assets at a discount. Your altcoins, which are already bleeding, will become even cheaper before they are picked up by those who know what they are doing.
"Pump" of stablecoins to at least $2 trillion by 2028 – this is not a sign of your victory, but a brilliant way for the US government to find a new, bottomless source of financing for its ever-growing national debt. Your "stable" money will become their "stable" bonds, as most stablecoins, especially USDT and USDC, are backed by US Treasury bonds, which creates direct and massive demand for US debt obligations. "Continued growth of stablecoins... will create structural demand for short-term US Treasury obligations." (DA&TM, p. 16)
The narrative "Bitcoin – digital gold" – this is not just a marketing ploy by crypto enthusiasts, but a convenient concept that the government can use to "nationalize" large crypto assets at a bargain price and use them for its own benefit. The hidden, but key goal of this narrative is to create a new, global tool for absorbing and refinancing part of the colossal US national debt. The higher the recognition and price of "digital gold" controlled by the state, the more financial leverage it will gain to manage its obligations, turning a decentralized asset into a new pillar of the fiat system .
❓ What does this mean for us, mere mortals, trapped in this crypto-matrix?
This means that the next six months are a time not for euphoria and not for buying a "strategic reserve," but for strategic retreat and patient waiting. While "Big Brother" squeezes the market and prepares for the "nationalization" of crypto assets through defaults and margin calls, we should:
Keep a finger on the pulse of the global economy: Attention to the debt market, Eurodollar liquidity problems, and the predicted stock market crash in 2025 – this is not background noise, these are the main indicators of the upcoming "cleansing."
Forget about FOMO for Bitcoin at $100k: These are just the death throes of a "bull market," supported by artificial demand. The target range of $30-50k is an entry point that "their boys" are preparing for themselves.
Aim for altcoins: Your favorite altcoins, which have already fallen by -40% since the beginning of the year and still have room to fall (by -60-80% from current levels) – this is where the real "bloody auction" will be. It is these assets that, after the crash, will become most attractive to those who understand what will follow the market "cleansing" and which coins will end up in that very US "crypto-reserve."
🏁 Final Act: Controlled Explosive Growth (2026-2028) When the dust settles, and Michael Saylor's (and many others') Bitcoins are in the hands of the "State Crypto-Reserve" at a large discount, the real "pump" will begin. But this will not be a pump of "decentralization" or "freedom." This will be controlled, institutional, government-funded growth, based on:
Excess liquidity created by banksters. Growth in the broad cryptocurrency market, especially on such a massive scale, is impossible without an influx of "cheap" money into the global financial system. For this excess liquidity to appear, appropriate conditions must be created: low-interest rates (close to zero) and a reactivated "printing press" (Quantitative Easing – QE). To achieve this, the stock market (and, consequently, the traditional economy) must first be sharply crashed to force the Fed to abruptly "change course" and begin "saving" the economy by injecting trillions of dollars into the system. This "flood" of liquidity will be the fuel for a new wave of crypto market growth, but strictly under the control of their guys institutions.
Trillions of stablecoins, backed by US national debt. These stablecoins, as we already understand, create structural demand for short-term US Treasury obligations, becoming a powerful tool for managing national debt.
Mass tokenization of traditional assets on "private, permissioned blockchains" managed by banksters. This will create huge new markets and capital flows that will be controlled by their players.
And, of course, a legitimized Bitcoin as "digital gold," which will now be in safe government hands, not with some "alchemists" or "micro-strategists."
💡 Be smart, not emotional.
The cryptocurrency market – is not just a set of charts and technologies. It's a battlefield where the interests of decentralization and centralized control clash. In the coming years, we will see how the last "wild" frontier of digital assets will be integrated into the traditional financial system.
Your task is to understand this scenario, step aside while the "elephants dance," and prepare to enter when "blood is flowing in the streets." Only then will you be able to become part of this final explosive growth, which, ironically, will be provoked and financed by the very forces that are now trying to herd crypto into a corral.
⚠️ See you in 2026! And remember: knowledge and understanding – this is your only superpower in this zero-sum game, as everyone, to the extent of their understanding, works for themselves, and to the extent of their misunderstanding – for those who know and understand more.
🚀 As a token of gratitude, don't forget to hit the rocket under this unique work.
🙏 Thank you for your attention.
📟 Stay in touch.

Bitcoin - This time different ?In 2021-22 bitcoin formed a higher high on weekly chart and then bear run of 2022 started, if we look at the bitcoin current chart the same pattern being formed.
Do you think bitcoin will form the similar pattern ? In my opinion it is highly unlikely that bitcoin will see similar pattern, in 2022 the second push was due to overall market euphoria which pushed the price to new high even though bear market was already on (Bitcoin hit new ATH after crashing 55% which is unusual)
If we look at the current pattern bitcoin had -30% crash, which is normal between bull runs, so its highly unlikely that bitcoin will similar fate as 2021.
Follow Our TradingView Account for More Technical Analysis Updates, | Like, Share and Comment Your thoughts.
Cheers
GreenCrypto

Bitcoin - Confirmed Breakout#BTC/USDT #Analysis
Description
---------------------------------------------------------------
+ Bitcoin has successfully broken out from the resistance, this is the third time bitcoin has broken out from the resistance line, in the previous two breakouts bitcoin had significant growth and we can expect similar growth this time.
+ the next target for bitcoin is around 150k and this is an easy target for bitcoin.
+ Bitcoin can see some consolidation around previous resistance (around 109k) but this can be broken easily.
+ Lets see how this plays out.
---------------------------------------------------------------
Enhance, Trade, Grow
---------------------------------------------------------------
Feel free to share your thoughts and insights. Don't forget to like and follow us for more trading ideas and discussions.
Best Regards,
VectorAlgo

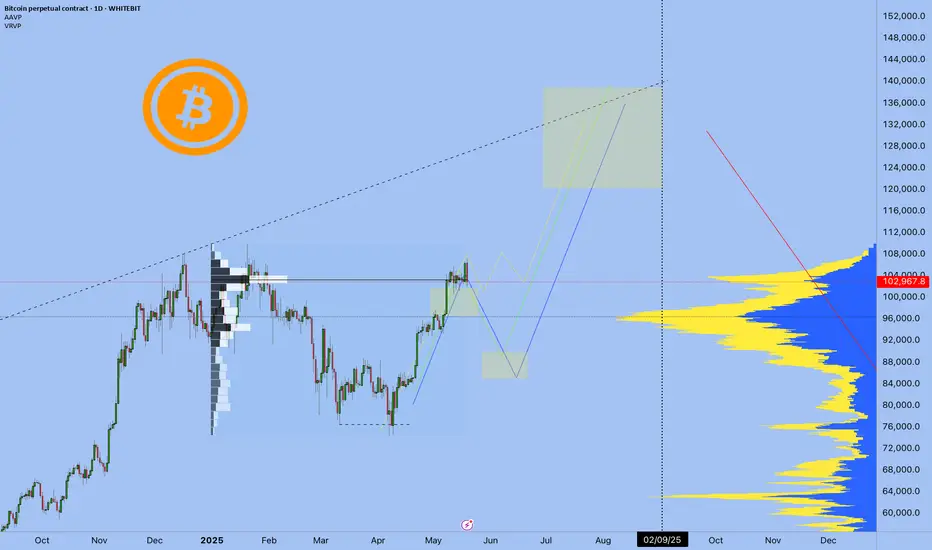
BTCUSD 19.05.2025 Bitcoin Navigator: BTC Update (May 2025)So the offline tournament is over, I took third place, and I just got back into work mode
In my previous publication ( link ), I outlined possible scenarios for Bitcoin’s price action, leaning towards a correction from around the $98-101k zone down to approximately $88k.
However, the current market situation demonstrates the most optimistic scenario (highlighted in yellow on the chart). At the moment, we're seeing Bitcoin consolidating within a clear range, likely preparing for an upward breakout without a significant correction. This scenario is certainly the most bullish one, yet my inherent skepticism doesn't exclude the possibility of a correction before we reach a new all-time high (ATH).
📌 Key points in the current market situation:
The main question now is not whether we'll achieve a new ATH (as this seems almost inevitable) but rather how we'll get there.
Two scenarios are on the table: a smooth upward trajectory without substantial corrections, or an initial correction followed by a strong breakout.
🔖 Profit Maximization Strategy:
Many traders are shifting their attention towards altcoins, tempted by potentially greater returns. However, it's crucial to remember that higher upside potential also means significantly higher risks (low liquidity, increased manipulation, higher volatility).
I have already chosen the tokens that I am interested in for long time
Also now a new narrative has appeared, Internet Capital Markets (ICM) tokens. If you are interested, write in the comments "interesting ICM"
Best regards EXCAVO
Bitcoin: Next Stop is at 144,000Looking at historical data, Bitcoin has experienced similar price growth following the last two MACD crossovers on the weekly chart. We’re now witnessing a third MACD crossover, and if history repeats itself, this could project Bitcoin’s price to around $144,000.
This is a conservative estimate, based on past performance during the middle of previous bull runs. Currently, we appear to be in the final leg of this cycle — which could mean even more upside compared to the previous two MACD crossovers.
What’s your Bitcoin target? Drop your predictions in the comments!
Cheers,
GreenCrypto

Bitcoin - CME Gap fill before going up ?Bitcoin CME Futures have formed a clear CME Gap in the $91,600 – $93,400 zone (highlighted in blue). Historically, these gaps tend to get filled before the price resumes its trend.
Price may dip into the gap zone (91,800–93,400) to fill the imbalance.
We have a entry around the lower part of the gap ($91,800–$92,200).
Stop loss: Below $91,500 to invalidate the setup.
After the gap fill, we can expected strong bullish continuation
Entry: 91600
TP1: 92800
TP2: 93500
TP3: 94500
SL Below 90500
Like and support for more ideas.
Cheers
GreenCrypto

[Bitcoin] bear market !The cycle top was reached in January. I expect the end-of-cycle target to be $32,000 in 2026.
Bear market signals:
- 5 Elliott waves completed
- double top
- bearish divergence
- death cross
- alt coins collapses

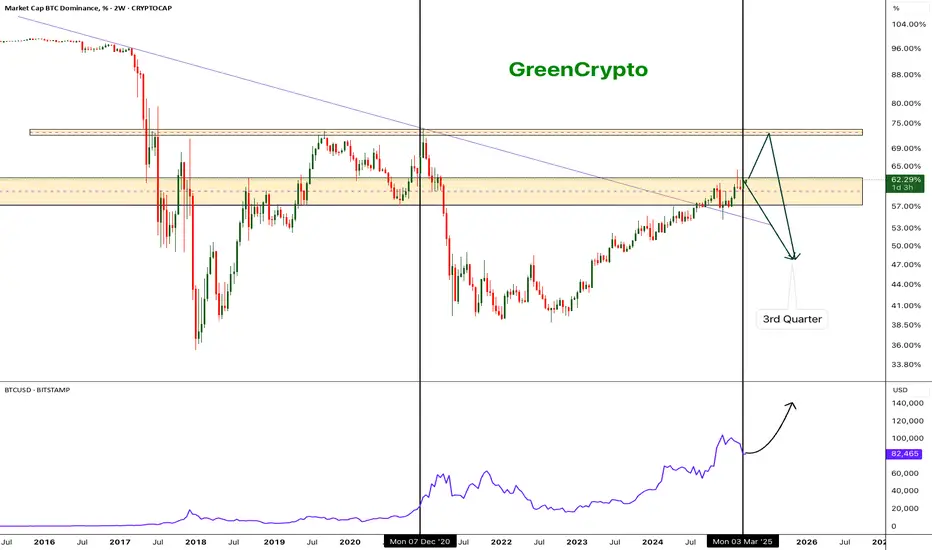
Bitcoin Dominance Nearing Major Resistance – Big Move Incoming!Bitcoin dominance (BTC.D) has been in a strong uptrend and is now approaching a key resistance zone between 65% - 75%. Historically, this level has acted as a major turning point, leading to significant shifts in market dynamics.
✅ BTC.D has broken above long-term trendline resistance.
✅ The 62%-65% zone is a strong supply area where dominance previously reversed.
✅ A fakeout above resistance could trigger a sharp rejection, leading to a decline in BTC dominance.
✅ The projected drop in BTC.D (expected in Q3 2025) aligns with potential altcoin strength, signaling an upcoming altseason.
🔸 BTC dominance could push toward 75% before a rejection.
🔸 This move could coincide with Bitcoin reaching $100K+ levels
🔸 If BTC.D gets rejected at resistance, a sharp drop toward 50% or lower could fuel a massive altcoin rally in Q3 2025.
🔸 This scenario aligns with past cycles, where BTC.D peaked before capital rotated into altcoins.
⚡️ BTC dominance is nearing a make-or-break level – a rejection could mark the start of altseason 2025, while a breakout could further strengthen BTC’s dominance.
💬 What do you think? Will BTC.D break higher, or is altseason around the corner? Drop your thoughts below! 👇
Cheers
GreenCrypto
Bitcoin update 21.03.2025 (6 more months of bull market)Bitcoin Update : 6 Months Left Until the Bear Market
You asked for a Bitcoin update — here it is. I don’t post updates too often because I’m currently focused on developing my academy. But let’s get straight to the point.
Where Are We Now?
There are only 6 months left until the end of the current bull cycle . My vision remains unchanged: we’ve gone through a correction and are now forming the bottom of this move. This is a classic consolidation phase, where the market is preparing for its next big push.
I’m still bullish, but it’s important to remember that we’re in the distribution zone . This means upward movement will be accompanied by volatility and local pullbacks.
What to Expect in the Coming Months?
The next 2 months are likely to be monumental. We’ll see new highs, but in 2 months, most people will have already forgotten about this forecast (as usual). People tend to ignore long-term trends until they become glaringly obvious.
However, publishing exact targets on the chart right now isn’t the smartest move. We might not even reach them, as emotions and news drive the market.
Key Moment: May 2025
In May, there will be a major announcement in the US regarding cryptocurrencies . This will be a turning point. The market is currently moving based on the current sentiment, but after May, things will change. When politicians start talking about crypto, it’s our signal to exit.
My Take
Don’t underestimate the importance of timing. When everyone starts talking about Bitcoin, it’s already time to get out. Until then, we’ll see growth, but keep this in mind: the next 6 months are for closing positions, not opening new ones.
Be prepared for a significant correction after September — more than 50% from the peak . This is a natural process that repeats itself over and over again.
Conclusion
The market moves in cycles. They work like clockwork:
151–152 weeks of growth (bull cycle).
51–53 weeks of correction (bear cycle).
We’re nearing the end of the bull cycle. Act consciously, stay disciplined, and remember that success comes to the patient.
Best regards, EXCAVO
_____________________
Disclosure: I am part of Trade Nation's Influencer program and receive a monthly fee for using their TradingView charts in my analysis.

BITCOIN WILL BE AT 50-60K THIS YEARMake it simple, BTC need to relax a little this year before going much higher. If BTC goes around 100k would be nice to take profits and wait for new lows... USA stock market is having alot of volatility with Trump, I wouldn't be surprised if we see a -20% drawdown in S&P 500!!

Next leg up? Gap just filledThere were a huge liquidity gap around 80k that just got filled. market is ready for another bull run.

BTC Bitcoin update 26 FEB 2025Memes sucked up all the liquidity.
At some point, a lot of crypto experts started screaming left and right that memes are mass adoption and a narrative for the future bull.
I've always said to be careful. That 99.98% of memes are casino, nothing more.
I've had many people start proving otherwise, but when I blow the question that stumps everyone, “If the token has no utility and no product, who will need to buy it when the buyer runs out? What happens to the token when the early investors start coming out ?” There is almost no one with a sensible answer to this.
Believe that everyone will hold the token, no one will lock in profits, and there will be an endless buyer.
To the question of whether you can make money? Yes, you can.
Statistics show that 7% are on the plus side, and 93% of holders are on the minus side. Are you sure you will not be that last buyer?
Today, I read an article about how one popular, successful influencer lost 700k in 3 weeks.
One by one :
TRUMP after Melania
Then crypto futures Ludomania.
After the apartment sale.
And lastly, LIBRA.
0 result, minus health, morals, and several years of life due to stress.
There are a lot of beautiful messages now that so-and-so wallet made so much on memes, so-and-so wallet made so much. Newcomers do not want to invest in fundamental projects; they want to get rich. As a result, they get into risky stories and lose their deposit completely.
Are there many among your acquaintances who have made good money on memes for their entire portfolio? I emphasize, on the whole portfolio of memes, and not once or twice catching the kush, which safely lost on the next bets?
There was leveraged futures trading that zeroed out newbies with no experience, now memes.
The alt season is a bit delayed because if you analyze the wallets, liquidity flows to the 1% of crypto people. And regular fundamental alts are not growing as there is trivially no buyer right now.
As I said earlier, when Bitcoin hits 120-140k.
130-150k, there will be massive profit taking, and more institutional capital will come in. Many people will start to move, and that's where the fundamentals will be bought up, which will cause the emergence of new retail on the crypto market.
But there's something else that needs to happen here.
The masses must be disappointed in memes and lose even more money so that the “new money” will go to the fundamental projects and not to phantoms.
Can I make money from memes? Yes, you can. But remember, you are not an investor here; you are just playing in a crypto casino.
Want more?
Everything is in the link below the chart
Best Regards EXCAVO

Bitcoin is at the crucial stage BINANCE:BTCUSDT (1D CHART) Technical Analysis Update
Bitcoin is currently trading inside the triangle on 1H chart and price is heading towards the support zone. Its crucial that bitcoin holds the support zone around 91K.
if price breaks below 91K then we are headed for a bearish trend. If price holds above 91K then we can expect the current bullish trend to continue.
Follow our TradingView account for more technical analysis updates. | Like, share, and comment your thoughts.
Cheers
GreenCrypto

#BTCUSDT #4h (Bitget Futures) descending channel breakoutBitcóin just regained 20EMA support, printing a three-white-soldiers pattern. Looks good for bullish continuation from here.
⚡️⚡️ #BTC/USDT ⚡️⚡️
Exchanges: Bitget Futures
Signal Type: Regular (Long)
Leverage: Isolated (10.0X)
Amount: 4.9%
Entry Zone:
98356.7 - 97312.9
Take-Profit Targets:
1) 102615.4
1) 106215.9
1) 109816.3
Stop Targets:
1) 93834.3
Published By: @Zblaba
CRYPTOCAP:BTC BITGET:BTCUSDT.P #4h #Bitcoin #PoW bitcoin.org
Risk/Reward= 1:1.2 | 1:2.1 | 1:3.0
Expected Profit= +48.9% | +85.7% | +122.5%
Possible Loss= -40.9%
Estimated Gaintime= 1-2 weeks

Bitcoin Wyckoff Distribution 2025Some very concerning facts which I would like to share with you.
This looks like a perfect Wyckoff Distribution to me and I will also post another chart image below with other things to notice!
I can not post the wyckoff image here but go to this link and look for the SChematic #1 and compare for yourself! www.wyckoffanalytics.com
here the other chart:

Mastering Bitcoin #1In this quick but educational video we delve into the intricacies of Bitcoin's price movements using popular technical analysis tools like Bollinger Bands, Elliott Wave Theory, Triple Moving Average, and Bearish Divergence on MACD and RSI. Learn how these few indicators can help predict what might be ahead for Bitcoin based on current data.
I'm gonna make this into a habit, creating short, educational videos, so expect more of this insightful, bite-sized content going forward.

Run it back Turbo! besides bullish divergence on the weekly and numerous other indications like hashrate, aproaching halving etc.
the probability that we have bottomed out is in my opinion quite high from what i see and feel.
so here i drew some trendlines and a fib circle
the Ellipses are equal size (copy/paste)
they seem dancing around the following fib circles coloured RED.
1st = 1.618,
2nd = 4.618,
3rd = 6.618
i speculate the upcoming 4th = 8.618
added the past halving dates and upcoming 4th halving aprox early Q1 2024
of course this is not financial advise but an idea exploring visible patterns and possible target zones.
let me know your thoughts.

Bitcoin is in new bull run leg!According to wave analysis, the 7-month range in 60k range was the bear market and a new bull cycle just started till the end of 2025.
