[Bitcoin] End of bear marketReminder of bullish factors:
- end of falling wedge
- breakout completed
- huge bullish divergences
- blue pill (Hash Ribbons indicator, not in this chart)
- bottom found (Puell Multiple indicator, not in this chart)
- reversal signal (Network Value to Transactions ratio, not in this chart)
Xbt

BTC LONG MOOOOOOON SOOOOONHello folks
Btc is preparing for a big move
you can long now
target 20,480$
stop 19380$
leverage 3x o 25x
Remember always DYOR

Bitcoin Analyze (Short Term, Timeframe 15min,10/14/2022)!!!Bitcoin is making a Zigzag correction, and it is running in wave C.
I expect the end of wave C will be in the support zone, and then Bitcoin will go up until the resistance zone.
Bitcoin Analyze ( BTCUSDT ), Timeframe 15min⏰.
Do not forget to put Stop loss for your positions (For every position that you want to open).
Please follow your strategy, this is just my Idea, and I will be glad to see your ideas in this post.
Please do not forget the ✅' like '✅ button 🙏😊 & Share it with your friends; thanks, and Trade safe.


Bitcoin: reasons for some possible short-term fallTightening regulation of crypto-exchanges:
- financial audit of the crypto-exchanges;
- the regulator may tighten the KYC procedure;
- only the verified users will be able to trade.
The unverified accounts will be blocked. People will have to provide evidence to prove the origin of funds. This may apply to already verified users too.
Unverified accounts are the first ones at gunpoint.
The essence of this publication is to urge users to take action, prepare in advance for such a scenario and verify their accounts in advance. If possible, prepare documents on the origin of funds in the crypto.
In this regard, the panic sale may occur by another 40-50%. The price will not stay at those levels for a long time . The market will be quickly redeemed. This will be our entry point.

[Bitcoin] 60K in March 2023?The assumption of a large Wolfe Wave shows a potential target of $60K in March 2023. Such a rapid rise has already occurred between October 2020 and February 2021.

[Bitcoin] imminent breakout (update)Bitcoin will soon come out of the huge falling wedge (reversal pattern).

bitcoin - it may be, it may not belooking at the 2018/2019 rounded bottom consolidation and applying the same process to todays price. cup and handle to range high before breaking out

Bitcoin Analyze (Similar movements, 10/10/2022)!!!⚖️In this post, I want to check out four recent movements of Bitcoin.
If you look carefully at my chart, you will understand that movement 1 and movement 3 moved similarly to each other; even in terms of price drop and time, they are almost equal.
As a result, I expect the fourth movement to be the same as the second movement, and we will have at least a +1.66%(top of descending channel) price growth in the 30-minute time frame.
Try to pay attention to how the price moves sometimes; maybe you can find similar movements in the charts.
It should be noted that these four movements were created in the descending channel.
Bitcoin Analyze ( BTCUSDT ), Timeframe 30min⏰.
Do not forget to put Stop loss for your positions (For every position that you want to open).
Please follow your strategy, this is just my Idea, and I will be glad to see your ideas in this post.
Please do not forget the ✅' like '✅ button 🙏😊 & Share it with your friends; thanks, and Trade safe.

Bitcoin Analyze (Short Term, Timeframe 15min,10/10/2022)!!!Bitcoin is running in PRZ(Price Reversal Zone) and near the Trend line; also, we can see the great 🔨Hammer🔨 Candlestick Pattern in this zone.
I expect Bitcoin will go up to the targets shown in my chart.
The correction structure could be Expanding Flat (3-3-5), but it is still too early to tell.
Bitcoin Analyze ( BTCUSDT ), Timeframe 15min⏰.
Do not forget to put Stop loss for your positions (For every position that you want to open).
Please follow your strategy, this is just my Idea, and I will be glad to see your ideas in this post.
Please do not forget the ✅' like '✅ button 🙏😊 & Share it with your friends; thanks, and Trade safe.

Bitcoin Analyze (Short Term, Timeframe 15min,10/08/2022)!!!It seems Bitcoin was able to make a Barrier Triangle.
I expect Bitcoin goes down after breaking the lower line of the Barrier Triangle to the target of the Triangle.
Also, we can see a Bearish Engulfing Candlestick Pattern near the upper line of the Barrier Triangle, and this pattern can verify point E of the Triangle.
Bitcoin Analyze ( BTCUSDT ), Timeframe 15min⏰.
Do not forget to put Stop loss for your positions (For every position that you want to open).
Please follow your strategy, this is just my Idea, and I will be glad to see your ideas in this post.
Please do not forget the ✅' like '✅ button 🙏😊 & Share it with your friends; thanks, and Trade safe.

Bitcoin Analyze (Bearish 🏴Flag🏴 Pattern, 10/06/2022)!!!Bitcoin seems to have made a bearish flag pattern in a month.
The flag pole was created with a strong move down.
The shape of the flag is an ascending channel or rectangle.
Bitcoin is currently creating a twin ceiling pattern near the resistance lines and resistance zone, and if this pattern works, we can expect Bitcoin to break the bottom line of the ascending channel, and the flag pattern will work.
I tried to draw two scenarios for the bearish flag on the chart, and if the double-top pattern is not completed, we can expect Bitcoin to start going down after hitting the resistance lines.
Bitcoin Analyze ( BTCUSDT ), Timeframe 4H⏰.
Do not forget to put Stop loss for your positions (For every position that you want to open).
Please follow your strategy, this is just my Idea, and I will be glad to see your ideas in this post.
Please do not forget the ✅' like '✅ button 🙏😊 & Share it with your friends; thanks, and Trade safe.

Bitcoin Analyze (Short Term, Timeframe 15min,10/04/2022)!!!Yesterday, Bitcoin moved as I expected ✅👇
It seems Bitcoin was able to complete wave C near the resistance zone.
I expect Bitcoin goes down at least to the end of microwave 4 of main wave C.
Bitcoin Analyze ( BTCUSDT ), Timeframe 15min⏰.
Do not forget to put Stop loss for your positions (For every position that you want to open).
Please follow your strategy, this is just my Idea, and I will be glad to see your ideas in this post.
Please do not forget the ✅' like '✅ button 🙏😊 & Share it with your friends; thanks, and Trade safe.

The Case for XRP causing ripplesWhat's up Traders,
The Fundamentals of Ripple:
I'm not going to bore you with the business and use-case for 'Ripple' and their token (XRP) .
You can easily DYOR and form your own Opinions on the matter.
In short:
Ripple and XRP are currently being consulted with and used by a number of large United States and International Banks.
The Chart Technical's:
Ripple showing very BULLISH on the chart. If you know , you know. If you don't, just take my word for it. ;)
PS: Technical Analysis is not an exact science :D
The Alpha you're seeking:
Ripple token (XRP) was de-listed from US exchanges after the SEC filed suit, claiming that the token violated existing securities law.
-- Fast Forward to today --
SEC and XRP have concluded their arguments with the COURT and have asked the Judge to settle the case. By every account and my own interpretation of the proceedings Ripple is poised to win the case, which should enable the otken to be re-listed on exchanges in the US. The headline event itself will bear upside to the token price.
I also anticipate there is 'pent up' American demand. Those willing to 'dabble in crypto, but with less appetite for risk, have certainly shied away from the coin.
Taking on extra risk, you could see a large upside if the court rulings are favorable and I am correct in my analysis above.
My Strategy:
I am currently long XRP/USD targeting .55 as a short term milestone.
a buyer up until around 1.20 where i would re-analyze / TP / or / remain in the trade.
If the bullish scenario unfolds, i expect the coin to trade in excess of 1.50 within 2022.
Good Luck.

Bitcoin Analyze (Short Term, Timeframe 15min,10/03/2022)!!!Bitcoin was able to pass the 5th bearish wave with the Expanding Ending Diagonal Pattern, and I expect Bitcoin to go up to the targets I specified on the chart.
You may be asking if sub-wave 2 is above the beginning of sub-wave 1, so I've put the exact numbers on the chart to say it's not.
Bitcoin Analyze ( BTCUSDT ), Timeframe 15min⏰.
Do not forget to put Stop loss for your positions (For every position that you want to open).
Please follow your strategy, this is just my Idea, and I will be glad to see your ideas in this post.
Please do not forget the ✅' like '✅ button 🙏😊 & Share it with your friends; thanks, and Trade safe.

Bitcoin Analyze (Short Term, Timeframe 15min,9/28/2022)!!!
Bitcoin was able to Double Zigzag Correction at 20385.86$.
Now, Bitcoin is running in microwave A, and I expect that Bitcoin goes up at least to the target that I specified in my chart.
Bitcoin Analyze ( BTCUSDT ), Timeframe 15min⏰.
Do not forget to put Stop loss for your positions (For every position that you want to open).
Please follow your strategy, this is just my Idea, and I will be glad to see your ideas in this post.
Please do not forget the ✅' like '✅ button 🙏😊 & Share it with your friends; thanks, and Trade safe.


Bitcoin Technical Analysis ( Daily Time Frame )#Bitcoin Technical Analysis:-
$BTC currently trading at $19300 Level.
As Per chart We can see Descending Triangle is Forming in BTC daily Chart.
As Per chart Ruls it is bearish and Maximum times it Breakout below side.
But Never Follow Blindly always wait for Confirmation imo.
So As Per chart if Break down $18000 Level then we can see $12800 Level.
But If break out Upward side and Cross $21600 Level then we can see $28400
Never forget to Placed stop Loss if open any Scalp Trade.
Support:- $18,000/$13,000
Resistance:- $28400/$37400


Bitcoin capitulationWhat we need to start an uptrend: breaking through the resistance line = trend reversal and the end of the bearish trend, which lasts more than 50 weeks, as I said in the previous global chart.
Judging from the logarithmic chart, we are breaking through the global support zone and there will be a panic in the market, perhaps not only in the crypto market. We are approaching the support line of a large ascending channel.
It will be accompanied by cascading, avalanche-forced liquidations of the long positions, the bankruptcy of funds, and so on.
We are coming close to the zone of our positions.
There is a possibility that the manipulator (exchanges) will make a short squeeze with a fake breakout of the resistance line before falling. They will collect liquidity from both sides, as it was in 2018 before the fall from 6 to 3.
The scenario fits the Wyckoff and Elliott concept.
Best regards, EXCAVO

Bitcoin Analyze (Short Term, Timeframe 15min,9/27/2022)!!!Bitcoin is running in microwave 4 of microwave C of main wave Y.
Fibonacci: When wave 3 is extended, waves 1 and 5 tend toward size equality of 100% or a 61.8% relation.
I specified the road map of Bitcoin for the next few hours in my chart.
Bitcoin Analyze ( BTCUSDT ), Timeframe 15min⏰.
Do not forget to put Stop loss for your positions (For every position that you want to open).
Please follow your strategy, this is just my Idea, and I will be glad to see your ideas in this post.
Please do not forget the ✅' like '✅ button 🙏😊 & Share it with your friends; thanks, and Trade safe.

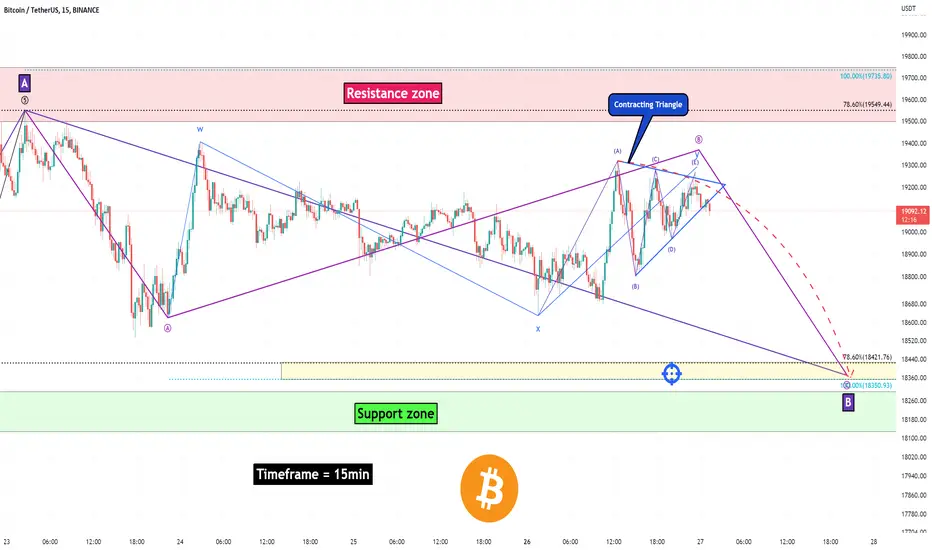
Bitcoin Analyze (Short Term, Timeframe 15min,9/26/2022)!!!Bitcoin was able to break the lower line of the Contracting Triangle. This triangle completed microwave B.
I expect Bitcoin to go down to the target I specified in my chart for completing main wave B.
Bitcoin Analyze ( BTCUSDT ), Timeframe 15min⏰.
Do not forget to put Stop loss for your positions (For every position that you want to open).
Please follow your strategy, this is just my Idea, and I will be glad to see your ideas in this post.
Please do not forget the ✅' like '✅ button 🙏😊 & Share it with your friends; thanks, and Trade safe.
Bitcoin | Head & Shoulders Formation..!!
BTC (Update)
Head & Shoulders Formation in 1D timeframe..!!
So far Bulls have been Defending the Support but In Worst Scenario, If Daily Candle Closed Below the 18.5k Crucial Support then Bitcoin Might REVISIT the 14k Support Area.
Bitcoin Bulls Need to Defend the Crucial Support..🦾
