BTC/USDT : Deviated below $19800BINANCE:BTCUSDT
Hello everyone 😃
Before we start to discuss, I'll be so glad if you share your opinion on this post's comment section and hit the like button if you enjoyed it!
It seems that $BTC has deviated below the $19750's Lower low.
And now, Wanna count it as Monday's low here, Moving to fill the weekend's CME gap.
- The gap has opened from $20470.
So, I'm going to look for a Long around $19850 - 19750 - 19650, Going to use partial entries to average down my entry ratio.
Also, Set a Cater Stop-loss to avoid possible Sweeps below $19550.
Aiming for the Gap's opening, The prime S/R line that located higher above the local high and the higher high at $21810.
Hope you enjoyed the content I created, You can support us with your likes and comments!
Attention: this isn't financial advice we are just trying to help people with their vision.
Have a good day!
@Helical_Trades
Xbt

BTC ideas - long to short betterICT Studying
Bearish BIAIS
but a retracement is due
we could also range for a bit

Bitcoin | Last Bearish Wave Coming Before Massive Bullish Rally!
Bitcoin Bears have been in Complete Control since November 2021.
Bitcoin is Forming Descending Channel in Daily timeframe.
According to Elliott Wave & Descending Channel, We Can See Another Lower Low (15k)
Last Bearish Wave Coming Before Massive Bullish Rally so Be Ready.
Bitcoin Bulls Need to Reclaim the 25-26k Trendline Resistance to Confirm the Channel Upside Breakout.
Please like the idea for Support & Subscribe for More ideas like this and share your ideas and charts in Comments Section..!!
Thanks for Your Love & Support..!!

Bitcoin LTF TA Update#Bitcoin LTF Update:-
#BTC Trying to breakout LTF Resistance.
I am Expecting It will break and Test $21900-$22300
Support:- $20800
Resistance:- $21400/$21900

BTC Wyckoff AccumulationHey guys as you can see Btc is forming a Wyckoff Acculumation !!
IMO Buying from here now is totally safe ...
We can also notice that Btc formed the same structure in the end of 2018 so there is a big similarity in two charts and here is the link to 2018 Wyckoff event
That's what I see for BTC and remember always DYOR

Bitcoin Remains BearishIf daily candles close red we can expect a stronger probability of a continued bear trend. The price will likely take a much more extended period to recover and the bottom will be obvious, there is no strong reason to FOMO bullish just yet. Trade at your own risk.

BTC/USD
I have indicated possible trend reversal levels on the chart. But this does not mean that we will see those regions.
*Please share your opinion on it, write in the comments. Dont forget some cheers bravo. "
Teşekkürler.

BTC: today SHORT under 24000 USDToday I'm expecting Bitcoin (BTCUSD) price will show some impulse down when cross the 82H EMA (23900 USD now).
Also, the Fib Channel level 0.236 (23750 USD now) is very attractive to be broken down.
Entry 24000
Take 23500
Stop depends on your system
Ask for more analysis details in comments.
Higher time frame (4h):
My previous trading idea published on August 9th worked even better than expected!
Boosts and comments are welcome!

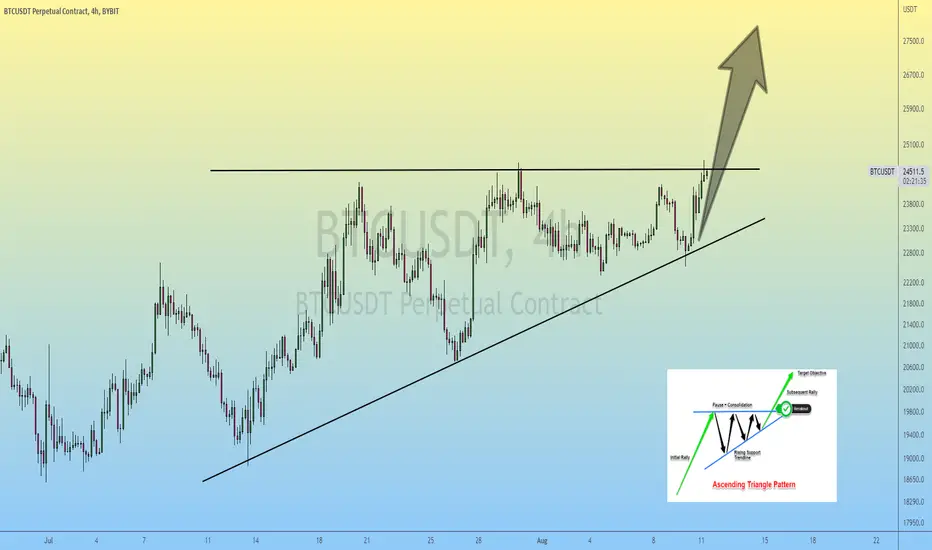
Bitcoin | Ascending Triangle Formation..!!
#BITCOIN is forming Ascending Triangle in 4H timeframe.
If 4H Candle Closed above the $24,560, Expecting +20-25% Bullish Rally.
C'moon Bulls, Send it 🚀🚀
Please like the idea for Support & Subscribe for More ideas like this and share your ideas and charts in Comments Section..!!
Thanks for Your Love & Support..!!
BTC: LONG from 23250 USD short-termBTCUSD:
Open LONG from 23250 USD short-term
With an option to increase position at 23000 USD.
SL under 22700 USD
TP under 24100 USD
Higher timeframe (4h):

Bitcoin Scalp Trade Update#Bitcoin Scalp Chart:-
#BTC Bullish Breakout Confirmed.
Entry:- $23600-$23900
Targets:- $24700/$25200/$25600
SL:- $23240

BTC: Sideway ranging above the 23500 and 82H EMABitcoin (BTCUSD) jumped up the 82H EMA and simultaneously has broken the 23500 USD local resistance level.
Probably, it will hold this range 23500-24500 for the next few days.
In general, Bitcoin is still repeating the S&P 500 (SPX500) movements with slight delay.
So, let's keep an eye on that sweet couple.

BTC vs SPX500: Bitcoin acts more reasonably than S&P 500 nowWasn't thinking I'll ever say something like "Bitcoin acts more cautiously than the stocks".
Yes, I'm talking about the bloody BTC who is terribly known as an extremely volatile and overinflated bubble without any real value.
As we see on the chart during last two weeks, SPX was growing much more rapidly than BTC.
Is there any reasonable excuse for that grow?
Of course, the answer is "NO".
It looks like classic stock markets are overestimating the "positive" messages coming from the states executives regarding the current economy situation.
I'm afraid that very soon we will see the punishment for that blindly-optimistic behavior.
And will use this moment as a good chance and the opportunity.
"Buy when there’s blood in the streets, even if the blood is your own" as Nathan Rothschild probably said.

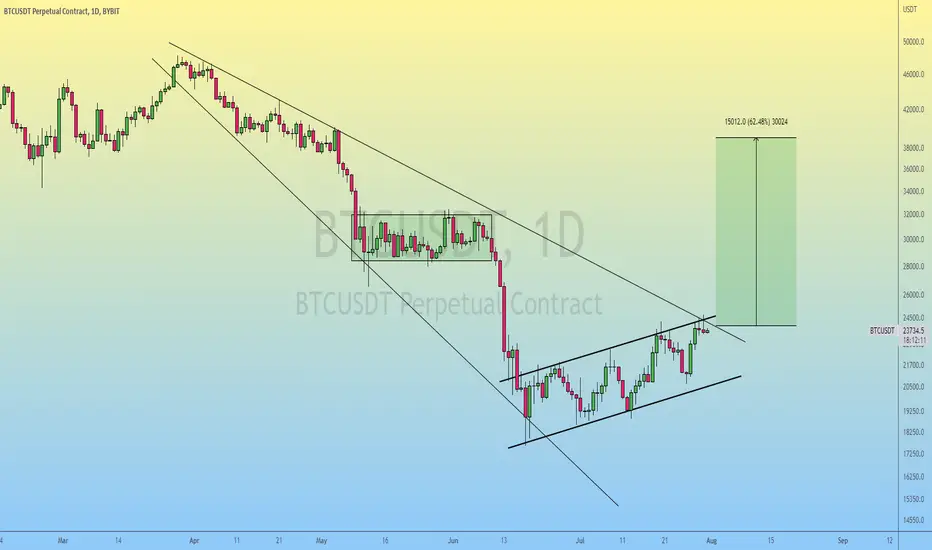
Bitcoin | Make it or Break it..!!
#BTC (Update)
In Daily timeframe Chart, Bitcoin Bulls are Struggling to Clear the Trendline Resistance (24.4k)
Bulls Need to Reclaim the Resistance to Confirm the Wedge Breakout & In Case of Rejection, #Bitcoin Might Retest the 20.8k Support.
A Breakout and close above the 24.4k will open the Doors for a Rally to 40k 🚀
Please like the idea for Support & Subscribe for More ideas like this and share your ideas and charts in Comments Section..!!
Thanks for Your Love & Support..!!
BTC: Bounce down to 82H EMA support short-termBTC: Bounce down to 82H EMA support short-term
On July 27th the venerable executives of the US government have convinced everyone that they see no recession in the economy.
And the markets have believed that quite blindly.
Bitcoin (BTCUSD) as well as many indices were rapidly growing since that moment.
However, we were ready for some correction.
Today, we have caught small decrease from 23900 to 23600 USD.
Probably, later today we will see further lowering from 23800-23900 to 23100-23200 USD area.
Let's keep watching...
Lower timeframe (1H):

Bitcoin $37,000 Target (80% on 10X = 800% Potential)Pretty simple and straight forward...
How are you feeling today?
Who are the winners?
The winners are those who never quit;
The winners are those who persist;
The winners are those who can learn from mistakes;
The winners are those who keep trying even after really bad days!
We see Bitcoin growing by around 80% on the next bullish wave.
We base this prediction on data coming from hundreds of Altcoins charts, multiple indexes both in crypto and tradfi, market cycles, fundamentals & more.
We don't do leverage...
I mean, we do not recommend leverage trading for beginners but we know it is a tool that can be used for profits if one has the right mindset and lifestyle.
You need to be in a stable position in your life to be able to use this tool successfully.
Only after you have been trading profitably for 2-3 years, spot, you can try lev.
We go with 10X because the best time to go big on a LONG, is when we reach bottom not at the top.
You can see the MA200 analysis with the $37,000 BTCUSD target on the chart.
Thank you again for reading.
I am always grateful.
Namaste.

If breakout fails -- more sidewaysThe charts are the result of a brute-force search for similar PA patterns over different timeframes in all of Bitcoin's price history.
Use your human intuition to judge which of these scenarios looks the most harmonious.
Some traders are able to stare at a blank chart for hours until they get a hunch, but I am not one of them.
To synthesize something completely new out of thin air is very difficult, but it is easier to judge if you are given some options.

BTC/USDBoring days with crypto.
You can trade between two lines which acummulation zone.
Or avoid trade with this choppy.
Choose your destiny!
*Please share your opinion on it, write in the comments. Dont forget some cheers bravo. "
Teşekkürler.

Bitcoin Bearish And Stop Loss Also Founded and Bullish only if #bitcoin Technical Analysis Chart:-
#BTC currently trading around $21000
Which was break down $21600 Support level as I warned in Previous Post.
I already Opened Short when #BTC was Break $21600 Level.
Now I am expecting $BTC may test $19,000 Level again.
And New Low also will Depend on $19,000 Level.
So My Short Stop Loss is $22,700
So Now Bullish mode will activate only If $Bitcoin break $24,000 Level.
Otherwise we are on still bearish.
You know what is Best Advantage of Bear Market.?
Every Billionaires and Millionaires Rich because they bought in Bear Market not In Bull Market.
Hope You Understand.
Support:- $19,000/$17600
Resistance:- $22600/$24100b

BTC scam rally>multi zigzag as wave 3 of expanding diagonal to the downside
>rally up 9% to scam pump
>this projection would also form an inverse head and shoulders for a potential bulltrap after the scam rally.
>lead into new moon
>tank

BTC: Rising back to 82H EMA short-termNew week, new analysis, new idea.
This weekend Bitcoin (BTCUSD) has broken under the 82H EMA.
Then retested it and went further down.
Today/tomorrow we could expect another touch of 82H EMA with price rise from 21900 to 22400 USD.
Short-term trade decision is LONG.
Here is the lower timeframe image

Bitcoin Next Move Toward $28300 or $20,000 ..?#BTCUSDT Technical Analysis Chart:-
$BTC currently trading at $21900 Level.
And also Trading at strong support level or Retest level.
Strong Support = $21600 ( Retest )
So What Next…?
After Breakout #BTC testing Retest level at $21600 Level.
So If hold this Level $21600 then We can see $28300 Level.
Very Important Point = 200 Days Moving average which is around $24000 Level.
And Resistance TrendLine Also Acting Resistance.
So I Opened Long Position around $21600 level and Watching this level.
If hold Then BTC May test $28300 Level.
But Keep in mind Another scenario also..?
If Break down $21600 Level then High Priority to touch $20,000 Level.
Super Bearish Below $20,000 Level.
So Never open any trade blindly.
Support:- $21600/$20,000
Resistance:- $24,100/$28300/$31500

Bitcoin New Important Technical Analysis Update#Bitcoin New TA Update:-
$BTC currently trading around $22300
And This is Support zone.
Keep an eye on $21600 support level.
If Hold this support then we can see $28400 and $32000
So Most Important level is $21600
If $21600 Support break down then We can see again $19000 level.
Retest Level = $21600
Support:- $19000
Resistance:- $28400/$32300
