📈Bitcoin (BTC) Jul-22 #BTC $BTCBTC has now broken through the 1-Day MA50 and is being supported by the Ichimoku cloud so BTC's uptrend has been the main trend since mid-June.
The buying and selling force is continuously appearing at the zone of 23000-24000$ and there is no final result yet.
What we need to note is that BTC has officially broken through the $21000-22000 zone and this has become BTC's support zone and BTC accumulation here is possible and will stop loss if BTC breaks through this zone and keep falling.
However, it is highly likely that after losing the uptrend BTC, it will not fall immediately, but will move sideways for a while to end the uptrend of Altcoins before plummeting the whole market to the range of 15000-16000$. This is a bad case for BTC.
Currently BTC is still in an uptrend and the 2 resistance areas we need to pay attention to are the $25,000 and $28000-29000 zone.
Xbt

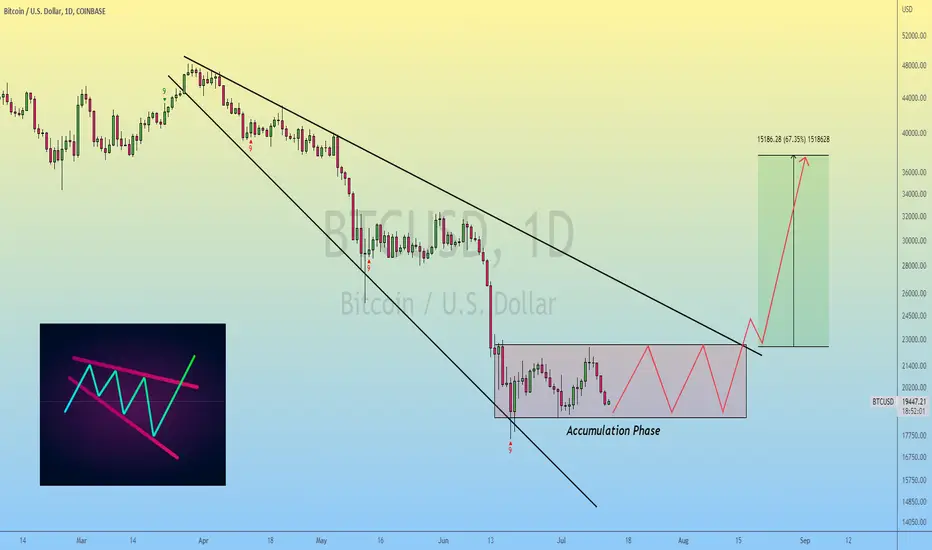
First bullish swing since ages3.5R. I'd say 70% of winning probs. Everything's given, if you want the reasons let's just discuss here or wherever. Have a good day folks

Bitcoin CME GAP Chart (Which Gap Filled First $18460 or $35180)?#Bitcoin CME GAP Chart:-
$Bitcoin Currently trading at $29600
As per Market sentiment Bitcoin is Bearish in LTF and HTF.
As per Data max probably all CME Gap filled.
So now in BTC Chart:-
December 2020 to Till now total 6 Gap in Daily Chart.
CME GAP 1 = $18460 unfulfilled
CME GAP 2 = $23795 unfulfilled
CME GAP 3 = $60165 filled ✅
CME GAP 4 = $48370 filled ✅
CME GAP 5 = $32930 filled ✅
CME GAP 6 = $35180 Unfilled
So Now Three CME GAP still Unfilled so Which Gap filled first..?
CME GAP 6 = $35180
Or
CME GAP 2 & GAP 1= $23795 & $18460
Now Bearish Pennant in Daily Time frame so I am expecting Below GAP filled first but another High time frame LL-LH Pattern is forming so Expecting Upward side GAP also filled first.
So I will solve Your Problem.. :-
If Bitcoin Daily Candle close above $30500 then Upward side GAP ( $35180 ) will filled first
But If Daily candle close below $28500 then Downside GAP ( $23795 & $18460 ) filled First.
Hope you Understand and Learned from My chart.
So Please don’t forget to Like and Share.

Bitcoin CME GAP Chart ( My $23795 & $18740 GAP Filled )#Bitcoin CME GAP Chart:-
$Bitcoin Currently trading at $22,000
As per Market sentiment Bitcoin is Bullish in Lower Time Frame.
And Two CME GAP $23795 & $18460 GAP filled after My Chart Post.
As per Data max probably all CME Gap filled.
So now in BTC Chart:-
December 2020 to Till now total 10 Gap in Daily Chart .
CME GAP 1 = $18460 filled ✅
CME GAP 2 = $23795 filled ✅
CME GAP 3 = $60165 filled ✅
CME GAP 4 = $48370 filled ✅
CME GAP 5 = $32930 filled ✅
CME GAP 6 = $35180 Unfilled ❌
CME GAP 7 = $11205 Unfilled ❌
CME GAP 8 = $9665 Unfilled ❌
New CME GAP = $28740 & $35180
Imo this Time $28740 GAP will filled First.
So Now Three CME GAP still Unfilled so Which Gap filled first..?
CME GAP 6 = $35180
Or
CME GAP 7 & GAP 8= $11205 & $9665
Hope you Understand and Learned from My chart.
So Please don’t forget to Like and Share.

Bitcoin New Trade Setup with Stop Loss#Bitcoin Technical Analysis:-
#BTC strong support at $19500 so Above this level is Bullish toward $28000
But If failed to hold $19500 then we can see New low.
Support:- $19500
Entry:- $19500-$20k
Targets:- $28300/$31500
SL:- $19k

Bitcoin 8% Up from Our Entry Zone still 50% Potential upward#Bitcoin Profit Update:-
$BTC currently trading at $21000 and 8% Up ( Spot ) from Our entry.
My Long Position 36% Profit with 5x Leverage.
Breakout + Retest = Done ✅
Targets:- $22000/$28,000/$31500
Stop Loss:- 19,000 ( -2% Below our entry )
Hope you are Happy with My Analysis.
Keep Supporting.. ❤️❤️❤️

Bitcoin HashrateI paid attention to the Bitcoin Network Hashrate.
It seems that the fall has not even passed into the active phase.
Industrial private miners are still hoping for price recovery and do not turn off their equipment.
People bought many ASIC miners for tons of credit money.
BTC Hashrate = -27% after the shutdown of miners in Texas.
Best regards EXCAVO

Bitcoin | Accumulation Phase & Broadening Wedge..!!
#BTC (Update)
Bitcoin is forming Descending Broadening Wedge in Daily timeframe.
Majority of Traders/Influencers are Talking about 10k-12k-14k But imo, Bitcoin will Remain 18-22k S/R Range for Next Few Weeks & Broke the Broadening Wedge in Mid August & hit the 38-40k Key Resistance in Late August/Early September So Keep Accumulating the #Bitcoin 👊
What'a About #Altcoins Sir??
Altcoins Look Good & Ready to Fly 🔥🚀
If #Bitcoin Remains CALM Between 18-22k Range for 3-4 Weeks, We Could See Altcoins 30-40% Rally..
Please like the idea for Support & Subscribe for More ideas like this and share your ideas and charts in Comments Section..!!
Thanks for Your Love & Support..!!
All the support is at 10K. Bear market ending November.Fractal of previous bear market, we can test the .618 at 10K, but need to continue up from there. Hedge your bets with this chart.

Return of the King v3Updated dominance idea. Perhaps bitcoin is going to survive this bear market at these levels while the alts capitulate. Else bitcoin moons and alts stagnate.

WORST SCENARIO FOR BITCOIN IN 2022-2023This is my worst scenario for BTC, I think is probably but first we have to go around 30k for BITCOIN.
Let me explain you easily, we are in a bear market all this year, Bitcoin price has a downtrend and it could go up only if really breaks levels showed in the chart.
Indicators aren't good in daily candles, overbuy in Bollinger Bands and Divergence in MACD says we could go down sooner than go up.
In my opinion, we will visit 20k before go around 24-25k, then $BTC will accumulate around those levels and hit 30k before go down again to 20k and lower... 14-12k its possible.
Let's see what happen... 16-19k very possible this year 2022 for bitcoin and only 12-14k will be the bottom in my opinion in 2023!!!
GOOD LUCK YOU ALL BITCOINERS!!! I WILL BE BUYING AND HODLING, NEVER SELLING BITCOIN!!!!

BTC/USDOn chart clearly we see 55EMA sign as ressistance. And Adam&Eve show sign bullish.
We will see some pull back. Then BTC will go next acummulation zone area.
*Please share your opinion on it, write in the comments. Dont forget some cheers bravo. "
Teşekkürler.

BITCOIN WILL GO TO 30K SOON! LONG BTCBitcoin is accumulating right now and its ready to PUMP hard imo.

XBT Long for a bit and then lets seeXBT LONG
BITMEX:XBTUSD
XBT has a strong bullish divergence and will possibly go up for a bit. We could see a pullback to the 24 000 area or even to the 28 000 area. I am bullish for now, lets see guys :)
happy trading to all of you

BTC in a diagonal?The current trend of BTC is very weird. What was once a possible wave 2 pullback is now invalidated and where is we going now?
The structure of Wave C to me looks weird to be a regular impulse and could be a potential diagonal. If this is the case, the final target of w5 of diagonal matches nicely with the 50% retracement of the last major impulse to the downside before this ABC correction.
Just an idea and we must see an overlap of w1 and w4 before we consider this as a promising alternative & subwaves matches the bigger structure

Bitcoin Next Move Toward $31500 ..?#Bitcoin Short Update:-
$BTC currently trading at $21950
Currently trading around 200 Days EMA Resistance.
If Break $22,000 Price level then we can see easily $31500 Level. Which is High Resistance level.
Breakout = $20700 ✅
Retest = $20,000 Pending
200 Days EMA Resistance:- $22700
HTF Resistance = $31500
Support = $20,000
Personally, I am expecting Bitcoin Next Move Toward $31500
What’s About You..?

Bitcoin Exclusive Long Term Update #Bitcoin Technical Analysis:-
$BTC currently trading around $20,000
And Trading above 2017 All Time High.
So Keep an eye on this Level because If Hold This level then we can see $29000 ( Upward Resistance Level )
Most Important Level for Trade:-
1)- If BTC Break $21000 upward then we can see $29,000 Level.
2)- But Currently $19,000 is good Support if Break this Level then ready to buy around $12,000-15,000
Previous Head & Shoulder Pattern Target ( -45% ) has been successfully Achieved.
My Strategy:- Buy at Every dip and sell around $200k in Year 2025

If The People Will Not Buy Bitcoin, Who Will?It is a failed argument to say that people will not buy Bitcoin.
It fails because that is not the way the system works.
Cryptocurrency opponents can say that people are not going to buy Bitcoin because of the hard times, because the markets are crashing, because of war, problems with the international supply chain of different products as well as general sociopolitical instability brewing all around us.
So, the detractors would say, people will not buy Bitcoin, it will continue to drop forever because there is no money from the populace to buy and pump Bitcoin up.
It is a failed argument because the people doesn't necessarily decide Bitcoin's price.
"The people" is obviously an important factor but only one of hundreds of variables that are always affecting the market.
The movement starts with the ultra-smart money, in this case the top market insiders.
The exchanges, the miners, the big corporations, developers and project owners; these are the initial buyers.
Large players, whales, countries, institutions and the likes follow...
Bitcoin is going up now but this phase can still take years.
After years, Bitcoin goes back to its previous all-time high (say around mid/late 2024), and that is when the people will start to pay attention once again to Bitcoin and start buying up.
We say Bitcoin will go up very soon...
It is normal to go from the worst ever to good, it is the only way possible that it works.
The market only recovers after it hits bottom.
Always when at the bottom, it is the worst.
It doesn't matter what the current market sentiment is...
It doesn't matter what the news are saying or what one believes is happening or what is going on.
BITCOIN WILL RECOVER!
It will take a while...
But it will grow for years to come.
Namaste.

Whats next for bitcoin?Currently looking for a potential wave 4 on btc. Price looks to be playing an accumulation. Once confirmed, looking for 20500 at the 38.2% fib level + liquidity grab

Smashing DeathWe can all sit here and argue about when it's going to happen , just follow the trend.. Don't try to catch knives it's not the time with all the crap going on in the world , macro lens is very Bearish even if it's oversold in shorter timeframes. Don't lose the bigger picture, the bottom is not in what you do from there is your choice; you either try to short bounces or you try to buy lows.
Eitherway we are going down , be prepared and don't neglect the trend until reversal is confirmed or you feel like gambling.
Inverse Short Time Frame Chart.

Bitcoin 10X | Triple Up! (Full Trade | 366% Potential)Bitcoin continue holding strong near resistance.
We continue bullish with a higher low.
We are active with 10X leverage.
Remember leverage trading is ultra-high risk.
For experts only.
One can get liquidated.
This is not financial advice.
If you can't take a loss, you can't trade.
Some we win...
Others we lose.
That's the game.
Feel free to hit like for more.
Full numbers below...
---
LONG XBTUSD
Leverage: 10X
Buy-in: $20,222 - 21,100
Targets:
1) $24,100
2) $26,000
3) $27,400
4) $29,320
Stop-loss: Close daily below $20,000
Liq. price: $19,243.5
Potential profits: 366%
Capital allocation: 8%
---
Namaste.

$BTC/USD 1M (#Index) Ascending trendine on supportBitcoin is pulling back to 50MA (monthly) where a bounce would make sense like it happened in 2018 and 2015 as well!
RSI looks very bottomed (new ATL) and this seems enough to buy Low in order to sell High later this year, or at the beginning of the next one.
But first comes the boring part for 5-6 months of ranging and choppy moves, better be very patient..
Current Price= 22006.84
Buy Entry= 22000 - 18881
Take Profit= 52825
Expected Profit= +158%
Fib. Retracement= 0.786
Margin Leverage= 1x
Estimated Gain-time= 9 months
Tags: #BTC #BTCUSD #XBT #WBTC #BTCB #Blockchain #PoW #Mining #Satoshi
Website: bitcoin.org
Contracts:
#Mainnet
#ERC20 0x2260fac5e5542a773aa44fbcfedf7c193bc2c599
#BEP20 0x7130d2a12b9bcbfae4f2634d864a1ee1ce3ead9c
#BEP2 BTCB-1DE

Bitcoin 8% up in Spot and 30% in My Long Leverage #Bitcoin Inverse H&S Pattern:-
#BTC 30% Up My Long Positions.
Now Still I am Expecting $25800 is my 1st TP and $27500 & $31500 also after Hit TP1.
Now Must Need to Breakout $22000 Supertrend Resistance for $2k-$3k Candle
