Bitcoin Since the last analysis, the situation has not changed so much. We touched the support line and still haven't broken the falling LL-LH structure. The nearest resistance is around 40500. They can take liquidity below the red zone and go up after that. Keep an eye out for more updates.
Best regards,
EXCAVO
Xbt

Bitcoin Higher High & Higher Low Pattern Analysis chart#Bitcoin HH & HL chart pattern Analysis:-
$Bitcoin currently trading at $35800
This is also trading below support level so Not bullish right now.
I am strongly bullish only above $42000
So now Waiting BTC break Higher Low or Not.
If Break HL then ready to buy bitcoin at cheap around $20000-$22000
But If hold this $32900 level then ready to Next new Higher High around $75000
In Simple for you:-
Below $42000 = Bearish
But Higher Low Point = $32900
So this is also Very Important to last Bull hope.
RSI = RSI also Bearish and We can se it will test 30 level also.
And this will be Bitcoin Bottom Level.
Most Important = Watch RSI Breakout Point Closely.
Hope you understand in very easy Language guys.
Please Like and Share and Comments.
Thank you.

THERE IS A STRONG SUPPORT AT $30K FOR BITCOINHere we go again... $BTC
As I said last time with Bitcoin, we are going to $30k very possible next months because it needs accumulate at those important levels!
Important investors and real long term investors are buying right now bitcoin for sure, but they are more ready for buy #bitcoin cheaper!
This year is great for accumulate $BTC and good crypto projects!! Don't miss it, remember buy low and sell high :) NEVER buy high and sell low!!!
ALL MARKETS ARE DOWN, JUST KEEP CALM AND BUY BITCOIN EVERY WEEK/MONTH... (DCA)

Bitcoin Dumped as My analysis hope you earned and save. money#Bitcoin Chart
Hope you saved Your hard-earned Money from Fakeout.
yesterday Many Posted Breakout did but hope you followed cryptopatel
Congrats on huge Profit from Short Positions
Now Still bearish and Below $38000 #BTC super Bearish so Don't open any trade blindly
#crypto

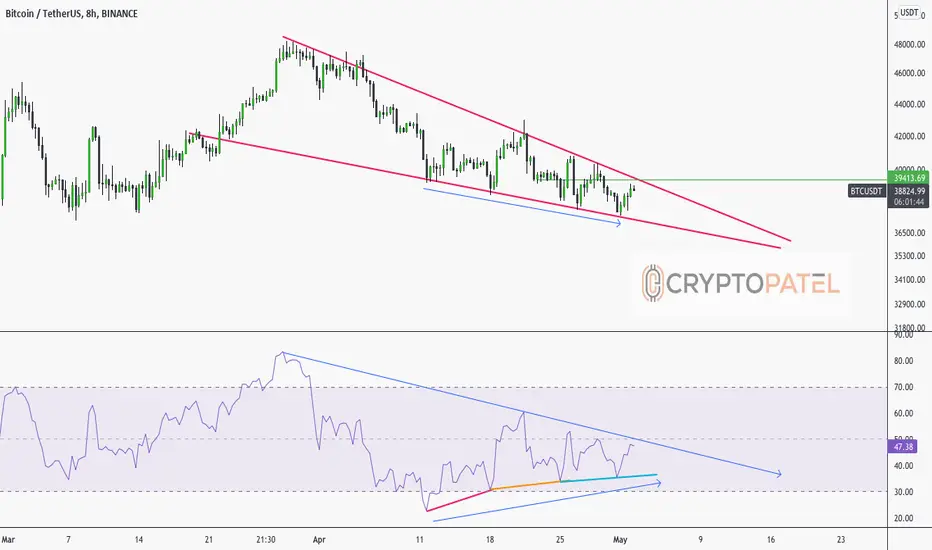
Bitcoin Perfect Bounce as per Chart and Next move?#BITCOIN 8H Chart:
#BTC perfect shot
Now?
If Breakout $39400 Level then we can see $42200 & $47600
But
If rejected then Ready for another Down Leg
- RSI Bullish Divergence in LTF
- Bullish Breakout Point $39400
- Bearish Breakout Point $37k
As per chart we can expect Bullish if breakout $39400-$39600 level.
if you want to open any trade then wait for solid confirmation.
Never trade blindly.
Below $37000 is also downside confirmations.
in Simple if break $40000 level then We continues Bullish Path otherwise Ready for $20000-$23000
Never Panic about this.
I am very bullish on Long term.
I will more buy in bear market.
DXY & Bitcoin Correlation ( $300 Target In 2025 )DXY V/s Bitcoin Correlation :-
TF:- 2W
✨DXY is currently at $103 Level.
✨Multiple Price Rejections are seen from Support & Resistance zones.
✨RSI bearish Divergence is also seen, While RSI is in OverBought levels.
✨Bearishness is expected in DXY by looking at Current Price Action.
✨We need to wait till the confirmation of Price Rejection from the Resistance zone .
✨ If the Price reject then it can go to the levels of $95 , $93 or $90
✨ For Bullishness in DXY = Price needs to give a Breakout of $103 level with Strong Bullish Green Candle and should give closing above it.
✨If DXY gives a Breakout, Then the Price can go up to levels of $115 - $120 or higher.
Conclusion =
= If DXY Breakout Above $103 Mean Bitcoin Super Bearish and Target would be $25000-$30000 Again.
= If Rejection as per the chart then we can see Bullish Mode Continues And Target would be $52800/$100k
Folmula = Y = 1/X
Where Y = DXY
and X = Bitcoin
Thank you for Reading.
Don't forget to Like and Share.
Show Some love in the Comments.

Bitcoin | Falling Wedge + Bullish Divergence + Channel..!!
#BTC (Update)
Bitcoin has been Consolidating into Ascending Channel since January 2022.
From last 4-weeks, Bitcoin is Moving inside the Falling Wedge.
RSI is Printing Bullish Divergence as Well.
For Bullish Momentum, Bitcoin Bulls need to reclaim the 40k S/R Level to Confirm the Upside Breakout.
In Bullish Case, If Bulls Reclaimed the 40k S/R Level then Bitcoin Might hit the 50k Psychological Level.
In Worst Case, If Channel Broken Downside, then We Could See Bearish WAVE towards the 28-30k Major Support Area.
Please like the idea for Support & Subscribe for More ideas like this and share your ideas and charts in Comments Section..!!
Thanks for Your Love & Support..!!


Bitcoin Trading Short Update#Bitcoin LTF Update:-
$BTC currently trading at $40400
Strong rejection from $42223 level.
Now..?
I am expecting Again bounce back from this level.
Entry Will be $40000-$40500
Targets:- $42300/$45000/$52800
Stop Loss:- $38500
Never do Gambling guys.
Market us very Volatile so Always open safe trade with tight Stop Loss.
Support:- $39500
Resistance:- $42300/$45000/$52800

Bitcoin | Next Bull Run is Loading..!!
Next Bitcoin Bull Run is Finally Loading so be Ready Guys..!!
Buy the Bitcoin dip between 30-40k and Hodl BTC With Patience..
Patience is the Key & Always Pays off.
Please like the idea for Support & Subscribe for More ideas like this and share your ideas and charts in Comments Section..!!
Thanks for Your Love & Support..!!

Bitcoin Perfect Entry Point and Waiting for a Perfect Target#BTCUSDT TA Update:-
$BTC Long Term Spot Analysis :-
- Bitcoin Currently trading at $41400
- Strong bounced back from Support level $38000
- Many Long and Short Traders Liquidated in this recent Pump and Dump.
- I am expecting Big Upward move from here.
- Never open any trade Without Exit plan.
- 1st Resistance is $42000
- If break This level then we can see $48000
- Last Target of this Channel could be $52800
- HTF ( High Time Frame ) Forming Bear Flag in Bitcoin Chart.
- So $52800 Is very Important level for Bull and Bear.
- Fir me Bear Flag Target is $24000
- $100k Target only activated of BTC break $52800 Resistance level.
- For now I bought some BTC around $40000 ( Spot )
- My Stop Loss is $38500
- Perfect Chart of HH & HL
- 400EMA Support:- $35065
- 200EMA Resistance:- $42467
Never Trade Blindly.
And Never Trust on Moon Boys.
Always open any trade after Confirmation.
Support:- $37000-$38000
Resistance:- $42000/$48000/$52800

Bitcoin can drop to 30000 levelsBeware, if bitcoin is going to fail again, it can be sharp drop to, 30000 levels. We can smell it when we've seen a failure impulse.
btw, more hikes can push bitcoin lower as long as it is chained to the NASDAQ

Bitcoin 11.04.2022Bitcoin is moving in an ascending channel that is the bear flag in a downtrend. Shortly, I expect a price correction to the support line and premium Fibonacci levels around 0,705. The average BTC purchase price of many large funds is around these levels. I think we will grow up to the 50-52K zone in May, and by the summer it will go for a correction to 30K.
Best regards,
EXCAVO

Bitcoin Current Trading Update For Long or ShortBTC/USDT TA Update:-
Timeframe:- 1D
- BTC is currently trading at $39800 Levels.
- BTC is forming Higher highs & Lower highs,
On an Uptrend Trend line.
- Price is taking a correction toward Trend line Support by following Counter - Trend line.
- Wait for the price to Break Counter - Trend line for the confirmation of the Upcoming Impulsive move.
Entry :- $40400
Stop loss :- $38400
Target :-$46100

$BTC/USDT 1h (#Bybit) Falling broadening wedge breakout & retest⚡️⚡️ #BTC/USDT ⚡️⚡️
Exchanges: ByBit USDT
Signal Type: Regular (Long)
Leverage: Isolated (3.0X)
Current Price:
39921.0
Entry Zone:
39925.0 - 39471.0
Take-Profit Targets:
1) 40764.0
2) 41746.0
3) 42459.5
Stop Targets:
1) 38806.0
Published By: @Zblaba
Bitcoin looks good for short-term recovery after showing some clear reversal signs!
Risk/Reward= 1:1.2 | 1:2.3 | 1:3.1
Expected Profit= +8.07% | +15.48% | +20.88%
Possible Loss= -6.75%
Fib. Retracement= 0.382 | 0.618 | 0.786
Margin Leverage= 3x
Estimated Gain-time= 3-4 days
Tags: #BTC #BTCUSD #XBT #WBTC #BTCB #Blockchain #PoW #Satoshi
Website: bitcoin.org
Contract:
#Mainnet


BTC/USD : Into Monday's range BITMEX:XBTUSD
Hello everyone 😃
Before we start to discuss, I'll be so glad if you share your opinion on this post's comment section and hit the like button if you enjoyed it !
Formed the Monday's range; But didn't sweep the lows before the leg-up which makes the possibility to have a dive into Monday's low again !
That's why I mentioned two scenarios on chart !
I'll wait for $40600's S/R zone to react,
- If we get the rejection, Then It'll sweep the lows at $39200 and even lower on $37500's support line.
- If we get the break-out, Then I'll take my long till Monday's High or even you can wait for the sweep to located your Shorts.
💹 Also you can have your taste of Long If $BTC tries to pullback from any sweep of Monday's Low.
For now I just play the range; When $BTC unfolds more PA, Then I'll try to take advantage on other options into the LTF charts.
Hope you enjoyed the content I created, You can support us with your likes and comments !
Attention: this isn't financial advice we are just trying to help people on their own vision.
Have a good day!
@Helical_Trades

Bitcoin (BTC,XBT) - I'm bullish, give me a reason not to be. Bitcoin Weekly Chart.
Bitcoin bounced directly off the RED 200day MA, as long as it stays above the WHITE 50day MA I don't have a reason to be bearish.

Bitcoin Supper Bull Market Is coming So Which is Best BuyingZone#BTCUSDT Exclusive HH & HL TA Update :-
Timeframe :- 3D
- BTC is currently trading at $39600 levels.
- In High Time frame ( 3D )
Price is moving in a Bigger Channel forming Higher highs & Higher Lows ( in yellow color )
- Inside the Bigger channel ...
Price is consolidating in a Smaller Channel.
Making higher Highs and Higher Lows ( in white color ).
- If the price breaks $34322 ( White HL )
Then, there will be the beginning of the Bear cycle and More bearishness will be seen in #BTC
- If BTC holds $35000 levels,
Then a target of $50000 as a New Higher High is expected.
- If BTC breaks Mini Channel on Upside then more Bullishness will be seen and Higher Targets of $82500 can be achieved.
- With the continuation of this Bull cycle,
If BTC Breaks the High Time Frame Bull cycle ( Breaks $82500 levels Upside ) then the Super Bull Cycle is expected with much higher Targets ( $150k-$200k )
For Me which Strategy I am Currently Doing ..?
I am Buying in Spot every Dip.
And holding strong with my confirmations.
If Break below $34322 then I will exit in Loss.

BTC - Short-term bullishBTC looks to have had a change of character in the lower time frame. Looking for bullish continuation for the short term before moving down harder.

bitcoin possible bottompossible bottom on BTC here. stacked bid below here all the way down to 40k. down more than 40% frrom ath. there is a lots of fear in the crypto markets right now which is usally a good time to buy. long spot frrom 41.9k

[Bitcoin] next movesThis trend hypothesis is the result of several analyses : charting, Fibo retracements, divergences, nested cycles and fractal analysis.

Bitcoin 37% up from My Fractals Analysis#Bitcoin TA Update:-
$BTC currently trading at $47500
As I told you $Bitcoin bottom was $32900
Now hope you happy with my analysis.
I explained everything that time when all global market were panicked.
Now 37% up bitcoin from my levels.
And same fractals worked.
Still my Target is $52800 and $69000
Very Important point = $69500
If this level $69500 break then ready to see Bitcoin price around $150k
Now $44600 strong resistance because strong support.
Support:- $44600/$38000
Resistance:- $52800/$69500
