Bitcoin hit our Target and Now ready for Big Bull#BTC/USDT TA Update:-
$BTC currently trading at $44000
#Bitcoin hit our Resistance level.
Hope you enjoyed my analysis.
Now..?
$44600 is Strong resistance level.
If break this resistance then We can see $52800
$44600 This is very Important point so Keep an eye on this level.
What Will happened if Rejected from $44600 resistance level..?
If rejected then $38800 is very strong support.
Which must be hold.
Support:- $38800
Resistance:- $44600/$52800
Xbt

BTC Moving Average SimilarityHello, the daily chart shows similarities of Bitcoin moving average price lines. In this case, I think we will enter a bull trend just like at the end of July. The only difference between July and the current situation is that the Stoch RSI lines are not exactly similar.(NOT INVESTMENT ADVICE)

Bullish $btc into aprilWe either reverse the bear cycle and get into local highs or melt back into the 30s and possibly discover new relative lows. Next couple weeks will be huge for btc.. Im betting BULL.
The bullish targets on this chart are conservative, and for scalpers.

Revisiting BTCTime to start dusting down our BTC charts...
It's been a few since we've looked at this in great detail, time to dig deeper and pick out some key areas to start monitoring for doing business in
From a waves perspective, despite the retrace, Buyers are in full control with $218,000 now the next target in the crosshairs.
XBTUSD directional bias also has very important characteristics and implications for a retreat in US hegemony with further instability across democracies expected until we (the people) decisively level up our technologies, voting systems etc.
Eyeballing momentum for later this year as we advance into this new world via CBDCs. Grab what you can. Preemptive positioning and loading at current levels is the name of the game.


Bitcoin Short Update#Bitcoin
#BTC still holding $38900 support level.
$37500 also good support.
Keep an eye on both support level.
Bull zone only above $44600
Extremely bearish = Below $34500

Bitcoin | Accumulation Phase Continues..!!
Accumulation Phase for $BTC Continues..!!
Bitcoin has been Consolidating Between 35-45k Range from last 2-Months.
If Bulls Cleared the 45k Resistance, According to Market Phases, Next Will be Mark Up/Uptrend Phase..!!
📍 Always Wait for Confirmed Breakout & Candle to Close and Only then ENTER..
Please like the idea for Support & Subscribe for More ideas like this and share your ideas and charts in Comments Section..!!
Thanks for Your Love & Support..!!

Bitcoin Pumped and 11% up from our entry#BTC/USDT TA Update:-
Entry:- $37500-$38000 filled ✅
11% up from our entry.
Now..?
$41800 is strong resistance.
If it will break then we can see $44600 and 52800
But if Rejected then again we can see $37000 level.
Very Strong barrier = $44600
Support:- $39000/$37000
Resistance:- $41800/$44600

Bitcoin BTC: Precise date and top calculation for this cycleSo I was thinking again, and it might be that my last idea here () was too simplified.
It seems the cycles are getting overproportionally longer.
Also, it seems that the tops are diminishing more than previously thought.
I take all cycles exactly from the previous halving days, except the very first cycle, starting day there is of course when BTC started trading on Mt.Gox in 2010.
I overlay exactly with the halving date 11th of May 2020.
We then calculate the ratios of the cycle lengths, and continue the trend. We thus get 956 days of length for this cycle, which would put the top to December 23rd, 2022. 1 year away.
We can do the same for the top ratios and find that if this trend was to continue, we would get 228k USD as the top.
So, I repeat: 228k on December 23rd 2022.
This is another possibility, a more conservative one than my last simpler one, where I arrived at around 300k by June 2022.
Maybe also, it will be somewhere in between, so 250k in October 2022 or something like that. I see both these scenarios as the boundaries of an interval range where it could end up being.
If the cycle will still be one year more to go, then it is possible that we could get a shakeout scenario as drawn in the red line, people should be prepared for such an event, it is entirely
possible because a lot can happen in one year. We remember that BTC dropped in early 2020 from 10500 to 3900 and then went into a rally to over 60k. Ok, this was a black swan event,
but we should be prepared that something similar might happen, because BTC likes shaking out people.
That is now my current picture. Should it change, I will post.

BTCUSD 4H Bitfinexsimple chart with levels we gonna play this month
liquidity based on KF
YO
MO
Have fun!

Bitcoin Dumped as support break downBitcoin:-
After break down already entered in bearish zone in LTF
Support: $37400/$36500/$34600
resistance: $40000/$42800
Bullish above $40000
Bearish below : $34600

Bitcoin Head & Shoulder Pattern update#Bitcoin Exclusive Technical Analysis:-
#Bitcoin is currently in a Rance of $35000 to $39000 due to global geo Political Circumstances.
As I predicted Bitcoin Hit Our Right Shoulder Resistance $39300
And Dumped from Resistance As I mentioned.
Now..?
$35500-$36000 is key level Support ( Neck Line Support)
If hold this than we can see upward rally.
Otherwise if break down $35000-$36000 level
Then we can see $29700 level.
Which is High Demand zone.
Support:- $35500
Resistance:- $39500

Bitcoin Exclusive Head & Shoulder So Reversal Expecting Bitcoin Exclusive Technical and Fundamental Analysis:-
#Bitcoin is currently in a range of $36,000 to $37,000 due to global geo political circumstances.
and
right now the best this is it is fully respecting the major strong support of $36,000 that is also Daily Demand zone.
We have witnessed a sharp fall and correction in last couple of weeks.
BTC 12-Hour Chart perfectly forming Head & Shoulder pattern,
and
completed Left Shoulder part made high of $39,285 and Head Made high of $45,850.
Now if it follows perfectly we can expect BTC to make high of around $39,500 in right shoulder with a crucial Neck Line Support of $36,000 which hold is a must to full fill the pattern to work.
So let’s wait for BTC confirmation.
Long Term Trend Line already broke out and $36,000 range is perfect for Retest level.
It’s not a financial advice just a research, Do your own research before opening any position.
Thank you
With Love,
CryptoPatel

Bitcoin to Move Lower to 30KTrend Analysis
The main view of this trade idea is on the 4-Hour Chart. The cryptocurrency Bitcoin (BTC) is in a descending triangle setup with the resistance trendline observed around the lower highs of 70K and 59.2K and the support trend line is seen around 40K. Initial breakdown from 40K will take BTC towards 30K. A negation of this view will occur if BTC crosses above 60K.
The longer termed Daily Chart shows a similar move lower for the cryptocurrency. BTC is currently in sell mode with support observed at the 40K and 30K price levels.
Technical Indicators
There has been negative crossovers on the short (50-MA), medium (100-MA) and long (200-MA) fractal moving averages. The cryptocurrency BTC is currently trading below the respective moving averages (Mas). The RSI is below 50 and is re-testing oversold levels. The KST is also in a sell mode.
Recommendation
The recommendation will be to go short at market, with a stop loss at 60K and a target of 30K. This produces a risk/reward ratio of 1.39.
Disclaimer
The views expressed are mine and do not represent the views of my employers and business partners. Persons acting on these recommendations are doing so at their own risk. These recommendations are not a solicitation to buy or to sell but are for purely discussion purposes. At the time of publishing I have exposure to BTC.

Bitcoin | Descending Channel Retesting in Process..!!
#BTC (Update)
In Daily timeframe Chart, Descending Channel Upside Breakout has Already Confirmed, Retesting in Process..
In Case of Successful Retest, Expecting a Bullish Wave towards the 51k..
📍 Always Wait for Confirmed Breakout & Candle to Close and Only then ENTER..
Please like the idea for Support & Subscribe for More ideas like this and share your ideas and charts in Comments Section..!!
Thanks for Your Love & Support..!!

Bitcoin Dumping every time what next update..?#BITCOIN
#BTC trading around $37700
Support TL :- $39400 broke ✅
Minor support:- 38700 broke ✅
Major support:- $36400 still holding
Resistance R1:- $41800
Resistance R2:- $44500
Break > R2 = $51000
Break < S1 = already hit S2
Now keep watching Live Updates by CryptoPatel.
Support:- $36400

Bitcoin Spiked after breakout#BTC/USDT
$BTC trading at $44200 and went upto $44425
After break out price spiked.
Keep in mind $42800 is strong support.
Above this level $Bitcoin is Bullish.
Support:- $42800
Resistance:- $46000

Bitcoin Bullish Invese H&S Pattern Target is $58000#BITCOIN Inverse H&S Pattern:-
#BTC/USDT currently trading at $42200
As Per chart I am expecting some more Downtrend till $39000-$40000
Perfect Right Shoulder bottom could be $40700
But If any Daily Candle close below $40000 then IMO Exit will be good decision.
Inverse H&S pattern also Forming at Bottom so High Probably to breakout Upward sideZ
If break Yellow Neck Line resistance that mena Bullish Toward $58000
Never Do gambling with High Leverage.
Support:- $40000
Resistance:- $44500/$51000/$58000

BTC/USDTCup & Handle formation apper on Bitcoin.
*Please share your opinion on it, write in the comments. Dont forget some cheers bravo. "
Teşekkürler.

Bitcoin LTF breakout and Target could be $46000#BITCOIN
$BTC currently trading at $44100
Breaking out Resistance in 1H time frame.
Above Yellow TL bullish toward $46000
$44300 is also Resistance in LTF
Bullish above $44300
1H candle also closed above Yellow TL
Let’s see $44300 resistance break or not.
Keep an eye on this level.
Support:- $43300
Resistance:- $44300

BTC/USDTPossible scenerio on chart about Bitcoin.
*Please share your opinion on it, write in the comments. Dont forget some cheers bravo. "
Teşekkürler.

Bitcoin 1 Week V/s 2 Week chart Analysis Update#Bitcoin Normal Overview:-
#BTCUSDT 2 Week chart :-
As Per 2 Week chart 50 EMA working Strong support level.
#BTCUSDT 1 Week Chart :-
As Per 1 Week Chart 50 EMA Working as Resistance.
If 2 Week candle close above $44000 then Good For More Upside move.
Next Weekly candle close in 5 Day 16 hours.
Otherwise we can see $41500 level.
2 Week 50 EMA Support = $35629
1 Week 50 EMA resistance = $44167

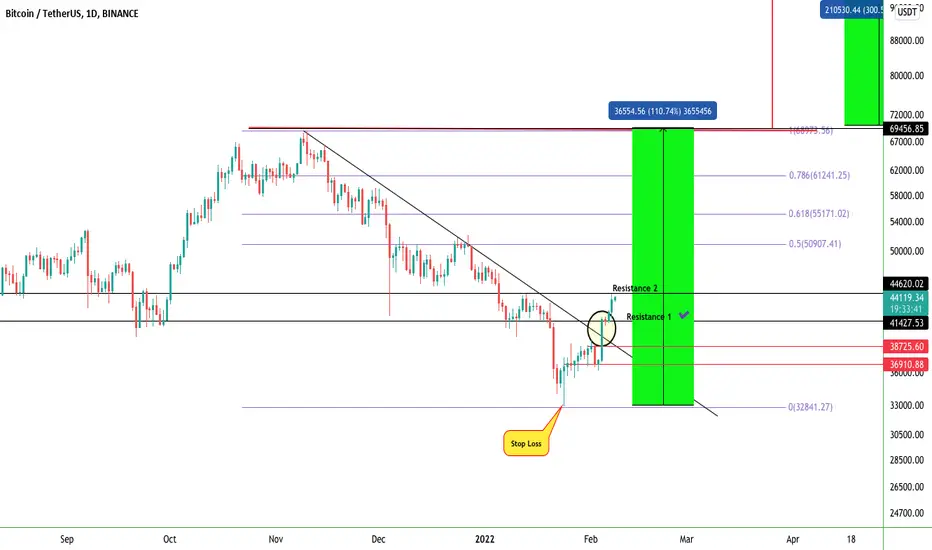
Bitcoin 25% up from our entry and Still Target is $70k#BITCOIN
= $BTCUSDT trading at $44200
= Daily Already closed $41500 as I mentioned.
= Big Bearish Sentiment is Now over.
= You can Book profit or Move Stop Loss at $40840
= Target Still $70000
= Time Frame for Target could be $end of April/May
= Already did 25% from entry and 35% from Bottom.
= Keep an eye on $41500 Support level because Strong Resistance Became now Strong Support level.
Support:- $41500/$38700
Resistance:- $44600/$51000/$61000
Press Like On Tradingview and Twitter.
❤️❤️❤️