Bitcoin Trading range bound from last 11 days what next?#Bitcoin Range Bound Chart:-
$BTC trading in Range between $40000-$44000 from Last 11 days 7 hours.
So this Level is very Stable area in this Range bound.
Next…?
There are 2 Scenarios:-
Scenario 1:- If Break Down $42500 Support level then We can see $40500 once again.
Scenario 2:- Here 2 Big Resistance in LTF .
One is $43500 and 2nd is $44200
So if Break both resistance then we can see $52000
Note :-
Coming 1-3 days we can expect Big Volatility so Don’t open High leverage trade.
We can see Big Pump and Dump on Both side.
Support:- $42500/$40500
Resistance:- $43500/$44200
Xbt

Bitcoin Retest Level 2 ..?#Bitcoin
#BTCUSDT Retest 1 done and Good bounced from Retest Level 1.
Now if #BTC dump then Ready to Retest 2 Level Around $44500
This is very important key level to hold Bull.
upward side Targets are $47000 and $52000

Bitcoin Exclusive CME GAP Chart Update#BITCOIN Exclusive CME GAP Chart:-
- As per CME GAP $Bitcoin Bear Market will be very Bad for CryptoLovers.
- If $Bitcoin not sustained this $40k support then we can see Bitcoin CME GAP 1 could be filled.
- Let’s wait which side Bitcoin Move.
- Bitcoin is already-43% Down from ATH
- Bitcoin Bear Market low could be $18460
- $9665 GAP fill is Like Impossible but Keep in mind this Area.
- Waiting for Bull Market TOP.
Guys If $BTC failed to hold $40000 support then Ready to CME GAP targets.
This all Gap can be filled below $40000 support.
I am not Bearish but This is trading so Keep in mind all scenarios.
If Bitcoin Hold This Support $40000 then Trust me This bull market will be Massive.
And Target could be $150k-$200k
Hope you understand and Ready for all scenarios.
Happy trading Dear Friends.
Please Spread this IDEA and Share your Love guys.
Thank you.

Bitcoin Retest done so ready for uptrend?#BTC/USDT LTF Update:-
$BTC Ready to retest..?
As per chart Now Perfect Retest point after Breakout.
I am expecting bounce back from here.
Worst case Support = $42000
Resistance:- $46700/$51132
If hold $42000 then We can see $51135 soon.

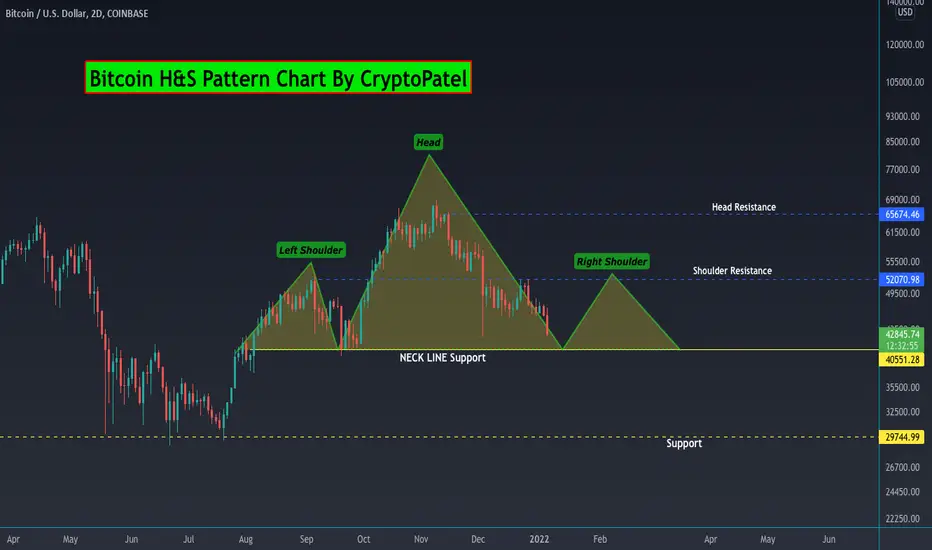
Bitcoin Bounced as I predicted from Head & Shoulder Pattern #BTC/USDT important Update:-
$BTC currently trading at $44000+
- Bitcoin entry $40000 also filled.
- Perfect support and Strong Bounced.
- Perfect Head Formed as per 3D chart.
- Ready for Right Shoulder Pattern
-Weekly chart Bullish Engulfing Pattern.
So Guys Strong bounced from our support and hope you also bought at dip.
Now My Target is $51132
And Stop Loss $39600
But After hit $51000-$52000 , we can see again $40000 as per this Chart Pattern.
So still we are In Neutral Zone below $52000
Main Cluster = $40000
Spread Your Love ❤️

Bitcoin | Bulls Are Back in Town..!!
#Bitcoin (Update)
Finally, Bitcoin Bulls Are Back in the Town but Still not out of Woods yet.
#Bitcoin is forming Classical Descending Channel in 1D timeframe.
If Channel Broken Upside, Expecting Massive Bullish Rally towards the 70k (New ATH)
All eyes on 45.8k Resistance 👀
Bitcoin Bulls need to Reclaim the 45,800 Resistance to Confirm the Breakout..
Please like the idea for Support & Subscribe for More ideas like this and share your ideas and charts in Comments Section..!!
Thanks for Your Love & Support..!!

Bitcoin Holding 70D EMA in weekly chart#Bitcoin Weekly Overview:
#BTCUSDT Holding 70D EMA
This is good working in Weekly chart.
Break below = Bearish
$40500 is this one month Low, if break Mean Dangerous.
Hold Above EMA = Bull is in Control.

Where is Bitbitcoin today?There are a lot of predictions about bitcoin's movements on the Internet, mostly bullish.There are based on so-called fundamentals, on so-called charts, and on data.I am a loyal chart analyst who follows the following principles: 1. Chart contains everything, 2. History will be repeated.
First, let's look at the daily line trend, here is a macd divergence, but in front of the macd gold fork, we can not confirm that the divergence must be successful.And now after falling below ma144, the market has entered a standard downward rebound cycle, even if divergence, it is not confirmed that this is the bottom.We're just looking at the rally, and we have to see if we can break through the ma144.
Second, when we look at the weekly line, many people will compare the current position with the adjustment made earlier last year, namely b and c. The trend of these two positions is similar, so many people think that it is the end of the adjustment.But I would like to suggest that there are a lot of similar trends, and in early 2018, or a, so here is the bottom logic, there is no inevitability.At the same time, if we compare the two positions of A and B, we also have a very high similarity.For example, it was also a record high at that time, the macd high dead fork, and now it is more exaggerated, the weekly macd is divergence, theoretically adjusted for a longer cycle.The goal of the weekly line adjustment should theoretically be ma144, which is the yellow line in Fig.
Third, let's look at the monthly line. If you call up the bitstamp chart (this is the most complete K-line chart I have found in the existing exchange), you can clearly see the upward trend of the 5 waves. According to the wave theory, the next step should be the downward trend of the abc.While this seems exaggerated, you see the monthly macd already facing a death crossing, and from the macd adjustment cycle, at least 6 months, so getting out of the abc may not be without.
Above is what I concluded from the chart, but any prediction is wrong, and the prediction is just a reference for our transactions.When it comes to trading, there should be a quantifiable strategy. What I have long used has been the macd + ma18 strategy, which is not the sharpest offensive weapon, but he is indeed the best balanced and the most stable strategy.
In addition, for the current position, in the end is the middle of the bull market, or the beginning of the bear market, there are some reference conditions.For example, new all-time highs appear, of course, can abandon the bear market view.Or that the weekly macd forms a gold cross.But these references may be more lagging, so for the specific operation, macd + ma18 may be more appropriate.Any strategy, there will also be the possibility of success and failure, so the strategy fails, you also have to strictly implement the stop loss, this is the qualified trade.

Bitcoin LTF chart bullish or bearish ?#Bitcoin LTF update:-
$BTC trading at $42500
Now Trading at Resistance in LTF.
So as Per chart:-
- Break $43600 then bullish In LTF and Target would be $46000
- If Rejected then We can see BTC test $40000 support.
- Never Open any trade Without Confirmations.
- If break $40k support then Ready to $29000 support.
- IMO we can see BTC price $52000 within Few weeks.

Bitcoin Exclusive update ( Finally I am buying with Tight SL )#Bitcoin Important Update:-
$BTCUSDT still dumping and currently trading at $41000
I am buying some here in Spot ( Not Leverage)
My Entry zone = $40000-$41000
Targets:- $52000/$65000
SL:- If any Big time frame candle close below $40k then Smart view is exit.
But if Work this chart we can see $52000 and After again we can see $40k range.
And Most important level is $40000
Failure this Support mean Next $30000
This Is Very neat and Clean View of Bitcoin current market scenario.
Never use High Leverage if you not sure about Directions.
Support:- $40000/$30000
Resistance:- $52000/$65000

Time To Pay Attention In BitcoinThere is quite the setup potentially brewing using the Bollinger Bands. Looks very similar to the "China pump" in 2019. The result was a 40% 3-day candle reversal that failed to break out of the bear trend.

Bitcoin Head & Shoulder Pattern Target first $40k and after $52k#Bitcoin H&S Pattern Update:-
$Bitcoin Trading at $42800
As I Aware you about $45000 support.
Now broke and Trading below Support level.
Now Chart Forming Head & Shoulder Pattern.
Left Shoulder = ✅
Head = Still waiting to test $40500
Neck Line Support
Right Shoulder = It can go high till $52000
Now Your Question is What if break $40k support.
If break $40000 support then we can see flash Big dump till $30000
But as per chart I can expect we can see $52000 after hit $40000
I will Update real time if anything changes.
Support:- $40500
Resistance:- $52000/$65500
Bitcoin | All eyes on 40,000 S/R Level...!!
#BTC (Update)
+38% Correction so far Since 11th November ATH (69,000)
Lowest Daily Candle Closed since 29th Sep 2021 📉
Now, All Eyes on 40,000 Crucial S/R Level..
Massive Bullish Divergence Still Valid (Hopium)
If Bitcoin Remains Above the 40,000 Support Level, Expecting Bounce Back & In Worst Case, If Bitcoin Bulls lost the Crucial Support, Bitcoin Might Retest the 30,000 Support Area.
Please like the idea for Support & Subscribe for More ideas like this and share your ideas and charts in Comments Section..!!
Thanks for Your Love & Support..!!

Bitcoin Broke down $45000 support so now ready to $32000 ?#BITCOIN Weekly TA Update:-
$BTC currently trading at $43500
As I always aware you about this Volatility.
Many Traders Liquidated all fund in last 12 hours.
Now..?
Bitcoin Weekly candle closing still 4 days left.
Bitcoin bull Last hope from Weekly candle.
If close above $47000 then we can see still bull zone.
Daily..?
Daily already break down Support and also closed below support so I am bearish in Daily time frame.
So If weekly close also below $45000 then we can see first Support and Target $32000
Support: $32000/$19000
Resistance:- $47000/$65000

Bitcoin Ready to 78000 as per chart analysis#BITCOIN Exclusive Update:-
$BTC trading price = $46600
As per chart Bitcoin Still holding strong support $45500
Now If bitcoin Worked As per Last Fractals then We can see $Bitcoin Price around $78000 within couple of months.
Supper Bearish below $45000
I am Opened Long Here with Strict Stop Loss.
Never use high Leverage.
Targets:- $58000/$66600/$78200
Stop Loss:- $44000
Waiting for Green Box


Complete Bitcoin Analysis #BTCIn the main chart you can see the analysis, a price support marked with a blue dotted line and a classic support level with a purple box.
With a small growth, the 52K liquid pool was filled, but what were the other causes of the fall...
In the chart below, to a candlestick that would have grown very well if the shadow had not been cast below this candlestick, but because of this candlestick and pattern, it entered the falling phase again.
As mentioned earlier, after the initial drop, Bitcoin will enter a 15-day range and will now be in the neutral zone, which is about 15 days away. Also important are the time dates specified in the chart

Bitcoin Bullish ( 2022 My First Bitcoin Analysis ?#BTCUSDT Exclusive TA update :-
$BTC currently trading at $47000
IMO this is best time to Buy #Bitcoin in 2022
As per chart $45000 is Strong Weekly resistance.
December Monthly Close Price is $4628
Which is act Like Strong support.
And $44000 also Monthly Good Support level.
$46400 is Weekly Strong Support.
Perfect Stop Loss for Spot Entry:- $42000
If Hold $44000 Monthly support then My 1st Target will be $65000
Most Important Point=
If $Bitcoin Break $65000 resistance then we can see New All Time High TOP could be $2,50,000 per $Bitcoin
Bear View:- If break $44000 support and any Weekly candle close below $44000 then BTC bearish.
Support Levels:-
Monthly = 44000
Weekly = 46400
Daily = $45000

Bitcoin (BTC) • Year end Bullish accumulationStrong support base remain unchanged while we keep tapping into these lows. Books are super liquid on the bid side from 45 down to 39k.
Strong possibility of revisiting lows at 43.9k quarterly open.
Funding been relatively flat leaning negative with brief flips towards positive. But perpetual swaps basis keep more consistently trading bellow spot.
General crypto twitter sentiment is bearish.
Around 5B will expire tomorrow in the Options market but these moves we are seeing are already reflecting that settlement event.
There are insane amount of open value allocated toward puts but put/call ratios is very low. There is a significant divergence between open value and put/call ratios which is looking bullish as well.
Futures premiums are quite normalised and not seeing huge short pressure any more for quite awhile with exception of volatility in last few days.
Most volume is produced at lower swings and rarely on pumps. Weak hands distributed to stronger ones while there is little fomo ( people not bullish)
Remember that my views are merely hypothesis and trading decisions should account for proper risk management based on risk-reward and probabilities.
If you are interested getting access to the premium scripts i use personally you can find the link bellow OR you can look for the free ones in my published scripts page.

Bitcoin All Time High Will be $365000 in this Bull Cycle ?#Bitcoin All time High Chart Update:-
$BTC trading at $47700 at Writing this Blog.
This is Monthly chart.
As per monthly chart $Bitcoin always bullish in past also.
In simple way I will clear all Doubts:-
1st:- If Bitcoin Any Monthly candle close above $68000 that’s real Bull cycle will start.
And Target will be $365000
2nd:- If Bitcoin Break this Month low $42800 that’s mean We can see another new low in Coming year 2022
So if breaks this low then High Chances to hit $34000 Monthly support zone and that will be also High demand zone.
But If any Monthly candle close below $32000 then we can see $14000 also.
Mean to say that will real Bear market start.
If you say My Own Prediction then:-
---- $BTC Will Break $61000 Resistance
on 1st-30th April 2022.
---- $Bitcoin Will hit New ATH on
November 2022
---- My New ATH Target is > $150k
Thank you for Your Love and Support.
Please Like and appreciate my hard work.

BTC short-mid term scenarioI'm looking for a bounce from here and the next leg up will be around 55k-56k
Hodl!

Bitcoin shorts step back until 60000 Shorts reached their target around 42k-46k and now they step back to re-short above 60k.
This scenario must hold above 48000.

Bitcoin TA? good luck with that. “HODL HODL HODL”Not financial advice. I’m not a financial advisor. I’m learning to trade. Learn to trade
