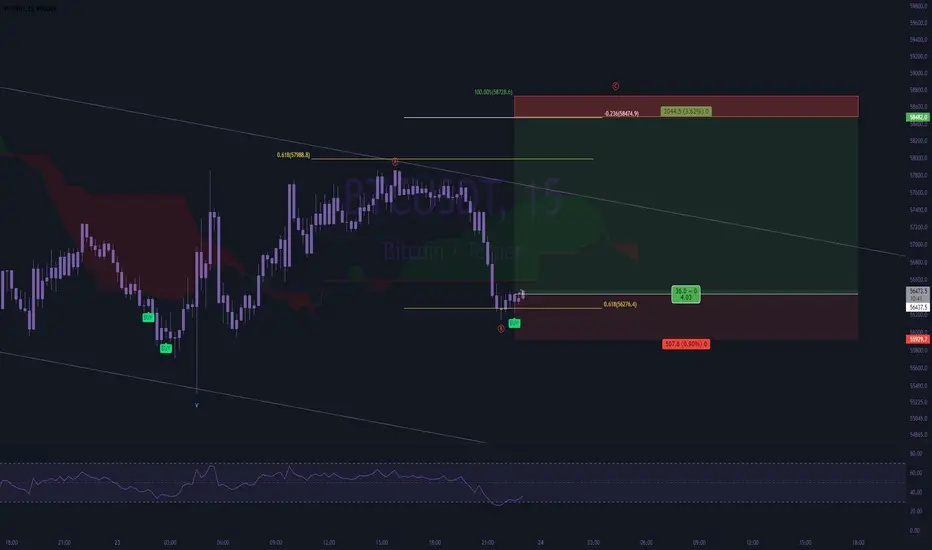
Santa rally cooking...After the latest moves there is a strategically interesting structure setting up for the year end flows. Here I am tracking a pullback towards $52,000 support for an opportunity to load for the next exchange.
In desperation, late buyers succumbed to the fomo which was buying the highs while sharp hands are taking profits (very similar to our latest ETH charts). Now that the highs have been taken, profit taking becomes apparent.
This excellent setup is remarkable not only for the transfer of the momentum, breakout, retrace, breakout, nowadays we consider wave 5 to meet at least the length of wave 1 which will take us at least above $75,000 with extensions (unbelievable) all the way at $217,000.
Xbt

bitcoin trendline magic, Round IIas the last one didnt materialise on the lower time frame, the higher 12h (tbts favourite) timeframe is showing upside potential when trading the convergence.

THE ALL IMPORTANT ACTION OF BITCOIN!I present to you the legendary Jesse Lauriston Livermore's Speculative Chart Bitcoin Edition!
Do not underestimate the Accumulation Cylinder with Widening Mouth.
But you wouldn't believe it, would you?

btc 11-27 update~i notice that btc's price is contracting, while btcusdlongs are starting to rise.
this divergence between btc & whale longs is very bullish.
we also have some really nice money flow \ rsi divergence on the larger frames.
i also noticed that a lot of btc miners look primed for a big run. will share my few setups after i see what the usa market looks like on monday.
---
i think we dance around this lower region for a few more days before taking off.
expect the unexpected though, anything is possible in the world of crypto, especially during these wicked times.

quick TA on bitcoin, lets see if we get the bounce at 53800quick bit of TA on bitcoin, looking for price to find a local low around 53800 before pushing back up to test the weekly resistance

BTC thanksgiving rallyHere's an explanation on how you attract people into "cheap #BTC" and how you create a Thanksgiving rally
all details on chart

11-24-21 btc update - breakout incomingi did a little video update this morning talking about two potential scenarios,
continuing to observe price action, and it looks like btc is poised for a breakout or a break down.
which one is it going to be?
breakout would take us to about 60k
break down would be at about 53k

btc long swing ~good evening, i think btc has begun a mean retracement after the completion of a 5 wave move.
during this time, i dont expect any parabolic moves for btc, just a slow grind up before further downside.
alts can perform very well during this time, but be careful with them.
i do think we've entered into a larger bearish phase just based of everything that i've been seeing today.
will post little swings periodically, but ultimately i am mostly sitting in cash until this correction is resolved.
Wave C target = $58,400
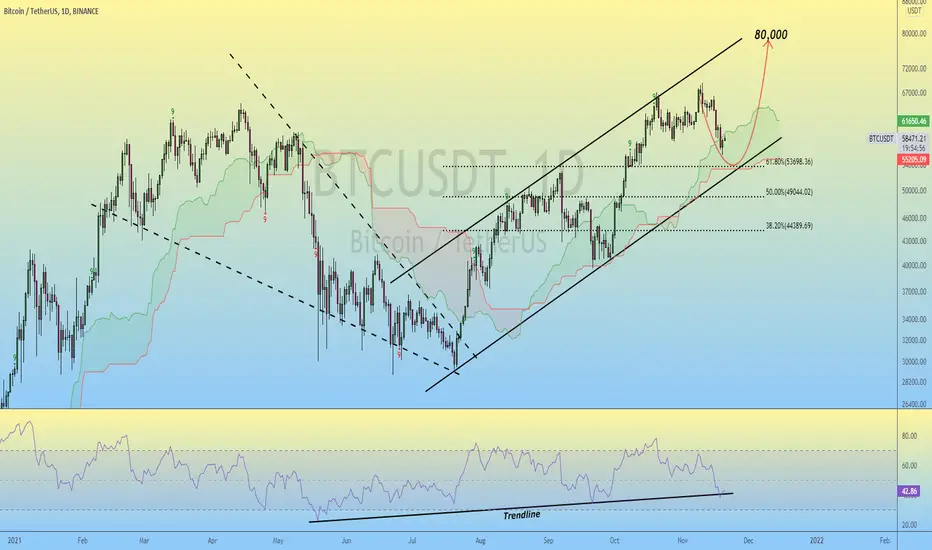
Bitcoin | December will be Bullish..!!
#BTC (Update)
In daily timeframe, Bitcoin has been Moving inside the Ascending Channel..!!
At the Moment, Ichimoku Cloud Acting As Strong Support..
9th TD Buy Candle Printed as well..✔
In case of Bounce Back, #Bitcoin Might test the 78,000 Mark in December.
In Worst Case, If Ascending Channel Broken Downside, Bitcoin Might Retest the 38-40k Support Area..!!
Please like the idea for Support & Subscribe for More ideas like this and share your ideas and charts in Comments Section..!!
Thanks for Your Love & Support..!!

Bitcoin found support, What to expect next?- double bottom off range support
- higher times showing range being respected
- possible sell-off still on the table

The salt of the earth China simply bans Bitcoin again. Short it to ground zero. We will buy evergrande with our profits.

The end of the boleran and the beginning of the fall I announce the penetration in the last HL and the beginning of the bitter scenario and the end of the bullish boleran. Until this fall is not done, we can not say whether it will continue to rise again after the fall or will make more falls ... So for now, we are moving forward with the same scenario.
I do not have an exact date for the start of the second fall, but it is possible that the fall will start from 1 Dec and 2 Dec. This fall has been in the service of the market for about two weeks. Even with the arrival of $66100, the fall scenario is not violated.
We can see that with this penetration and the formation of a beautiful QM with a few pumped candlesticks, the buyers' power is over and then the fall begins.

Bitcoin | Ascending Channel & Key Level to Watch..!!
#BTC (Update)
In Daily timeframe, Bitcoin is Still Moving inside the Channel.. (So far So Good)
+19% correction so far since 9th November High which was Necessary for Healthy Trend ✅
Now, Ascending Trendline, Ichimoku Cloud & Fibonacci 61.8% (53,7k) are Acting As Key Support & RSI indicator is Also Moving above the Trendline Support 📈
If Bitcoin Remains Inside the Ascending Channel & Above the Fibonacci 61.8% (53,7k) then December Will be Bullish for Bitcoin & crypto. (Expecting New ATH)
In Worst Case, If Channel broken Downside, Bitcoin Might Retest the 38-40k Support Area..✍️
Please like the idea for Support & Subscribe for More ideas like this and share your ideas and charts in Comments Section..!!
Thanks for Your Love & Support..!!
BTC UPDATEMy view for BTC now.
Maybe BTC will recover from here
I'm looking for some altcoins now...


BTC/USDT- Bearish momentum building.
- Bullish trend
*Please share your opinion on it, write in the comments. Dont forget some cheers bravo. "
Teşekkürler.

3-tap setup for BTC - likely sharp reversal soonFunding rate for BTC is flat/negative, which means BTC will reverse to upside soon and violently.
Likely areas for a bounce is between 63k to 62.2k.
Good luck!

trendline magic at bitcoin support people eyeing up the cme gap as the obvious sunday trade, maybe we dont visit it until we make a new convincing ATH. you know the drill; cloud convergence = fireworks!

Bitcoin (BTC) • A shakeout in the making before 70k?Price is currently looking somewhat weak and the books are very crowded on both sides.
My assumption is that the market believe 58-60k is strong support due to monthly opens but there is also a good chance we see a bear trap by visiting bellow 58 and incentivising panic sellers to jump in plus plenty of stops just under the 58 down to the 54 range.
Watch the video for explanation of the hypothesis.

Is this the short term bottom of BTC?As you can see the 140 EMA is rather useful EMA on the 4hr timeframe of BTC.
On top of that we have a diagonal trendline starting from the 7 October lows and on top of that we have an oversold RSI, StochRSI and MFI.
Check out the related idea below for what happened the last time I publisher similar idea ;)
If you hit the like button it would really help me grow my following, thank you!

XBT USD SELL (BITCOIN - US DOLLAR)Hi there.
Price is forming a reversal pattern to change its direction.
Watch strong price action at the current levels for sell.

Bitcoin Now Bear Flag in LTF#BTCUSDT update:-
$BTC currently forming Bear Flag.
If break down $64500 then Bearish and Target could be $60400
Now Range bound between $64500-$65800
Support:- $64500/$60400
Resistance:- $66000

Bitcoin (BTC) • A structural look at the price OK Bitcoin is looking good.
In this video I talk through the fact price closed above monthly down-candle opens and so far trends remain healthy.
Quick glimpse through the books show some resistance at the 70k range as discussed in previous videos and that after recent moves at the date of this video liquidity from 67 to 62k is a lot a bit more flat at the moment. As described in the video maybe good idea to have some orders place at 63k range just in case they decide to flash crash this to wipeout some leverage out of the system.
