Bearish HopiumI pray this happens, would love to see all the bull scum fomo boiz absolutly rekt, I doubt it will because bitcoin is like basically perma up only asset and bears are traditionally rekt. But one can hope.
Xbt

Intraday Bear ScalpX marks the spot, That will be where I tp my first set of longs, still down BAD on the day but making some of it back on this trade

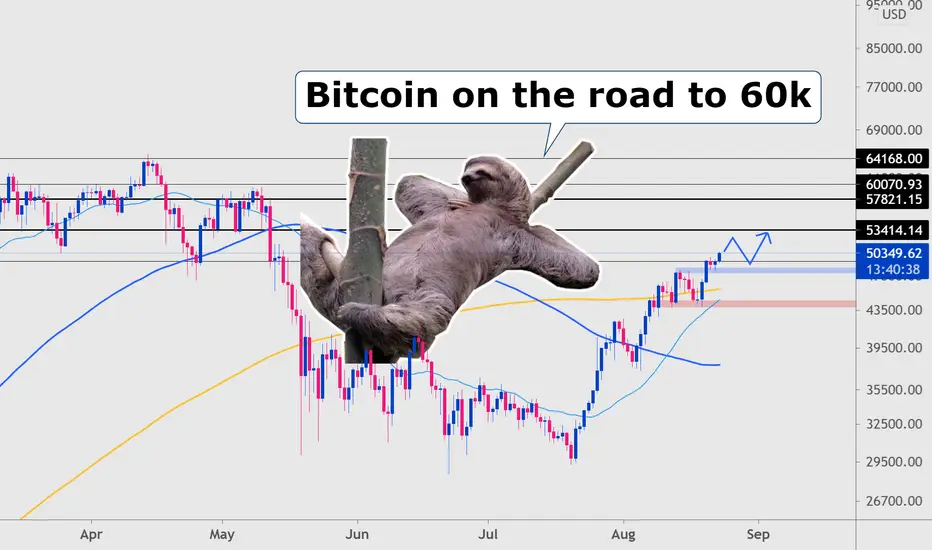
Will Bitcoin Break to New Swing High — 02 September 2021Hey there! Since last day Bitcoin price moved up +8% making it's way to $50000. From 26 August price managed to float above Daily Moving Average (DMA) 200 period and it seems like a strong evidence of buyers dominance.
Since breakout from triangle I am expecting price to reach new swing high during next 3 or 4 days, targeting $53200.
Stay profitable
Best regards
Artem Shevelev

Bitcoin (BTC) • Good chance we are in a bulltrap. Here's whyLet me preface that my views can change at any point IF I see evidence for such.
In the video I walk trough the points that are making me feel that the probabilities are high for a possible bulltrap and we are at distribution levels.
That are plenty of signs we are hitting distribution range YET this can be delayed longer than we expect has market makers keep manipulating the liquidity (I can see this activity in heatmaps of orderbooks that I didn't show in the video)
Prices are being propped up with relatively low effort that is why price been marking up while on low volume. I think this is a way to get bulls DCA strong into the move not knowing that a possible "rug pull" will soon executed.
Open interests on most altcoin's perpetual swaps derivatives are incredibly high with an unusual crazy 3x jump in just last weeks.
This is a sign of a market that is getting over it's head and sanity will soon need to be re-instated with massive liquidations.
Check FULL video since is walk through several different points.

BTC next move thoughts Well we are in a bull market. But the market is overbought and need to cool down. Now the key role will play the price action if there wont be stron massive buy back then we will see it coming down at the next target level based on 233 EMA on 4 hour chart

Bitcoin Stalls At Major Resistance Zone, Will Bulls Push?-BTC is up 25% over the past month
-20MA has acted as support since the bottom in July
-Price has formed a curve which shows breakout in 1 week or less
Bitcoin has been having trouble tackling the $50,000 mark over the last 2 weeks. After prices surged off the bottom of $29,000, BTC managed to rise nearly 75% in less than a month. Since then, BTC has been steady within a $5,000 range which has allowed many alt coins to surge past their ATHs. The overall market is still showing bullish signs as many investors are anticipating a push over $50,000 to happen fairly soon. On the daily timeframe, BTC looks overextended but this does not negate the possibility of a surge to $55,000 before a larger pullback occurs.
As BTC has risen over the last month, each top it has put in has became less parabolic. This price action has formed a curved top along with a curved bottom over the past 35 days (shown in black). The end of this formation is within a week & BTC is expected to have a large breakout sometime before then. It is hard to say whether this Is a bullish or bearish pattern but we can use each curve as a reference. BTC must break & hold the major resistance zone found at $48,000-$50,200 to experience a large push to the upside. In the case bulls manage to pull this off, expect BTC to reach $53,300 & potentially $56,530.
Throughout this bullish trend, BTC has been held up by the 20 day MA. This MA has kept Bitcoin from starting a downtrend as bulls have fiercely bought each time price has reached it. We can use this MA as a good reference to whether BTC remains bullish or is entering a bearish state. If bulls fail to break the major resistance zone & break below the curved formation, we should expect BTC to break below this MA. If this occurs, BTC will then be in a confirmed bear trend & we should expect prices to land between $42,000-$44,700.
While looking at the Stochastic RSI, we can see how strength has continued to print lower highs despite price printing higher highs. This is considered a bearish divergence & would land BTC back below $45,000 if it plays out. Strength must break over the trend line to negate this possibility. Looking at the RSI, we can see a channel formation has kept strength going sideways the past few weeks. Strength must break the top trend of this channel for BTC to have a shot at reaching mid $50,000s.
BTC Intraday Analysis
Spot rate: $48635
Trend: Neutral
Volatility: High
Support: $46600
Resistance: $50200

btc dumpthere is no power for growing uper than 51600.
we need correction for coming bullrun.
maybe we have tapering next month that can dump whole market.
after correction to up it can fall down to 21 EMA.

Bitcoin The maturation cycle has four stages of an asset’s life.
Stage 1: Basing Area (Consolidation)
S1 is when nothing noteworthy is happening. It can last for an extended period, from months to years, and is caused by a poor overall market environment.
Stage 2: Advancing Phase (Accumulation)
The transition from S1 to S2 may begin with little or no warning. There are no major announcements or news. However, one thing is certain: a proper S2 will show significant volume as the asset is in strong demand on big up days, and volume will be relatively light during pullbacks.
Stage 3: Top Area (Distribution)
During S3, the asset is no longer under extreme accumulation. Instead, it is changing hands from strong buyers to weaker ones. Smart money that was bought early when the asset emerged onto the scene is now taking profits, selling into final signs of price strength. As that occurs, buyers on the other side of the transaction are weaker players who know about the asset because it has made such a dramatic run and captured headlines. In other words, the long trade in the asset has become crowded and too obvious.
Stage 4: Declining Phase (Capitulation)
During S4, earnings models are generally revised downward, which puts more selling pressure on the asset. The S4 selling phase may continue for an extended period until it's finally exhausted, and the asset enters another period of neglect. There are more down days and weeks on above-average volume than up days and up weeks on above-average volume.
What should be expected at Stage 4? A Bear Trap may occur that leads to continuing declining phase up to the consolidation area. Another option, after approximately 50% of the asset correction - a new growth cycle will begin, updating the previous high.
These are two book scenarios.
What scenario do you expect? Write in the comments below!
Best regards, EXCAVO

Minor correction and continuation of the uptrendAlthough it has a trend and a support level and has dealt with it, the price could not beat the candle well, so I expect a small correction
As shown in the chart, after reacting to the support and registration of HL, you can think of buying

Bitcoin (BTC) • Everyone looking to short the resistance... Bitcoin sitting right under the 50k resistance. Books confirm a lot of sell pressure but above 52k that liquidity quickly disappears.
This suggest this may be temporary blockage and the fact we marked up so fast on low volumes toward this ranges create condition for a consolidation where a lot of bear will show up and short the derivatives market.
We already see funding rates declining and derivatives exchanges like Binance futures and OKEX trading bellow Coinbase spot while open interest is high.
I think as more bears pile into their shorts this will create the necessary conditions to pierce through those 50k-52k orders.
While price trades above 44k it is structurally bullish (according to my own interpretation).
I currently see the 46.7 as nice bidding range in case we see quick visit there.
But overall if more short pile more likely we will end up piercing trough the 50k sooner.
For those interested here's an EXCELLENT interview with Caitlin Long and George Gammon on why Wallstreet with their traditional finance products (and mindset) will get rekt trying to 'tame' Bitcoin. I recommend whole interview but from minute 33:50 Caitlin drop nuclear bombshells.
www.youtube.com

ETHXBT Channelling Higher Towards 0.07125Trend Analysis
The main view of this trade idea is on the 15-Min Chart. The crypto cross ETHXBT found some support around the 0.06675 price level and is now 2.9% higher in the short term. ETHXBT is channeling higher and is expected to continue to do so and hit some resistance around 0.07125, approximately 3.7% away at the time of publishing. If the channel breaks down, traders should place a stop loss at around 0.0665 in the event of a significant trend reversal.
Technical Indicators
The recent positive crossover in the KST supports the bullish nature of the crypto cross. Also the RSI is trading above 50, signaling some positive price movements. As it pertains to moving averages, ETHXBT is currently above its short (25-SMA), medium (75-SMA) and fractal moving averages. Moreover the crypto cross, at the time of publishing, is displaying buy signals over multiple timeframes.
Recommendation
The recommendation will be to go long at market. Stop loss will be set around the 0.0665 price level and a target of 0.07125. This produces a risk-reward ratio of 1.09.
Disclaimer
The views expressed are mine and do not represent the views of my employers and business partners. Persons acting on these recommendations are doing so at their own risk. These recommendations are not a solicitation to buy or to sell but are for purely discussion purposes. At the time publishing, I have a position in ETHXBT.

Bitcoin levels you not expectPrice entering saturated zone, I think we might see a volatility action near 54k down 50k and even more bumps near 57-60k zone which is highly volatile and liquidity will jump in this zone too.
Current setup for btc is hold
Day trading opportunities will be open in dips, direction long.
Stay safe traders!
IS POSSIBLE BTC AT 56k ?? YES.BITCOIN RIGHT NOW IS IN OVERBUY, SO POSSIBLE 45-46K FOR ACCUMULATION AND THEN GO TO 56K !!!
Bitcoin is a digital currency which operates free of any central control or the oversight of banks or governments. Instead it relies on peer-to-peer software and cryptography.
A public ledger records all bitcoin transactions and copies are held on servers around the world. Anyone with a spare computer can set up one of these servers, known as a node. Consensus on who owns which coins is reached cryptographically across these nodes rather than relying on a central source of trust like a bank.
Every transaction is publicly broadcast to the network and shared from node to node. Every ten minutes or so these transactions are collected together by miners into a group called a block and added permanently to the blockchain. This is the definitive account book of bitcoin.
In much the same way you would keep traditional coins in a physical wallet, virtual currencies are held in digital wallets and can be accessed from client software or a range of online and hardware tools.
Bitcoins can currently be subdivided by seven decimal places: a thousandth of a bitcoin is known as a milli and a hundred millionth of a bitcoin is known as a satoshi.
In truth there is no such thing as a bitcoin or a wallet, just agreement among the network about ownership of a coin. A private key is used to prove ownership of funds to the network when making a transaction. A person could simply memorise their private key and need nothing else to retrieve or spend their virtual cash, a concept which is known as a “brain wallet”.

Return of the bearThe great bear of 60k possibly will back to the market above 50k. There are some reasons for that.
Psychologically there is still panic at 50-60k area and too many people will erase their loss above 50k.
there is possibly a complete 5-wave impulse behind the market, so there is no room for new ATH.
and how about there are waves of regulation on exchanges and crypto, and we are still below the ATH hash-rate.

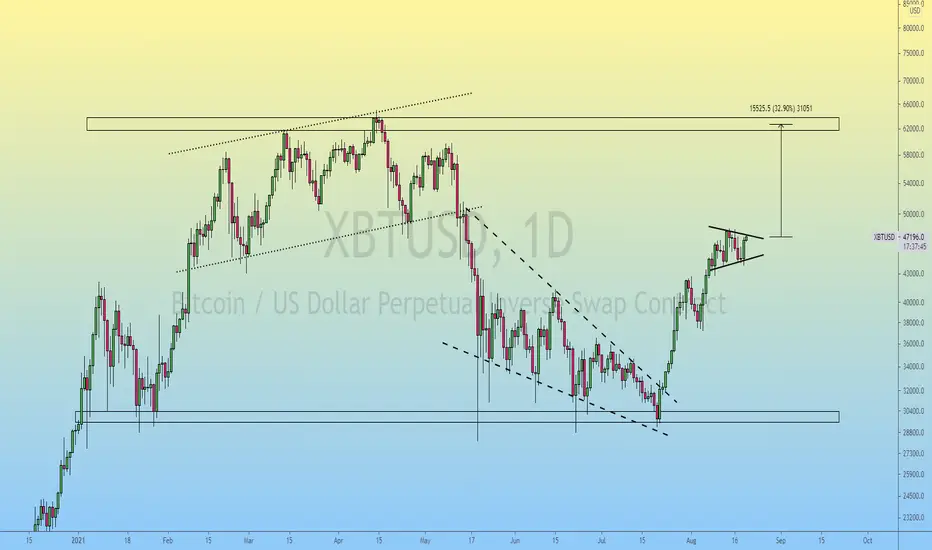
Bitcoin | getting Ready for Another Bullish Wave..!!#BTC (update)
In daily timeframe Chart, Bitcoin is Consolidating in Bullish Pennant Formation.
If Pennant Broken Upside, Expecting Another +30% Bullish Wave towards the 60k.
Please like the idea for Support & Subscribe for More ideas like this and share your ideas and charts in Comments Section..!!
Thanks for Your Love & Support..!!
OMG 14k comings soon !As you see we have abc wave from 65k and the c wave targeted 19462$ and 14083$.

TIME FOR LONG BTC EVERYONEBtc is forming falling wedge pattern and it's also on the strong support.
Time for Long it everyone. Near stoploss, far target. RR is so high
You can also buy altcoin/usdt to get more and more profit.
altcoin season will come soon.


Bitcoin To Move lower IMOYellow box would be my target for next support, this idea only valid if we stay below diag resistance.

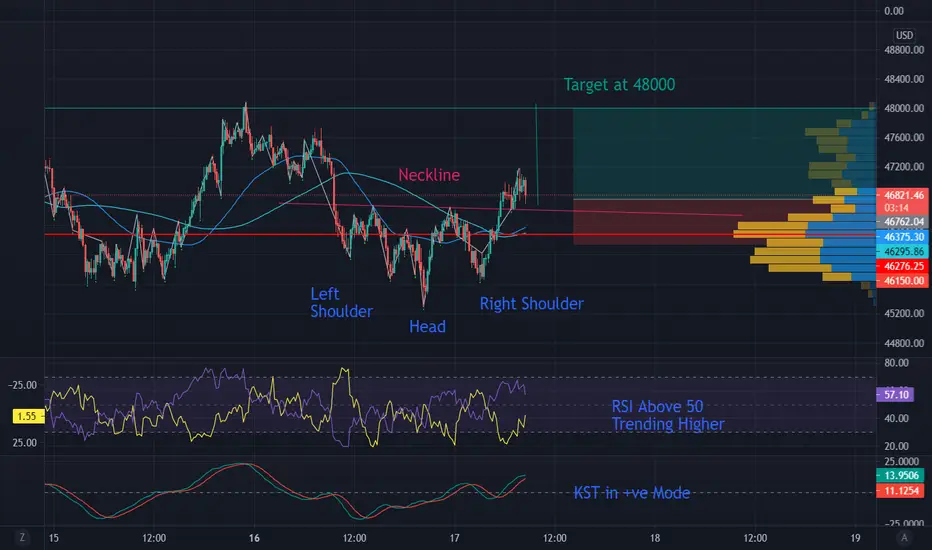
Reverse Head and Shoulders Setup on Bitcoin, 48K TargetTrend Analysis
The main view of this trade idea is on the 15-Min Chart. There is a Reverse Head and Shoulders setup on the cryptocurrency Bitcoin (BTC). The Head of the setup is around the 45280 low. The left and right shoulders of the setup is at 45650 and 45600 respectively. The neckline is the trendline highlighted in red on the chart. The target is determined by measuring the distance between the neckline and the head and using that distance from off the neckline. This setup takes the target towards the 48000 price level. The Stop loss should be placed at the low below the neckline.
Technical Indicators
The bullish nature of the reverse head and shoulders setup is supported by the price of BTC being above its short (25-MA) and medium (75-MA) fractal moving averages. Also the RSI is above 50 with the KST being in a positive mode.
Recommendation
The recommendation will be to go long at market. Stop loss will be set around the 46150 price level and a target of 48000. This produces a risk-reward ratio of 2.02.
Disclaimer
The views expressed are mine and do not represent the views of my employers and business partners. Persons acting on these recommendations are doing so at their own risk. These recommendations are not a solicitation to buy or to sell but are for purely discussion purposes. At the time publishing, I have a position in BTC.
SHORT IDEA FOR BITCOINCurrently we are at our "Take Profit Zone" between 46.500$ – 48.250$ from our previous "Buy the panic sells"-Long(28.500% – 29.000$).
We try shorting bitcoin arround: 47.000$ – 47.500$ with stop loss above 48.300$. Our first take profit will be 44.500$ and second profit target 41.600$. I will also add more longs at 41.600$~.

Achieve a sensitive processWith two Hunt struck, Pollback is expected to be be beaten to the second zone of support and then start his ascent.
If you don 't make a purchase , I will tell the channel after you 've seen signs of purchase

Bitcoin (BTC) • Low supply & Demand while MM Barts in control Market Makers are now in control as we can see with those Bart patterns forming up as demand faded away and supply is also weak.
We have strong orders in the books around 47.5 and 50k acting as major resistances across the board.
Swaps now showing more frequently trading above spot which implies bearishness BUT we don't have yet the structural daily trend from the lows broken yet.
Finex longs are in slow decline and perpetual swaps in open interest ate back to very high levels which implies liquidations to come soon enough.
Altcoins are not rallying aggressively at local top levels. When we see this sort of fomo momentum into resistance probability distribution generally favor a reversal to come soon.
