Xbt

#BTC: Triple Sweep???NOT a financial advice.
BITSTAMP:BTCUSD
BINANCE:BTCUSDT
BITFINEX:BTCUSD
BITMEX:XBTUSD
KRAKEN:XBTUSD
Don't have FTX account yet? Register with my referral link for discounted fees -> ftx.com

Bitcoin Elliott Wave Analysis Update.I talked about this exact scenario last night, you can see the posts below.
We're looking okay for continued upside (for now). We aren't out of the woods just yet, and there are a lot of key levels we have to break through so do expect the possibility for btc to break structure somewhere along the way.
Mentioned last night that these moves will be far more volatile than regular moves, since this is still indeed a part of the Wave 4 correction. If you get into a nice setup along the way, just a set a stop loss & let it ride ~
Wave 4's take awhile to play out, especially Wave B's.
I am projecting a move to that 38~39k range.
Currently in no position, just waiting for a little more conviction on this initial move up before I jump into a safe trade setup.
If structure breaks, lower green areas are the next targets I will be willing to take a long in.
Wave B target = $39k
Wave C target = 23k.
Good luck!

Bitcoin 18 July 2021 — Wedge + Diamond BTC UPPrice of btc resurrecting from surge down. I expect slight move upwards in next days.
Remember mid-term price outlook is still bearish. So keep in mind, in order to get bullish confirmation price should stay above 35000 for reasonable amount of time.

Is Bitcoin Finally Going To Breakout?-BTC has been fairly flat the last two weeks as volatility has subsided to monthly lows
-Price has formed a 2 month long falling wedge pattern
-50 MA has acted as resistance for almost 3 months
Bitcoin’s price action has been super flat the last 2 months ever since the -50% drop off highs. Bulls and bears have been equally controlling price action which has led to a large sideways consolidation. This has left many investors & traders at a lost of interest as this is not a good price action to trade as which a clear direction is lacking. A newly spotted price pattern may give a hint of how much time BTC will have a lack of trend.
Shown in green, a falling wedge has clearly formed after many weeks of bouncing back and forth. This pattern is a generally bullish one but always has the chance of breaking to the downside. A clear breakout & preferably a retest of that trend will likely cause price to follow in that direction. At the time of writing, BTC is sitting within its major support zone of $31,000-$32,200. A break below this zone will likely cause a cascade of selling which would bearishly break the falling wedge pattern. In this case, support will be found at $30,000, $28,800 & $26,900.
For a bullish trend to begin, BTC must break back over its major resistance of $33,500 & hold above. If this occurs, it would be a confirmed upwards break of the falling wedge pattern which will likely start a short term bull trend. In this case, bulls must then tackle the 50 Day MA (purple) which has held price down ever since the $50,000 region.
While looking at the RSI, we can see it has been fairly flat, stuck between the 30 & 50 value. This has created a triangle like formation which shows a breakout to be within a week time. The Stochastic RSI has been sitting in oversold territory for nearly 4 days. At the time of writing, it is showing an upwards curve which looks primed for a strong breakout to the upside. A break above the 20 value will likely start a short term bullish trend.
BTC intraday levels
Spot rate: $31,750
Trend: Bearish
Volatility: Low
Support: $31,000
Resistance: $32,200

Bitcoin Wyckoff [Accumulation & Distribution] — ⚠️Possible 24000This trading method was developed by Richard Wyckoff in the early 1930s. It consists of a series of principles and strategies originally designed for traders and investors. Wyckoff devoted much of his life to studying market behaviour, and his work still influences much of modern technical analysis (TA).
Currently, the Wyckoff method is applied to all types of financial markets, although it was originally focused only on stocks, but I find it amazingly good on cryptocurrency market and Bitcoin
During the creation of his work, Wyckoff was inspired by the trading methods of other successful traders (especially Jesse L. Livermore). Today he is in the same respect as other key figures such as Charles H. Doe and Ralph N. Elliott.
Wyckoff's Three Laws
The law of supply and demand
The first law states that the value of assets begins to rise when demand exceeds supply, and accordingly falls in the opposite order. This is one of the most basic principles in the financial markets, which does not exclude Wyckoff in his works. We can represent the first law as three simple equations:
Demand > Supply = Price Increases
Demand < Supply = Price Falls
Demand = supply = no significant price change (low volatility)
In other words, Wyckoff's First Law assumes that the excess of demand over supply leads to higher prices, since there are more buyers than sellers. But in a situation where there are more sales than purchases, and supply exceeds demand, it indicates a further drop in value.
Many investors who use the Wyckoff method correlate price movement with bar volume as a way to better visualize the relationship between supply and demand. This often helps to predict the future movement of the market.
Personally I recommend use higher timeframes and indicators like ADL and Stochastic RSI.
The law of cause
The second law states that the differences between supply and demand are not coincidences. Instead, they reflect preparatory actions as a result of certain events. In Wyckoff's terminology, the accumulation period (cause) ultimately leads to an uptrend (effect). In turn, the distribution period (reason) provokes the development of a downtrend (consequence).
Wyckoff used a unique technique of plotting patterns on charts to assess the potential consequences for specific causes. In other words, he created methods for determining trading targets based on periods of accumulation and distribution. This allowed him to assess the likely expansion of the market trend after exiting the consolidation zone or trading range (TR).
The Law of the Connection of Efforts and Results
Wyckoff's Third Law states that changes in price are the result of total effort that is reflected in trading volume. In the case when the growth of the asset value corresponds to the high trading volume, there is a high probability that the trend will continue its movement. But if the volumes are too small at a high price, the growth will most likely stop and the trend may change its direction.
For example, let's imagine that the bitcoin market starts to consolidate with very high volume after a long bearish trend. High trading volumes indicate more demand, but sideways movement (low volatility) suggests little outcome. If a large number of bitcoins change hands and the price does not fall significantly, this may indicate that the downtrend may end and there will soon be a reversal.
To sum up, the Wyckoff Method allows investors to make smarter and more logical decisions without relying on their emotional state. His extensive work provides traders and investors with a range of tools to reduce risk and increase their chances of success. However, there is no single, reliable methodology when it comes to investment. You should always approach all trades with caution and take into account all potential risks, especially in the highly volatile cryptocurrency market.
Best regards
Artem Shevelev

#BTC, Retesting 350 moving average for the 1st time March 2020..#BTC
Retesting 350 day moving average for the 1st time since March 2020
(Taking away Covid flash crash),
It has been broken down 2 times in the entire BTC history, both times signalling at least a bearish year ahead.
$BTC

Bitcoin Elliott Wave Deep Dive AnalysisI think we can all agree that the price is contracting as we near the end of this wedge.
The bulls are saying "This is Wykoff Accumulation", and "The price will fire off to the upside".
The bears are saying "The price will fire off to the down side, merrrr"; but will they take profit if we do?
Hopefully they do, because it's going to happen Very quickly when we least expect it. That's just how squeezes work.
Elliott Wave Theory says that we are going to see an extended Wave 5 of this Wave (A). My reasoning behind this move is the global market correction which is going to last through the end of September.
When Spx500 goes down for it's initial Wave (A), that should be when Bitcoin finishes it's Wave (A) as well, as markets tend to flow harmoniously with each other.
Keep some long orders between 23.6~24.5 just in case, and if we do happen to get down there, your orders will fill & you will be a very happy human.
We are nearing extremely oversold levels on the 1,3,12h time-frames. The indicator I use regularly is getting into the area where we are ready for a strong rip up, but in my opinion - not before this last rip down to massacre everyone who has been buying in this lower range. The market is relentless, and the market makers do not want us to profit from the parabolic Wave B; so they will do everything in their power to shake us out before it happens.
Spot buys are the safest, lower leverage works too. High leverage trades are risky down there, as we could see one hell of a liquidation wick when the time comes.
Stop losses are your friend, they will protect you from some serious losses, if we get a huge liquidation\scam wick one of these days.
I'm genuinely ready for this Wave B play, and I have been for quite some time now. The areas of confluence I found on my chart today really resonate with me, and they meet exactly at the bottom of the bear channel on August 1st. All of these trendlines converge in the center of the 1.618~1.75 extension (extended Wave 5 target), as well as a horizontal trendline from the previous 2019 high. That trendline previously acted as resistance at some point, but was eventually flipped into support back in December of 2020.
-----
I have outlined two possible pathways after we finish this correction in late October. The first one gives us a quick and easy parabolic move to about 83k before topping out. This could be the quickest move we've seen yet, and the most profitable with a safe high leveraged setup. The second scenario would take a lot longer to play out, while some serious accumulation occurs - once accumulation is complete, we begin a rise to that 120k level.
Scenario #3, I did not map out in this picture, but we can talk about it briefly. Since none of the waves have seen extensions on the larger count yet, we could see a Wave 5 extension which takes us all the way to 200~250k. I have seen some beautiful extensions in these markets before, and it is not unlikely that we will see it for this final run.
Taking it one day at a time / analyzing these charts every single day, just in case something changes. If anything does, I will be quick to update you all so stay tuned in. Stay well, trade safe, and expect the unexpected in these wicked markets.
✌💸

Bitcoin | Bulls Defending the 31.5k Crucial Support..!!#BTC (update)
Another Daily Candle Closed Above the 31.5k ✅
Bitcoin has been Consolidating in Descending Channel from last 18 Days.. (Big Move Ahead)
At the Moment, Bitcoin Looks Bullish But Still Bulls Need More Strength to Bounce Back. 📈
In Bullish Case, Bitcoin Might test the 33.6k Descending Resistance, If Channel Broken Upside, Next Stop would be 36k.
In Bearish Case, If Bulls Lost the 30.6k - 31.5k Horizontal Support Area, Expecting Another Lower Low (29k) 📉
Please like the idea for Support & Subscribe for More ideas like this and share your ideas and charts in Comments Section..!!
Thanks for Your Love & Support..!!

BTC | XBT | Long | Areas of interestYes! - i will not disagree with anyone that BTC could go lower, but the sentiment is providing great buy opportunities.
I have highlighted the buy/sell side imbalance are which need to be engaged
Happy Trading
Mr Ionic

Bitcoin BTC Analysis- Inverted chart on 1HPlease take a look at the chart inverted and let me know your thoughts. This reminds me a lot of the triple peak that we had when BTC was at its highest.
To me this looks very bullish with the chart inverted. We have just recently broken a trendline that was resistance and now acting like support (in the inverted diagram).

ROLLS ROYCE - WYCKOFF THAT MIMICS THE 2018 BTC RALLYThis post is to demonstrate a variety of trading techniques and relationships amongst similar patterns. Although this is focused on RYCEY, I provide reference to RTX as a representation of airline engine manufacturing and reference the 2018 BTC consolidation.
Lately I've been studying the Wyckoff Distribution and found eerie similarities that are worth sharing.
2018 BTC Comparison of Wyckoff Distribution
Take a look at the 2018 BTC consolidation. We have clean Wyckoff distribution with the absence of the Spring since there was a lot of buying pressure to turn the market around.
Now check the recent RYCEY consolidation.
Here is the ideal Wyckoff distribution
image.binance.vision
Moving Average Strategy
Although we typically look for a Spring inflexion point to mark the end of accumulation, sometimes it just isn't there. The similarity between the daily 50ema and 100ema is what leads me to be inclined to bet that we won't have a Spring this time. Notice how we are pinched right between them and they are near crossing?
Eliot Wave Interpretation
Almost everyone watching RYCEY is aware of the 94% discount off ATH's and we are no where near pre-pandemic levels. In this chart, I've combined Eliot Wave principles to show completion of the ABC correction with subdivision of wave C - we have wave 1-2 extension landing right at the 2.272 which is what we look for for wave 5 completions.
Wyckoff Interpretation
In addition, the Wyckoff interpretation demands that you pay attention to volume! Look at this huge uptick in volume from the end of last year when the dividend was cut, and it still remains relatively high to this day. These are never before seen levels of volume with relatively no price movement since the big drop down into the $1 range. All of this hints that Rolls Royce is ready for a huge turnaround. My first target is $3.
Using Competitors as a Proxy
As initially mentioned, we are still looking to finish wave 3 for RTX which I am using as a proxy for RYCEY and the larger airline industry. Another leg up could correspond with a breakout of RYCEY and consolidation above the breakout zone as RTX pulls back for a wave 4. You can find that idea posted below in the related ideas.
Link to
RTX Post
More info on Wyckoff distributions
Other examples of Wyckoff Distribution
Thanks for reading!!

Bitcoin Moving in a (Bullish) ChannelThis sideways shitshow is just without an end, wonder if its because of the holidays maybe?
Alts were pretty weak yesterday, getting sold pretty hard once again. ETH made an okay bounce today but also nothing special. BTC made one of those moves again, i showed a week or 2 ago as well (they did 3 of those then). Confirming some whales are still Fing around with leveraged traders.
I would like to be stubborn and remain bullish on the higher time frame, but it's not endless. Past 2/4 weeks we had several great moments/setups for the bulls to build on but each time it shit the bed (not enough volume). The longer this sideways action goes on between 40/30K, the harder it becomes to predict as well. So i am not giving up yet but my confidence is get smaller as time passes.
For now, it seems the triangle i showed past week is not in play anymore, instead it's this channel. It's a bullish channel, but it has to show some real strength soon, coming 12/48 hours. If current daily close can be close to 33k, bulls have another chance. That daily candle would then be a bullish one, however, it's size is very small so not meaningful. Therefore, bulls need to show a much bigger green candle AFTER this bullish candle. Preferably tomorrow's candle, but if we can see a small and nice bull flag tomorrow, there is some room for the day after as well to see that big push.
If this doesn't happen like a described above, there is a very big chance we test the downside of that channel again, and also a good chance it might break. If it breaks, we could see a big dump happen. All other important factors we need to see on the bull side, i have mentioned several times past month and those still count.
For ETH, think breaking 2150/2200 would be a good win for the bulls. For BTC, 34.0Kish, is a big resistance zone now as well
So to me, it seems to be an important 2/3 days now.

Bitcoin Index ($XBT) Analysis by imRedaSouhail#Bitcoin Index $XBT Analysis🧩// Head and Shoulders.
-----
Bitcoin is still Bearish📉 A head and shoulders pattern is a chart formation that appears as a baseline with three peaks, the outside two are close in height and the middle is highest. as technical analysts, a head and shoulders pattern describes a specific chart formation that predicts a bullish-to-bearish trend reversal.
-----
Bitcoin index may get a bullish correction to retest its previous Broken Neckline and we might see it act as a resistance level for The $XBT index.
-----
ISMASHPROFIT 💎

Bitcoin Trade Idea for July 14th. If Bitcoin has put in the low for the week, then possibly reversal up to $35,000. The past 5-6 weeks the wicks on the weekly candle have been pretty big, so if we are following the same as last 6 weeks, should get a move up. Break lower would most likely be big BITMEX:XBT downside.

Potential Decline in Bitcoin to 32000Disclaimer
The views expressed are mine and do not represent the views of my employers and business partners. Persons acting on these recommendations are doing so at their own risk. These recommendations are not a solicitation to buy or to sell but are for purely discussion purposes. At the time publishing, I have a position in Bitcoin ( BTC) .
Trend Analysis
The main view of this trade idea is on the 15-Min chart. BTC has been channeling lower in the short term with lower highs of 34675 and 33335. The cryptocurrency made a 1st low around the 32650 price level and is expected to make a lower low around the 32000 price level. At the time of publishing XLM is trading near the upper end of the trend channel.
Technical Indicators
BTC recently crossed below its short (25-SMA), medium (75-SMA) and fractal moving averages and its RSI is trading below 50. Moreover, the KST confirmed a bearish move with a negative crossover.
Recommendation
The recommendation will be to go short at market. At the time of publishing BTC is trading around 33060. The medium-term target price is observed around the 32000 price level. A stop loss is set at 33325. This produces a risk reward ratio of 3.82.

Bitcoin 12 July 2021 — Wedge BTC DOWNWelcome in Bitcoin short-term setup.
Bitcoin breaking Rising Wedge pattern, will move town to 31800 as possible target for the wedge. Remember stop loss above 34750.

don't miss this longbuy 31,400~31,185
wave b target = 46~48k (right where the CME gap sits)
wave c target = 23k.

"the double zig-zag"infamous pattern, easy to spot, but complicated to play.
targets remain the same, but wanted to draw out my reasoning behind this move.
good luck folks, i think we got this.

btc ewt update (7/11)last night i talked about a shift in pattern via:
the above is my updated projection for the days ahead

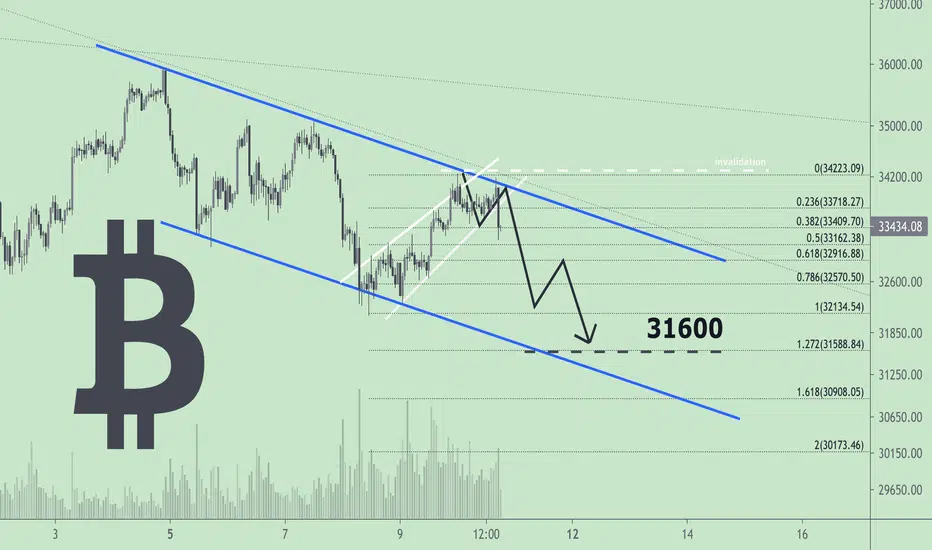
Bitcoin Price Outlook 10-11 July 2021I see price coming down in down-trend channel after breakout from wedge. Seems to me 31600 is main target for short-term (up to 2days).
Bitcoin (BTC) • Crab 🦀 Season Not much has changed since last video. We are still trading above 32k yet to test the 35k (and sustain above it).
Basis and Funding Rates still predominantly negative (favouring longs).
Macro trends are looking terribly at support range and all eyes should be focused on the daily and intraday start break above 35k which is the range equilibrium.
IF we trade consistently bellow 32k I would consider that structurally bad.
But hey! in a trading range - otherwise known as crab season 🦀 - we are at the merci of market-makers and algos that print those famous bart patterns.
I like to pay attention to volumes signatures. Where are they forming and what is the backward context to recent PA.
Check the video for my latest thoughts.

After a long time, Bitcoin has stalled, the restart needs a kay Bitcoin topped $64,000, heading down and falling below ma144, for more than 50 days. But this is not the longest cross-disk in Bitcoin's history.
We compare two historical trends, in 2018 in September 2019, are both sideways after the high decline.
2018 was 65 trading days before breaking down, hitting a low after 2017 while opening the starting point for the 2019 bull market.
Also in September 2019, after 110 sessions, it broke the ma144, but broke down and hit $4,000 behind the 2019 low, of course after opening the big bull market of 2020, hitting a high of $65,000.
Compared with the above two segments, we see that it is also under ma144. If we choose upward here, it should be very difficult. We may copy the trend of 2019, fall again after breaking through ma144, and hit a new low, and then start a new round of bull market.
But this is not a certain trend, after all, the history of Bitcoin is too short, and if we use chart analysis, we can refer to very limited data. But this market, the fundamentals are also lacking, even the most believing people, I am afraid also can not find much basis.
So in such a case, we must maintain enough caution, the best operation, of course, is to adhere to the right trading strategy of the band trading, so that even if the mistakes, we will not lose, at least we can have the chance to correct the mistakes.
