BTC SHORT IDEABTC SHORT IDEA. WE SHOULD ALL BE IN OUR BTC SHORT BY NOW. THESE ARE THE 3 MAIN LEVELS I EXPECT BTC TO TOUCH BEFORE CONTINUATION UP. I WILL BE HEDGING ON EACH PT AREA AS I STILL EXPECT SOME SORT OF BOUNCE FROM WHERE PROFIT ON SHORTS IS TAKEN. I WILL BE CLOSING ALL MY SHORTS AROUND THE 3RD PT AREA AND HEAVILY ENTERING LONG POSITIONS. STICK TO WEEKLY AND MONTHLY TIME FRAME AND YOU CAN NEVER GO WRONG. ENJOY!
Xbt

bitty isn't looking very pretty.long orders are as follow:
27,000
26,900
26,800
26,700
26,600
26,500
ps. i am not shorting this move, even though i am severely tempted to.

Listen up BULLSLook if this one plays out then im a god tier human smd see you on the otherside bears

BTC's Short-term Trend Is Weak, The Market May Continue To FallIt is reported that Maxine Waters, chairman of the U.S. House of Representatives Financial Services Committee, said at a hearing on cryptocurrency by the Supervision and Investigation Subcommittee that the committee has begun a thorough investigation of the crypto market. When trying to better regulate cryptocurrencies (including cryptocurrency issuers, exchanges, and investments), regulators and Congress will face many challenges. The committee not only makes this market with low regulatory limits more transparent but also ensures that protective measures are in place. At present, it has begun a policy review of this market.
Back to the market, Bitcoin continued to decline in the short term, falling below the support of $34,000. The short-term correction is strong and the trend is weak. The support level could be focused on the $32,500 line. If the price breaks, it will continue to fall; if it does not break, the market may rebound. The upper resistance level could be focused on the $36,500 line.

Bitcoin is Bullish. BITMEX:XBT Since the complete Crypto meltdown MSTR has outperformed Bitcoin off the lows.
Saylor announced that MSTR has bought another $500 million worth of Bitcoin and also filed to sell up to $1 billion worth of MSTR to fund more Bitcoin purchases. MSTR now holds around 110,000 Bitcoins. Many institutions have expressed interest in Bitcoin exposure which carries great risk for them to custody the Bitcoin themselves.
Being that MSTR is basically a Bitcoin holding company it seems that institutions are buying the Bitcoin dip.
To keep it simple..... Number go up.


#BTC, Retracing a little today as it tested ~36k level#BTC
Retracing a little today as it tested ~36k level
Looking for it to hodl/flip this area into support on the following hours as signal of continuation toward ~42k
UCTS bullish on the 12H and any lower timeframe
$BTC
#BTC, Trying to cross above ~36k#BTC
Trying to cross above ~36k & potential break from descending channel👀
If manage to hold/flip this breakout (volume?), it may show continuation toward ~42k (range high where it has been bouncing since May)
UCTS turning bullish on the 8h and lower TFs🤞
not bad.
$BTC

Bitcoin Last Perfect Analysis update and Still Potential $100k ?#BTCUSDT Last Perfect analysis Update:-
$BITCOIN currently trading at $35600
And Guys If you remember I told you to partially exit from $50k
Recently Bitcoin Dumped till $28600
Mean more than -50% from All time high.
So Hope you happy with my Spot analysis.
And exactly hit my lower Target zone.
IDEA Also Attached.
Now…?
Guys Its clear Bitcoin Is future for Digital world.
But Ups and down is Part of Trading.
So Keep in mind If hold $30000 level then We still can see $100k
But If break down $30000 level then I will bearing till $15k
So Never do Gambling and Trade with Proper setup.
Patience always Pays off.
Support:- $30k/$23k/$18k
Resistance:- $41k/$60k
Please Press LIKE ❤️ if You Happy with my analysis.


BTC GO BACK TO 50K SOON // BITCOIN HODLBITCOIN VERY GOOD ACCUMULATING AT THIS PRICE, NEXT TARGET 50K

BTC | Bearish | Areas of InterestSentiment: 25 - Extreme Fear
Trend: Bearish
While the market has been consolidating in a lower area for nearly a week, it is clear that there are a number of strong Sell-side areas to drive price lower.
I understand that accumulation at this point could lead to an aggressive move to the upside, but until I see the trend change I will continue to be bearish in the short term.
focus on the Sell-side (Red) areas of interest. As an intraday trader, I will be looking for a good setup to trade back into the trend. Buy-side areas are great for exits 🕵🏾♂️
& Don't forget to follow me on tradingview
Happy Trading
Regards
Mr Ionic


Bitcoin | Falling Wedge Formation in 1D Chart..!!#BTC (Update)
In daily timeframe Chart, Bitcoin is Forming Falling Wedge Pattern..!!
RSI Indicator is Printing Classical Bullish Divergence ..
At the Moment, Bulls testing the Resistance 35k, If resistance got Cleared, Expecting Huge Bullish Wave towards the 48k in Coming Days.
In case of Rejection, Bitcoin Might Retest the 30k Area (Lower Low), If Daily Candle Closed Below the 29k, then Falling Wedge Pattern Will be invalid.
Please like the idea for Support & Subscribe for More ideas like this and share your ideas and charts in Comments Section..!!
Thanks for Your Love & Support..!!

btc is good or no. time for buy or sellBTC UPDATE:
BTC break out trendline today.
BTC is good now. Wait for buying BTC at 32600 - 33000.
Target in short term I told many times before is about 39000 - 42000

#BTC, 7% up on a few hours is cool but still lot to prove#BTC
7% up on a few hours is cool but still lot to prove on the big picture
a break above ~36k and a flip to look for a potential HH could really make an impact on the overall structure
good news is ~30k hodled the second week that retested it over the last 40 days
$BTC

IS the BTC low in?I'll keep it as simple as possible,if we get a 4hr close above $33,420 i'll be re-entering BTC for the next move up

Bitcoin update June 21Hello
Bitcoin update 21.06.2021
I still follow my previous analysis.
We touched support line of triangle
Inside the triangle I see falling wedge pattern
RSI-Oversold
Fear and greed index - 23 (Extreme Fear)
We shorted last down movement
And I see good level for swing trade
Best regards EXCAVO

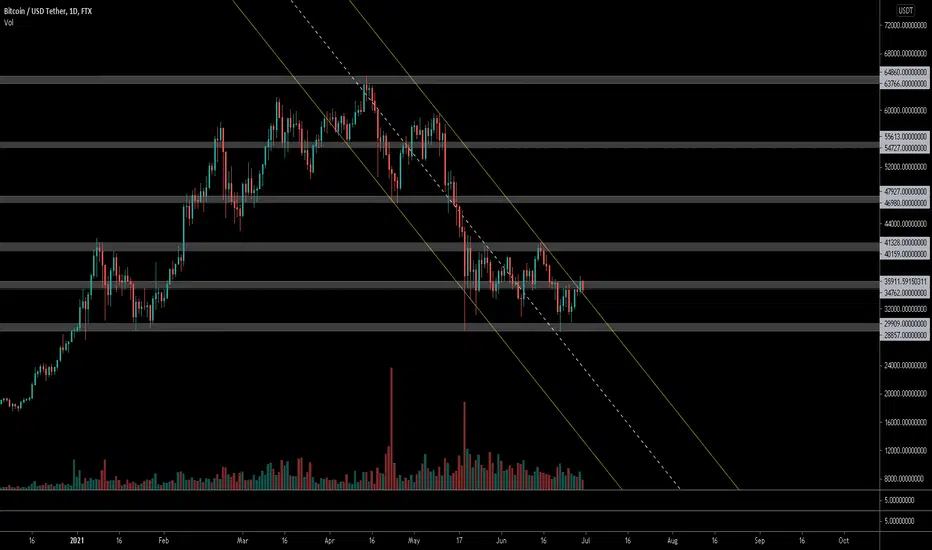
Two fascinating and important timelinesThe first 29 June timeline (red line) marked on the chart is our most important timeline, which is likely to fall, and I expect a lower floor to occur in this timeline.
The second 3 Jul timeline (black line) It is not yet clear how this line works, but if the previous line forms a lower floor, this line can be bullish.
Take timelines seriously


btc wave b setupWe can all agree that Btc is about to finish this Sub-Wave 5 to complete this Wave (A)
----------------------------------
Wave (A) target: 28,000
wave (B) target: $47,000
previously:
ps. i post quite a few scenarios, and i slowly eliminate the ones which get invalidated, eventually finding the right one.


Similar charts, not necessarily out of the same market
Bitcoin's recent moves are very similar to those of August 2020, but similar charts don't necessarily follow the same trend.
In August 2020, Bitcoin was in a platform breaking trend, which is similar to the current trend. It is also the 5-wave correction of ABCDE, and then began a new upward trend.
But the two market, there are also some differences
1. Average differential, the correction did not break MA144 then, whereas the current correction is below MA144
2. At that time, the rebound from the low of $3880 lasted 5 months, up less than 150%, while the current market, up 7 months, up more than 500%
3. Changes in the global financial market environment. Last March, the Federal Reserve in order to rescue the epidemic, excessive issuance of dollars, global funds are under inflationary pressure. Now that the epidemic has subsided and the economy has recovered, fighting inflation is the main task, and the Federal Reserve is talking about raising interest rates.
4. As the digital currency led by Bitcoin has performed well in the past year and become the leader in the global financial market, it has triggered the attention of governments and financial regulatory departments of various countries, and regulatory policies have begun to tighten. Although more and more financial institutions have occurred and supported Bitcoin, SEC has no intention to regulate digital currency, which means that ETF is far away. China has cracked down on mining in order to achieve a carbon peak, resulting in unstable calculations. There's a growing controversy over how big names like Musk manipulate currency prices through Twitter. If these issues are not addressed, digital currency will not truly become a mainstream financial product.
So we see two markets, similar charts, but also very different, if you want to get out of the September 2020 breakout market is not small. As an investor, there is no need to worry about where the market is going. What we need to do is not to go against the trend after it has formed.
