40kfairly clean setup, golden zone pull back from this little move recently, about to retake the support of the bigger wedge we're in; poised for a move up to about 40k.
i do believe we drop once more after we reach 40k, to make a lower low before the bigger move to 118k.
previous post:
Xbt


BITCOIN (BTCUSD): Two Scenarios Explained ₿
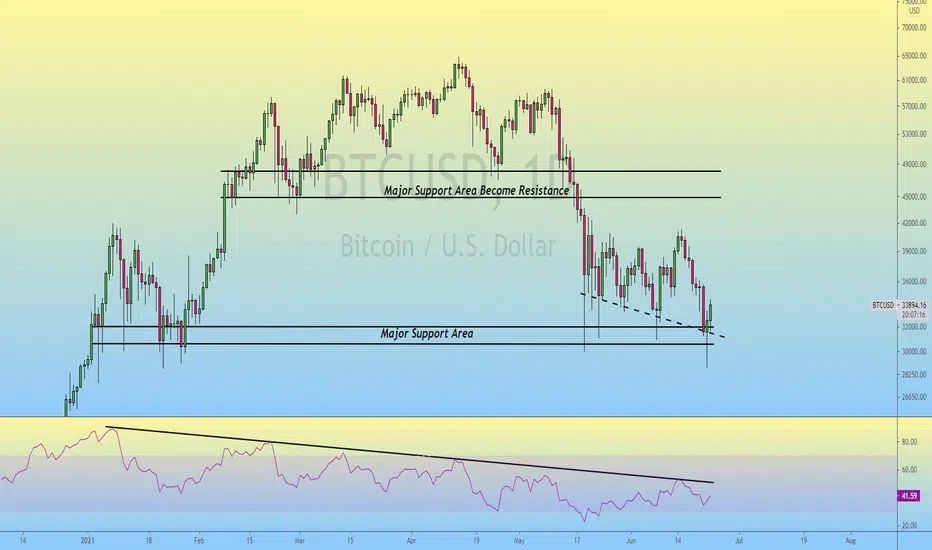
Very important moment for Bitcoin.
On a daily, the market is currently trading in sideways.
The price has formed a wide horizontal trading range.
Bears are testing its support at the moment.
Here are two scenarios for you to follow:
Bearish.
In case if the price breaks and closes below the underlined support of the range,
many buyers will lose confidence and it will be a trigger for one more selling wave.
Bullish.
The price may respect the underlined support.
Your confirmation to buy the market will be a bullish breakout of a falling wedge pattern on 4H.
It will lead to a bullish move to a resistance of a daily range.
Because I heavily invested in crypto, I remain bull-biased.
But who knows, we must be prepared for everything.
What will happen in your view?
❤️Please, support this idea with a like and comment!❤️

At The inflection point
Bitcoin Desperatley needs to hold this above these two averages. A couple more closes below and I believe the algos start selling hard.


ETH and The Parabolic FightI posted this line past week, don't remember when :). But more important, even though alts looked weak again today (posted some things earlier today about btc and alts), ETH might be weak because its against that resistance line. Mentioned it in the past, curved line are always subjective, but it does look pretty legit to me. Now, when price stays like glued to the resistance (so no real rejection), it's often a sign that it eventually breaks.
Parts of what i said about ETH in my public channel:
Alts, still disappointing must say, eth wasn’t even able to reach the horizontal resistance around 2000/2020. I don’t like this, since weak alts past month have been giving the real answer of the direction of this market. But, if bitcoin can close clearly above 33k, I might give it a second chance tomorrow. Eth also has a big resistance on the daily chart, parabolic shape. Will show it tomorrow, at the moment moving around 2050/2100. That one has been giving pressure past 2 weeks. Maybe it means something real if that breaks coming day or 2
This is what i mean, first resistance around 2050/100. Think a break of 2300/400, would prob be a big win
If this would happen, a break of the 2100ish and we get a big pump (if its a weak pump it might not be a real parabolic), think the 2600ish would be like the 40000/42000 resistance of BTC.
Short term, also bit guessing, but think this might be what we can follow. Ideally low is set already, but maybe its making a small parabolic shape here as well. Think as long as it doesnt make a big drop, and stays above 1900/1920, it could work. First resisatnce is that white are around 2050/2100. Now, if this 2100 breaks, it really has to pump big, nothing small or weak like we seen lately.
So for now, still all risky since alts have been VERY dangerous. But if bulls can break the first smaller resistance around 2000, there is a chance it might work. Until then, think we need patience
Previous analysis:

TIME FOR BUY BTC, IT HAS THE BOTTOM NOWWAIT FOR BUYING BTC AT 2 LEVEL: 33K AND 31K NOW EVERYONE.
IT'S GOOD NOW.
TARGET: 40K-41K

Bitcoin | Bulls Defending the Crucial Support..!!#BTC (Update)
In Daily timeframe Chart, Death Cross Already Confirmed But Bitcoin is Still Moving Above the Crucial Support (31k)..
RSI indicator is Making Lower Highs Since 8th Jan (Downtrend).
Bulls Defending the Support & Looking Strong & Buying the DIP 😊
Buy at the Support & Sell at Resistance, Right??
RSI Printing Bullish Divergence in Daily timeframe Chart & Bitcoin Might Test the 40k Area..!!
In Weekly timeframe, Bitcoin is Still Moving Above the Major Trendline & EMA50 (33780) 🏄♂️
If Bitcoin Remains Above the Trendline & EMA50, Bitcoin Might Retest the 60k Major Resistance Area 📈
If Bitcoin Bulls Lost the Trendline & EMA50 Support then Next Stop Could be 20k (Psychological Support Area)
Please like the idea for Support & Subscribe for More ideas like this and share your ideas and charts in Comments Section..!!
Thanks for Your Love & Support..!!
BTCUSD: Why can bitcoin reach $300,000 in a few month?Hello my friends!
The current situation tells us that we are halfway up in terms of time. Even though many are bearish, that has nothing to do with the overall bullish situation. I remain convinced that around 30k was/is the bottom. The current price action is a classic consolidation. And many are trying to push the price further down with bad news to buy cheaper. For me, however, it is absolutely clear that 62K was not a halving top. Accordingly, I am still strongly bullish.
The chart examines Bitcoin in recent years in the four halving epochs. Each epoch is many times larger than the previous one. We are currently in the fourth epoch. If Bitcoin follows the same path as the last epoch, the peak would be around $400,000. In relative terms the peaks have decreased compared to the previous epoch. So "only" $300,000 are more likely. In any case, more than $100,000. The halvings are characterized by dramatic rises to a new all-time high. In between are regular dumps followed by regular pumps. 😃
--
Let's see what happens.
Happy trading. :-)
BTCINVESTING
--
BTCUSD: Another bad news for bears!
My Post Jun 7, 2021
(2/2)
My Post May 31, 2021
(1/2)
My Post Apr 18, 2021
My Post Apr 15, 2019 (2 year ago!). I was one of the first btw. ;-)
--


BTC no more dip!There is panic on the street but the best time for buy is when there is extreme panic. It is dip and bitcoin can rise from here if it hold the channel.
In the case of hold the channel it will rise above 42k area.

Bitcoin and The China Crackdown :(Seems China is at it again, throwing some serious FUD in the markets. Just seeing it all, so i assume that China has caused this drop. Think that worries me a lot, Yesterday we had a very bullish daily candle close. Normally worst case, we would have seen a very weak follow through to like 37 and than after day or 2 seeing it drop again. Thats the worst case i know in my 20 years, after a bullish candle close like we had yesterday.
But as we can see obviously, price dumped way below yesterdays low even, i am not sure, but don't think i have ever seen a daily candle like this fail like we are seeing today. This worries me a lot. I dont want to spread any fear, just what we are seeing today, is not normal. I also can't judge how bad this China crackdown is. I hear many different opinions from people, some saying it's even bullish for the market, long term that is. Because now mining is concentrated for 65% in China i think, with this crackdown, it will be spread more evenly over the world. I do agree with, always better to have things more decentralized
I do believe long term that's probably better, but Bitcoin does need to survive it short term. How big are the China miners bags? Will they sell everything now? Which will put a lot of pressure on the price obviously, if they sell?.
These are questions, i don't have the answers for, so i don't dare to say this time if it's Whale tricks to make retail sell the lows and then pump the price like they normally do. This is what i kept thinking past 2/4 weeks.
Now, i honestly don't know. Think if we close at the lows or drop even more, its most likely bad. If, hopefully, we see price go up again and safe the daily candle from becoming very bad, then maybe it was just a panic day and maybe we can leave it behind us again. Think for that, we need a close above 34.5/35, that would give me some hope that bulls are not completely scared.
You know, sometimes i feel confident about a direction, sometimes i dont have my own view then i give levels for you to work with. Rarely i have no idea at all, i am very close to the last one now. Now best thing we can hope for is, that the daily close gets saved a little bit at least. Closing at the lows, think would be pretty bad. To illustrate, closing at the top grey area, would be very bullish. Closing at the one below it, would be decent, would give some hope for bulls. Closing below 34k, think its pretty weak in general. Closing around 32k, think it will be very bad.
When you look back at past half year (or past years), you know i have my moments i am predicting the lows and highs, i am giving a view that eventually plays out with some delay. I sometimes am completely wrong. This time i assumed was going to be one that with some delay would probably go as i was thinking. But i am a bit scared now, i must admit that :). Because of this weird failure of the daily candle, just never seen it before (of course it's as if i have seen 20 years of charts of all the assets in the world). So, if someone has a similar candle failure, please show me in the comment section below, because i have not seen it.
So in general, think bulls need to hope that today closes at a decent price. Yesterday i said the following:
Was having a April 2018 feeling since yesterday, very similar, not in shape but in steps. Only big difference are alts though, then they were much stronger, now underperforming btc in this consolidation.
Past 3 weeks or so was telling some people, that maybe whales are postponing shit, until after June 25th, because of the futures quarter expiration. They did that trick in as well few days after March 2019 expiration, when btc pumped above 4K and did the summer rally. Since it’s so close to the 25th, think maybe they keep it in the 38/31 range until then.
Then shortly after i saw BTC pumped to above 36k even, which made me think okay, this is looking even more like April 2018 now. But todays drop, even more because of the China news, I can't be confident at this moment about the whole idea. I also have a theory on ETH chart, but for that i also need to see today's close be much better than it is now. If so, i will post about that tomorrow
So for now, I would still be somewhat careful, if it was only the charts and whales, i would not have a problem with these smart money games. But because of the China news, it always makes me nervous when a big country cracks down on crypto. It's the biggest danger that always hangs above this market. Something i kept saying many times since 2017/18, but i dialed that down a bit past year because more and more countries seemed to be accepting/adopting it. But then past 2 months we have seen again, doesn't even matter who says what in what country, another part of the government can decide something else again. Maybe they are all playing games, who knows. We need to see where we are in 5/10 years from now to know for sure.
So for the bulls, hope today recovers a bit. For the bears, even if this market is already in a bear market, be aware of nasty short squeezes.
Previous analysis:

Why not use the left-side trading strategyInvestment has always been diversified, many people choose to bargain, low suction and high throw; some are on the right. The method is not good or bad, but for different markets, we should choose a suitable way, rather than mechanically mechanically.
Buffett is a typical left investment, many times he can hold for ten years or more, so everyone respect him as the god of shares. But that is the fundamental logic, there is the target of long-term investment value. But in the digital currency market, altcoin does not have solid fundamental support, so the left trading method may bring huge losses.
I made a simple count on the weekly chart, where most altcoin s have fallen over 70%, but is that the bottom? In the last bear market, altcoin mostly fell 90%. Regardless of the time cost you need to cover, that is, there is 20% in space. If your source of money is borrowing and using leverage, how much pressure will you bear? The reason why many people can not maintain a good attitude is not that they are naturally urgent, but under the pressure, can not maintain a good attitude.
Therefore, I have always suggested that you use the right trading standard, on the one hand, we can avoid the uncertain time cycle, many times, at the bottom will be sideways for a long time, even if you buy a low point, but can not make profits, that is, lose the opportunity to invest in other targets, will also let their doubts, resulting in the imbalance of mind.
Summary: For the lack of consensus, lack of fundamental support, lack of institutional funds, we should adopt the right-hand trading strategy.

Bitcoin (BTC) • Sell pressure strong despite significant demand We failed to regain 36k. 😩
No reason to be bullish here despite the ongoing evidence of accumulation going on.
Orderbooks on Coinbase and Binance certainly look very strong but so is the incoming sell pressure. This selling might be related with recent shutdown and cracking down on mining facilities in China. Hey, this is just speculation but the trend is your friend at the end of the day.
Daily and Weekly Trends petty bearish at the moment but we still have a few support ranges just under us with a major one at 28k.
Let's take a second look following my previous video.

Short term BTC playCross over here and held good line of previous support. Expect to test resistance before next move.

Bitcoin (BTC) • Are we heading to 10k?Apparently there are some people out there already calling for 10k. 👀
In this video we take a look into Volumes and data coming from Futures.
Watch the full video for my general overview packed with useful information you can incorporate in your own analysis.
I talk through some heuristics that can be helpful to assign odds and further develop your own thinking around these things.
Remember that everything I discuss in the video is subject to random circumstances of the market. Likewise treat everything as hypothesis and probability.

Why I Watch $ 20,000 —— Bitcoin from the weekly lineBitcoin rose from its 2018 low of $ 3,128, or nearly 20-fold after 122 weeks. This increase performed the best in the same cycle, among large financial markets. But a lot of people also want him to continue to perform well, so we will look from the weekly line, whether they will get it.
First, the weekly macd has been running for two months after its death crossing in April and shows no signs of improvement. The average system, After falling through the ma18,currently looking for support near ma36. Readers who read my articles should know that macd + ma18 is the right-hand trading strategy I ' ve been highly advocating. You can also review and look at historical trends and what happened after macd formed a short trend and the price fell below ma18.
From the right trading standards, the current operation should be a short trend. But how long this trend can go, whether it will form a long-term bear market, depends on the next rebound trend. ma18 is a very important indicator, I have written articles before, interested to check out the historical articles. If the rebound cannot break through ma18, means the next market is a bear market. The goal of the adjustment should theoretically be the early high, near $ 19,800 in 2017, and ma144 is also moving up, I believe the average is also attractive to the currency price.
To sum up, if the currency price does not break through the ma18,, then the adjustment target of the weekly line level, it should be around $ 20,000. Of course, the adjustment will not be a straight line, there will be a rebound, But don't rush to enter before breaking through the ma18.

SHORT BTC NOW. IS IT THE TIME FOR SHORTBTC QUICKLY MARGIN:
This is what I think for BTC now.
For margin, you can SHORT BTC at 37300 - 37500
Stoploss: 38007
Target: 36100 - 34900
Use low leverage and use stoploss for this trade.

BUY NEAR NOW EVERYONEBuy a small bag of #NEAR at 3.09 - 3.15
Stoploss: 2.9499
Target: 3.3 - 3.6 - 3.9
NEar is not affect by BTC now...

BITCOIN IN ACCUMULATION ZOOOOOOON......As i see bitcoin right now is on ACCUMULATION zoon and now we are in LPS zoon to complete the right shoulder and re-test the tringle line after we break it.
What i see right now we made the bottom in 30k and now we are going to 86k-121k.
Even if we break the bottom we will go to make ACCUMULATION Schematic #1 to make the 3th bottom at 28k and after that will continue rise to the targets.
pbs.twimg.com
res.cloudinary.com
school.stockcharts.com

Bitcoin Retest completed and now Ready for $58000 ..?#BTCUSDT TA Fresh Update:-
$BTC Currently Trading at $38000
This is very good support and BTC also holding a good support level.
And also we can see in the chart Higher High and Higher Low in the 4H chart.
And in the 4H chart after breakout big resistance $38000
Today retest level $$37000
So I am personally Bullish as per the chart.
Now..?
Currently, $36457 is strong support in 4H Chart.
So I am buying some BTC here and SL below $35450
Targets:- $45634/$49755/$58165
Support: $36457/$33400/$30000
Resistance:- Targets
Don’t forget to share your opinion..
Please click the like button and Appreciate my hard work.
Must follow me for the latest crypto real-time updates.
Thank you.

Bitcoin ABC Correction Within the ABC, Part 4Going to keep this one short, planning to write a normal analysis as well, just wanted to show this "fractal" again because even though its not identical, it does seem the the steps so far are the same. What i wrote in the previous analysis:
Think, at some point, we will make another retest of the lows, was thinking that past days as well and this chart shows as well that its not far fetched to think that. The massacre was quite big past week, not likely to think the market will recover in just a few days. normally it takes more time before confidence comes back in again. Also, the people i talked about in Part 1, who just didn't want to take profits at the highs, at least acting as if it was the biggest challenge ever in their lives, are also scared and some even are completely out of it. I am quite sure, the market will pull them back in again, but assuming we will see 50k+ prices again coming months (i hope).
Forgot to add, a month has passed and we had a few retests already of the lows. So could say that part might be done already, only thing lacking now is the confidence of the bulls, at least with the alt coin market
Last week i posted a potential 12345 wave for BTC, which was also the case in 2018 and has been playing out so far, which gives some hope for the bulls. However, this time, the third wave weaker than 3 years ago. I know that weakness was most likely caused by the FED meeting yesterday, causing some extreme moves within minutes, which probably was not planned by anyone. Anyway, this 5 wave count, means that BTC may not cross 38kish anymore, otherwise this theory fails. Doesn't mean it will crash, but it will take another form at least. Think anything above 36kish, would still give bulls at least a chance. So not good at all to see it drop below 38k, but it's not super bearish right away.
About the potential bullish move for coming weeks, as the fractal suggests, i will talk about that more in my next analysis. About what my thoughts are and the different scenario's i think are the most likely ones and what we want to see to determine which one of the scenario's will then be the more likely one.
One extra thing i want to mention, 2 months ago when i warned about the bearish wedge and the big ABC correction, i mention alts would probably bleed big time and the alt market cap will probably never break the ATH again. So of course some here and there could make new highs, but i dont think that all/most of them will do it again like earlier in 2021. But what has surprised me a lot past week, is the weakness of ETH. I honestly thought that ETH would at least move between weak alts and relatively stronger BTC, but past days ETH has been one of the weakest alts out there. I just honestly can't judge, if it's whales playing games and are accumulating ETH, or that they simply want to get rid of it.
This chart below shows the very clear difference, as if ETH got exchanged for BTC with some good volume. So maybe, this would be a key factor as well, that we can't really become bullish as long as we don't see ETH outperform BTC again, as we saw several times the first 4/5 months of this year.
That's it for now, not sure if I have to time to make the BTC analysis today, but i will try.
Previous analysis:
