TIME FOR BUY CHR NOW#CHR
ENTRY: 18500 - 18800
TARGET: 22000 - 25800
Stoploss: 17499
JUNE IS MONTH OF NFT COIN
Xbt

#BTC, Looking closely to the trendline linking all the LL#BTC
Looking closely to the trendline linking all the LL over the last Month
Current retest & so far rejection is allowing for some traders to speculate over a potential short
If brakes to the upside, it would be the 1st HH since May & bulls may retake control toward 42k🤞
$BTC

The last kiss on the resistanceAfter the new penetration, wait for the climb to the most important resistance ($42800) and say goodbye kiss. Drop to the last two targets were marked with a green line

Bitcoin Trade Setup - Swing Trading Shorting OpportunityBitcoin Trade Setup - Swing Trading Shorting Opportunity
Bitcoin looks weak but that doesn't mean you short it right now. It is forming a triangle pattern and so let it breaks the downside.
You can short Bitcoin once it breaks the red supporting zone.
If you're a conservative trader, then wait for a break from the red zone and retest the red zone again.
If you get any rejection at this key area of value, then you're good to go for short.
Follow me, to get the future prediction.

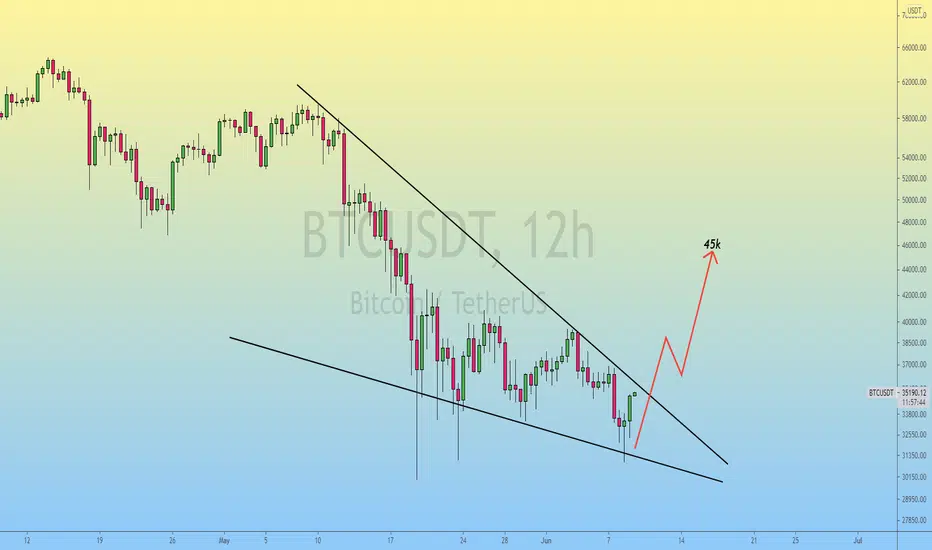
Bitcoin | Falling Wedge Formation..!!#BTC (Update)
Bitcoin is turning Bullish & Again Getting Ready for Bullish Wave 📈
Falling Wedge Formation in 12hr Chart + RSI is Printing Bullish Divergence..
In Case of Upside Breakout, Bitcoin Might Retest the 45k Area.
At the Moment, 30k Acting Strong Support & 40k Acting As Major Resistance..!!
Please like the idea for Support & Subscribe for More ideas like this and share your ideas and charts in Comments Section..!!
Thanks for Your Love & Support..!!
Bitcoin BTC update
BTCUSD touched support line of local down trend channel
Also we reached 32k area
Next target 35-37k
Best regards EXCAVO


BTC UPDATE. IS BTC AT THE BOTTOM NOW? TIME FOR BUY IT?BTC UPDATE:
For Spot, I think you can buy at 30k-31k, but for margin, I think we should wait for the clearly plan.
You should pay attention the volume in my chart, the triangle in my chart and you will see the result

BTC An Experimental AnalysisThis price target is calculated with an experimental method. (Its similar to wedges but the purpose is to predict an even more accurate number more consistent then drawing measured moves) I am looking to potentially long 31900 however as more structure reveals its self the price target with this method is consistently changing unfortunately. Mostly posting this for entertainment purposes but it is a clear probability in my eyes at the moment.

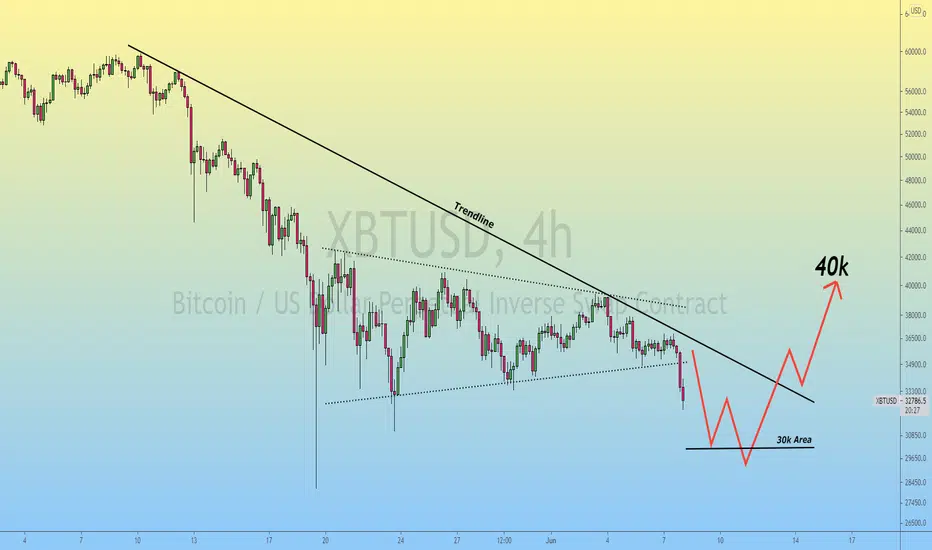
Bears in Full Control But Still Bitcoin can Bounce Back..!!#BTC (Update)
Bitcoin has been Moving Below the Trendline Since 10th May 2021 📉
Bitcoin Bulls lost the 34k Horizontal Support Area & At the Moment, Bears in Full Control..
As Bitcoin Looking Bearish & Might Retest the 30k area, If Bulls Held the 30k PYCHOLOGICAL Support & Bounce Back, Expecting Bullish Wave towards the 40k in Mid June 🔜
In Another Chart, in 4h Timeframe Chart, Bearish Pennant Broken Downside 📉
At the Moment, Bitcoin Bears in Full Control & If Bitcoin lost the 33.3k Horizontal Support Area (GREEN), Next Stop would be 28k Area..
If Bitcoin Remains Above the 33.3k Support Area, Bitcoin Might Bounce Back towards the 38k (Resistance)
Please like the idea for Support & Subscribe for More ideas like this and share your ideas and charts in Comments Section..!!
Thanks for Your Love & Support..!!

buy ADA #ADA:
ENTRY: 1.69 - 1.72
TARGET: 1.84 - 2 - 2.4 - 5
Stoploss: 1.6299
chart ADA is so good now. Time for buy it

Bitcoin Daily AnalysisOn the 1 day chart, Bitcoin is now below the 200 and the 233 EMA . (yellow and orange)
The 20 SMA (pink) has met the consolidation triangle at the top of the current candle. Usually the price of bitcoin follows the 20 SMA closely if you look at the past price action.
Yesterday we had a bearish engulfing candle.
With the combination of these things, I would expect continuation to the downside today.

Bitcoin PredictionI believe this will happen for Bitcoin in the future. I am logging off for a bit. Hope trading goes well for you all in the meantime!

Bitcoin Consolidation ContinuesBitcoin consolidation continues within the triangle for now. Keep an eye on the 20 SMA.

Wait for buy BTCBTC UPDATE: wait for buy spot BTC at 35500-35800. In shortterm, I see BTC is formed inverse H&S. Spot buy, not margin at this time.

Bullish Failure We have a failed bull momentum play to the upside. I personally believe shorting as we retest some of these moving averages is the play. I hate to see it bc I own spot bitcoin, but I think down is the way short/mid term.

Bitcoin Trade TargetBitcoin has broken out of consolidation to the downside. Using the flagpole to flagpole method gives us a trade target of about 16k!
Good luck

TIME FOR BUY BTC EVERYONEMargin signal:
Buy BTC at 35700 - 36000
Stoploss: 34998
Target: 37500 - 39300
Use low leverage for this signal and use stoploss for it

Buy ZIL#ZIL
ENTRY: 12800 - 13100
TARGET: 14800 - 16300
Stoploss: 11839
Zil is beautiful now. Good volume. Time for it wake up

Wait for buy BTCBTC UPDATE: it’s just my idea, not a signal. We will wait now and I will update the signal soon


