RYCEY ROCKETAlright, yeah, yeah, yeah Yeah believe in yourself
As 2 CHAINZ said - believe in yourself! Believe in the Rolls.
Finally we look poised to breakout to those $2 targets. Riding this breakout zone for too long!
We are all aware of the building divergence on the charts, but the sellers look gassed.
ABC seems complete, for the corrective wave B.
I am holding a conservative view and calling this an ABC up rather than w3. Again, remaining conservative for the lower fib targets for the next wave up.
Xbt

Involved with nodes
The four-hour timeframe reacts in the same node and for the second test, so that this node is not engulfed, do not think about continuing to climb. After reaching the blue box, wait for $35515 to be seen and then think about continuing to fall
-----
The two-hour time frame is still involved with the node that infiltrate takes to the next node, the second node is at $42900

Time to short BTCMargin signal: Short BTC at 39100-39200. Stoploss: 39639. Target: 37200-37600. Use low leverage for this signal and use stoploss for it

BUY SFP, ONE OF SON OF BINANCE#SFP:
ENTRY: 1.20 - 1.22
TARGET: 1.35 - 1.5 - 3 - 6 - 9
Stoploss: 1.13
As you know, #SFP is one of the coin I like much. Their team is so good and they have a bright future, good plan.
I invest #SFP for long term, not short term

Time to buy more BTCBTC is following our plan
And now it’s time for us to buy it
Near stoploss,high target…
For some one who bought it at 34k as my signal, please hold it for a long time.

bullish alternative (ewt update)you all seen my bearish ideas, well this is my bullish one.
i'm cautiously bullish from here.
Note, I have 97k as my final upside target, and not 100k.

Wait for Buy BTCBTC UPDATE: we are right, BTC broke out the triangle and rise up. Buy BTC now??? No No No.
We will wait for BTC retest and buy it as the chart below

BTC on the way upPosted these targets a little while back. Thought we could see some ranging near the end and that happened. Now we are still looking good for 42k test. Additional targets are marked.
Post chart request below. Thanks!


BUY AKROAKRO IS BEAUTIFUL CHART NOW. RR IS HIGH, NEAR STOPLOSS, HIGH TARGET, BUY IT
#AKRO:
ENTRY: 22800 - 23400
TARGET: 25500 - 28500 - 35000
Stoploss: 21600

BUY AION NOW#AION:
ENTRY: 0.2040 - 0.2080
TARGET: 0.2390 - 0.2800 - 0.3500
Stoploss: 0.1939
AION IS BEAUTIFUL NOW. BUY IT NOW EVERYONE

Bitcoin | Bulls Defending the 34.5k Horizontal Support..!!#BTC (Update)
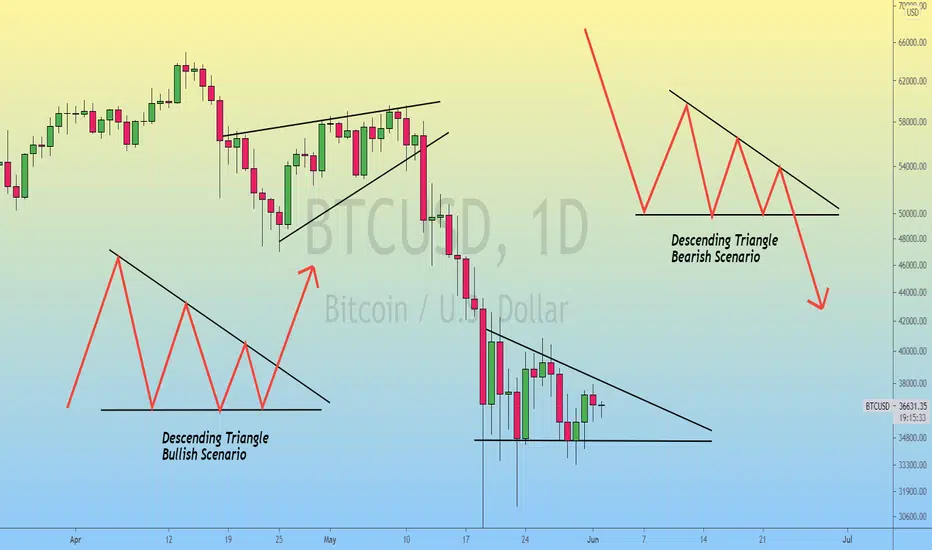
Bitcoin is Consolidating in Descending Triangle from last 14 Days.
Volume has Continuously Decreasing, Time for a big Move?
So far Bulls Defending the 34.5k Horizontal Support, If daily Candle Closed Below 34.5k then Next Stop would be Below 30k 📉
If bitcoin Remains Above the Horizontal Support & Bulls Cleared the Descending Trendline Resistance (37.6k), Bitcoin Might RETEST the 46k 📈
Please like the idea for Support & Subscribe for More ideas like this and share your ideas and charts in Comments Section..!!
Thanks for Your Love & Support..!!


Bitcoin - Sell In May & Go AwayLooks like a possible continuation triangle pattern with volume /distribution towards the top of the triangle.
ABCDE pattern could be completed with possible break down/continuation to the downside in the future.
Recent price action slightly broke out of the triangle pattern but it looks like that was to go up and touch the volume point of control which was around 37, 915.
Expecting more downward movement in the short/medium term.

BTCUSD | XBTUSD | SHORT | Areas of interestTrend: Bearish
Retail Sentiment: Bifinex
Long positions = 47272 🤦🏾♂️
Short Positions = 854
Shorts are slowly decreasing as we move stronger into the bearish trend. Not making a lot of sense why people are increasing their long position in this bear market. Still struggling to find GREAT areas to buy from so I will hold tight about being optimistic.
Buy-side imbalance areas are not as aggressive until we get closer to $20,000 👨🏾💻
Currently, I am bearish on Bitcoin, where I will be focused on the sell-side (red) areas of interest. As an intraday trader, I will be looking for a good setup to trade back into the trend. buy-side areas are great for exits 🕵🏾♂️
Happy Trading
Regards
LBM

BTC UPDATEBTC + 2500 USDT profit now. In my opinion, BTC will rise up and altcoin will fly hard this month

Bitcoin - No Trade ZoneCurrently, Bitcoin is in a No Trade Zone in my opinion. I don't see a great signal in either direction.
I would like to see BTC move up to somewhere between 45-47k next but could definitely see the possibility of it falling to the 18-20k area just as easily.
When trading, I suspect that most people lose money easily in the midranges where the price action is chopping back and forth without any good signal of where it may go next. There could be many fakes in either direction up or down and the next move may just be an initial 'spring' to get traders offsides before it moves in the opposite direction with greater strength.
I think the safest play at the moment is to wait until the price reaches 45-47k Resistance or 18-20k Support. After that, you may be able to make a much safer and more profitable entry in anticipation of the next move from those levels.
Good luck and happy trading!

ETH, Trying To Read This Chapter Of The StoryReality check once again for the whole market, always having to learned it the hard way, but i will leave the psychology part for my Bitcoin analysis.
Past days have been some shitty correctional movements, not making clear yet whether this is a correction of the big drop we had past weeks and eventually continue to drop even more (meaning potential bear market). Or that we are in the middle of a correction still of the big bull market rally that started a 6/12 months ago. Meaning we are at the final stages of ending the big ABC correction i talked about past 2 months for Bitcoin.
First of all, the thick black line is to me the main trend line for ETH. This one can not break, because it would increase a lot the chances that the bull trend has really ended. The drop we saw past week was pretty big and violent, not rally fitting the picture of a bull trend, but this is crypto and things get exaggerated a lot on both sides, so keeping options open because of that. One has to draw the line somewhere and for me the end of the road is that thick black trend line. Hard part is, as you can see price dropped below it twice even, second time even way below it, but it never had a daily close below. So when do you know it will close below it? Well you can't until it really closed, why trading markets can be so mean and is very difficult.
The blue zone on the right, even if the market is in bull mode coming year or longer even, i would then see that part as smart money taking advantage of a rally going too fast and too high. As if they see that as a big advantage, getting a very big price for something that it's not yet worth it. Obviously also having the volume to push prices back down to buy back cheaper. Just imagine, if you bought at 1000/1500 and your getting 3500/4400, if you rebuy the X amount of ETH back around 2000/2500, you actually have that same X amount of ETH for free, so whatever happens you can never loose any money anymore. There is more to it, but too much to discuss now.
Now the chart on the left, this is where i try to determine what the story is for the coming weeks/months. Few days ago i posted that bearish wedge of ETH, but that it seemed as if bears were failing to make it drop. Giving the impression that it would do a breakout up but at least a stop hunt before retesting the lows again. Now we can see it wasn't able to get close to the 3000 resistance zone and started dropping again.
Now what doesn't make sense to me is the following: Whether it's bull or bear trend, whales are always in control of the market. So, if we are really headed to prices below 2000 (and below 30K for Bitcoin), then why didn't we see a stop hunt above 3000. A stop hunt to sell longs and/or short. Why i tend to think, maybe they want to keep the stop hunt level (3000ish) in tact, because the plan is to eventually go up and use that zone to add fuel to the breakout.
So higher time frame, except for wicks, the range seems to be 2100 and 3000. Short term think the thick black line on the left might determine if this short term suppressing of the price might be done as well and could be headed towards the 3000 stop hunt zone. So we have 3000/2100 and actually in the middle the 2500/600 zone.
There is a version that everything i talked about above, is all just a coincidence and has no meaning at all. That is that even the whales are panicking and are not even trying to risk to buy up the price (to sell/short higher) before making it drop even more. That is because of the China FUD and the issues with Tether. The last one i simply don't understand why they can't be transparent about what they do. They have been shady since day 1 and simply continue to act that way.
There is one more thing i want to add, because the drop since 2900 has been similar speed as the move up week ago from 1800, indicates there is a possibility for a double bottom. Just the problem i have with, getting back to 1800, would mean the green zone breaks and would also mean a daily close below that thick trendline on the right chart. So it would give too many variables, but just wanted to point it out in case we do drop back to 1800.
So, short term i think the key zone is that middle line on the left which is around 2550 at the moment. Above it bulls are in favor to attempt to break 3000, below it bears in favor to attempt to break 2100ish. At the moment it's still looking very weak, seeing small attempts to move up since yesterday even, but they get slammed down pretty fast.
Also one more note, for the day traders out there. In general, during impulse waves (big moves) it's easier to make profits. During consolidations, whales try to take the profits you made then, with countless shitty moves and tiny small breakouts on low time frames which frustrate you eventually causing you to loose even more money. So even make it so bad, that they loose everything and end up with a zero balance just before the real move starts again, then it goes without you. Try not to fall for it and save your money for the real trend moves, the easier moves. It's a common mistake that always happens during any kind of trend.
Don't forget to like if you appreciate this and want to support me :)
Previous analysis:

BitcoinWe touched the 61.8% level and the symmetrical triangle support line at the same time. BTC formed a falling wedge pattern. I expect a 10% rebound to the triangle resistance line. RSI is oversold.
According to my vision, we will trade in the 32-45K range during the next month.
Best regards, EXCAVO

BTC IS SO BEAUTIFUL NOW. IT'S OPPURTUNITY TO GO SHOPPING MOREBTC UPDATE:
This is my idea for BTC now
Head and shoulder form in BTC now.
Our plan not change. bullish and bullish.
Not play margin at this time now. For spot, you can buy BTC again at 34k-35k.

BTCUSD 1D BITFINEXThe parabolic structure was destroyed with the 50% drop which weakend the derivatives market.
Spot buys are dominating here.
Basic support $31K, basic resistance $40K, expecting a boring June and ranging here, followed by a move on the upper range and ranging until the end of the summer.
250DMA provides a crutial support, would not count on it to be broken in anyway. I dont expect a daily close painting a lower low. The volume of the spot buys in the low 30s is just too large to let that happen.
21WEMA provides a critical resistance, we must break it in order for the market participants to gain confidence and leverage long again.
This is accumulation phase, means anything under 40K is a good spot buy and if you are a scalpler you can try timing the market with this range, tbh looks like an easy work, just dont overleverage.
Im full expecting a new ATH in October this year.

BTCUSD | XBTUSD | SHORT | Areas of InterestTrend: Bearish
Retail Sentiment: Bifinex
Long positions = 44005
Short Positions = 1188
The bounce on the 19th of May was a hit at 50% off the all-time high. Shorts are slowly increasing as we move stronger into the bearish trend. There was a nice reaction to the Sell-side imbalance area. It would have taken a lot of buyers to push this past the Area of interest
This market will move fast down into the buy-side imbalance areas which are not as aggressive until we get closer to $20,000 👨🏾💻
Currently, I am bearish on Bitcoin, where I will be focused on the sell-side (red) areas of interest. As an intraday trader, I will be looking for a good setup to trade back into the trend. buy-side areas are great for exits 🕵🏾♂️
Happy Trading
Regards
LBM
