WAIT FOR LONG BTC AT ...Margin signal:
LONG BTC at 36800 - 37000
Stoploss: 36139
Target: 38700 - 42500
Xbt

bitcorn ewt updatenot much has changed from the previous post:
just fine tuning a few things
➖➖➖➖➖
🔮 buy 25k
🔮 sell 49k
🔮 buy 16k
🔮 hodl
➖➖➖➖➖

BTCUSD | SHORT | Areas of interestTrend: Bearish
Retail Sentiment: Long, with an increase in Bifinex long positions
The bounce on the 19th of May was a hit at 50% off the all-time high. Shorts are slowly increasing as we move stronger into the bearish trend. Expect a retrace before continuing on the bearish trend
This market will move fast down into the buy-side imbalance areas which are not as aggressive until we get closer to $20,000 👨🏾💻
Currently, I am bearish on Bitcoin, where I will be focused on the sell-side (red) areas of interest. As an intraday trader, I will be looking for a good setup to trade back into the trend. buy-side areas are great for exits 🕵🏾♂️
Happy Trading
Regards
LBM

BTCUSD ~ Possible last FUD dump for big money to accumulateThis is a highly speculative post.
I just have a feeling, that we havent been in this range long enough, for the elites to buy what they want.
This crash was extremely manipulated for big money interests to get into bitcoin given how many of them have finally realized it is the apex asset of the human race and they needed to get in.
Elites and big money of course - dont buy assets at the top of a big pump - they want good prices to get their entry.
So on rolled the FUD campaign...
Anyway, thats old news now....
On to the prediction here: I think we are going to hit our heads on this resistance level (which we are doing right now while I write this) and range down to the lower support.
One major driver of sell pressure has been the chinese miners. China is indeed cracking down on miners, and this time, chinese miners have really had enough - many of them are already moving out of china now.
The majority of sell pressure in the last few weeks has been from them. They are also selling off mining machines, and I am putting something together to buy a bunch and increase the size of my mining farm substantially with highly discounted mining rigs.
But anyway that is what is going on from what I can tell, and I think there is still a big enough supply of cryptos that the chinese miners need to offload. More of them are making the decision over these days going by that they do actually have to shut down mining operations in china and either move elsewhere - or just exit the industry if they cant access infrastructure and electricity in other countries. (Khazakstan has just seen a chinese miner move over there and begin building a $60M mining operation for example....but I know that many chinese miners arent going to leave china to continue mining, they'll just exit and sell what they need, to wrap up costs and close their businesses).
We could be going up further and it would be good to see, but there is still sufficient selling pressure coming in over the next weeks and possibly month that there will be good buy opportunities (i mean, technically, you could buy right now and its still a great opportunity in the long run...)
Lets see if the sell pressure is enough to withstand the immense buying pressure!
Those miners still do have access to sell their coins OTC so it might all be done off the books.
My goal: accumulate as much more as I can while these prices are at all-time-lows.
We arent going to see bitcoin this low ever again, and many alts still have 150% moves back to their previous ATHs which makes them very good buy targets too.

Bitcoin | once again Bulls Looking Strong..!!#BTC (Update)
In 4H Timeframe Chart, Falling Wedge Breakout & Retest Already done with Strong Bullish Volume.
At the Moment, Bulls Breaking the 39.6k Resistance, If resistance got Cleared, Next Stop gonna be 46k.
Bulls Looking Strong so Expecting Another Bullish Wave .. (Bitcoin Will be Bullish Above 40k)
Please like the idea for Support & Subscribe for More ideas like this and share your ideas and charts in Comments Section..!!
Thanks for Your Love & Support..!!


Bitcoin - Global channel + CyclesGlobal channel
I looked at the logarithmic chart and saw: a global uptrend channel, the upper line of which we tested and did not breakout. Bitcoin at the threshold of a new big cycle, which is a little over a year long.
After that, Bitcoin made a dropped by 50% from the peak and reached the previous correction's support level. Now BTC has rebounded and is trading at 25% from the local low.
The current local resistance level is 41k.
The long-term magnet is the middle line of the ascending channel and the peak of 2018 (the 20k level, maybe lower). It is important to note that this is a global vision, not a short-term one.
To my mind, speaking about short-term perspective, there will be a rebound to be sure after such a fall.
I understand that there are many newcomers on the market now. The last fall was a shock for the majority of traders. I want to give a little advice (read below).
1. Calculate your future compulsory expenses for the next 6 months minimum.
2. Compare them with the available one
the amount in stablecoins and cash.
3. If there is no pillow in stable assets for at least 6 months falling market then cover the part on rollbacks up positions to form a pillow for expenses for at least 6 months.
4. If there is, then all the same sort out portfolio and sell on rollbacks up those assets, in fundamental, values and survivability on potential bear market which you doubt very much.
Summary:
Your risky part of a cryptocurrency portfolio should consist only of fundamental assets with a high probability of gaining a network effect.
You have enough money for at least 6 months. You are not motivated to sell assets at the bottom. We are ready to sit out any drawdown. You should understand that sooner or later your assets will cost more.
You can safely continue living a normal life without checking the charts every few minutes. You realize that no matter what happens - you have the money for a good life and a portfolio of quality assets for financial independence.
I do not want to give you false hope. Trading is not easy and risky.
A trader earns big money when trading in the main trend direction. I expect a flat movement on the market shortly.
This is the time when most people are losing money.
Best regards EXCAVO

Bitcoin (BTC) • Pullback while we don't have stronger signs Bitcoin finally broke the trendline coming from the top and it's likely that is on a corrective pullback (not return to bull run)
I don't buy the "we found the bottom" narrative just yet since we don't see strong volume signs coming from different markets, specially futures.
Funding rates are also pretty flat at the moment which reveal a lot of uncertainty.
At the moment I see potential correction to 45k range (max 48) then retweet recent lows once again. But it can easily keep marking down further from here since that is the dominant trend (a mix of daily and weekly) at of now.

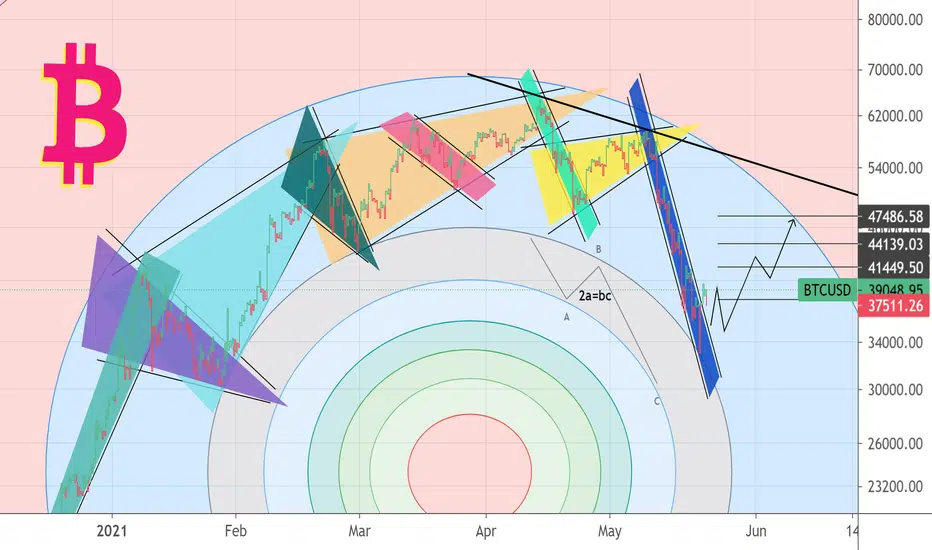
Bitcoin Price Outlook 26 May 2021 - Prior CME expirationPrice of Bitcoin stabilize below $40000, looking for correction from down move towards 50-ish zone. Now price still inside curved area and might touch the resistance of curvature.
Take a look at indicators here on pic below
RSI showing nice Bullish divergence
but Price remain below DMA200 and DMA100
taking this 2 factors give us opportunity to see price rebound upside towards 50-ish zones to retest DMA100.
In fact there is CME futures contract expiration period for trades opened above $20000 and $30000, so seems like institutional traders fix their profits now.
Best regards
Artem Shevelev


Bitcoin Hi, this is a more local analysis of the Bitcoin situation.
After the recent falling, many are wondering - what's next?
And nobody will tell you what happens next for sure, but I will give my suggestion about the upcoming movement.
Making predictions is an unfortunate business. As you understand, I am engaged in this business. For me, it is about studying the financial markets, behavioral economics, cycles, and other aspects of the market. I'm definitely not a visionary. I analyze the market and share my observations with you. Your best "thank you" is Like and Comment!
Continuation
I'm sure 90% of traders will soon see this beautiful Head and Shoulders reversal pattern. People will definitely open the short positions around the resistance line.
I want to warn you - the most dangerous time for beginners is the flat period or sideways movement of the market when the instrument moves in a small corridor.
After most of the market participants gain short positions, a short squeeze may occur - this is the liquidation of short positions. In other words, the achievement of stop losses - in this case, the position is closed by market price and, accompanied by green candles.
If this happens - we will see a super bullish formation that will be deceiving. We will possibly make a reversal movement and go to test the level of the previous high-level 20k. It will be accompanied by the new record numbers of the long positions liquidations.
This forecast may not be valid. I see this scenario as one of the most plausible for me.
Do not trade with margin, leverage, observe risk management, best of luck to all, and big profit.
Best regards, EXCAVO

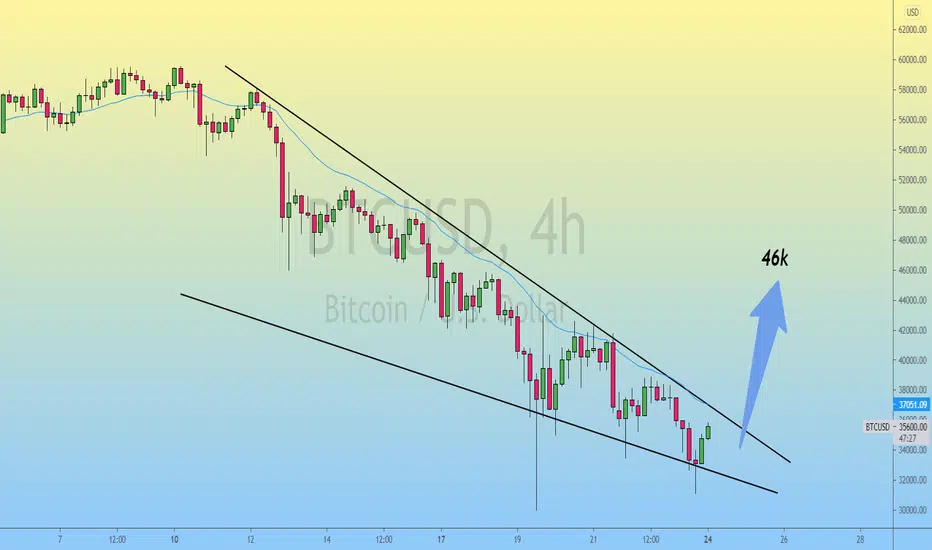
Bitcoin | Falling Wedge Formation..!!#BTC (Update)
Falling Wedge Formation in 4h timeframe..
RSI Printing Bullish Divergence..✅
If EMA21 (37k) got Cleared, Expecting Bullish Wave towards the 46k 📈
Please like the idea for Support & Subscribe for More ideas like this and share your ideas and charts in Comments Section..!!
Thanks for Your Love & Support..!!

BTCUSD 1W FINEXBTC Weekly
March crash fractal
Finex L/S
seems safe to buy spot, any further dip is just a bonus, buying here anyways. $52K by EOM

Bitcoin Fighting between Bull and bear so what next..?#BTCUSDT TA Update:-
$Bitcoin Currently trading at $37400
And $37000 is good support of 45 minutes chart.
Now...?
Bitcoin trading in small channel so If support 1 hold then we can see upward moments.
Mean Our 1st resistance will be $40000
If $40000 also break upward then ready for $45000
But if $37000 support break down then I am watching $32000-$33000 zone.
So keep an eye on my Levels:-
Support:- $37000/$32000/$26000
Resistance:- $40000/$42111/$45516
Please click like button and Appreciate my hard work.
Must follow me for latest crypto real time updates.
Thank you.


BTC Winter Soldier Edition: Monthly Update.Almost a month since I posted this Winter Soldier Edition (linked at the bottom) I'm going to give you a more specific look at what I believe is going on here long term, including my suspected consolidation zone that I expect to last until mid-to-late 2023.
Someone might say "4 cannot trade into the zone of 1 for correct Elliot Wave" and they would generally be correct, with that said it can and absolutely has previously wicked down into these zones and you should be aware that can happen.
Will it be a straight path to the consolidation zone? absolutely not. Impulse waves will be required to reset RSI levels and it may take many months to reach this zone but the resistance levels are very clearly marked out and you can inter-day trade these targets if you so wish, just be aware as sentiment turns increasingly negative this will become a much more dangerous prospect.
As always, trade however you want to trade, this is just what I'm seeing and what I'm doing in terms of BTC.
Last Month's Winter Soldier Edition:


Bitcoin (BTC) • We might have NOT bottomed at allCurrent correction going on as expected BUT more aggressively than expected.
Chances are now in for a possible retest of 45k and new lows at 25k due to ongoing gaps visible on BAKKT and CME.
The 25k range is also confluent with Monthly average of November and a relative 50% between the high/low during that period of time.
Here's what I think might happen. (but its irrelevant. We should evolve with the market)

More Downside Coming For BitcoinI am expecting further downside in Bitcoin. When looking at the net buying/selling pressure, the current time looks very similar to August 2019. After the current dead cat bounce, we can expect to test 26k support and possibly lower.
The white/grey line represents the net buying/selling pressure on the indicator. You want to look for crosses above and below the midline as well as crosses above 30. A cross above 30 means that the bulls are in control and the price could rise rapidly.
Looks like we are very bearish in the short term.

Bitoin Shock TherapyBitcoin price did a -45% correction, so far price went below DMA200, which is indicator for long term traders/investors and if we will stay below it for reasonable amount of time, that would sinalize further dump.
IF price will manage break upside above DMA200 and stay above it, we could be safe in the long-term goals, and see btc floating around 100k by the end of the year.
Stay calm, make sure you running affordable risk.

Bitcoin Long to 50kBitcoin has retraced 50% of the first impulse wave from the bottom and touched the bottom of the 15M ichimoku cloud as support. Looking for longs as continuation to 50k area.
