23k ----> 49k -----> 12ktitle says it all. i talked about this idea before, but got sidetracked with all the bullishness.
good luck!
Xbt

Bircoin has support nowThe impulse of this wave is over and if you look better this extreme panic will be scalped by dip buyers. Long positions will continue until first target 46k.
another wave of sell will be started above 46k.

Bitcoin Ready for $50000 or $23000..? very Imp Update#BITCOIN TA Update:-
$BTCUSDT currently trading at $38000 and made low of $36200
This is last support to hold aome Retracement upward side.
If this last support also break down then I am expecting $30500 and $23000
But total -44% down from All time high so Need to some recovery.
Also I can expect Altcoins bounce back from here.
Last support:- $36675
After if break down
Support:- $30533/$23111
Resistance:- $49266/$59339
I am also in big loss in many positions but I am still holding my positions.
Not open any new positions.
Thank you.

Bitcoin Spring to 50k AreaBitcoin dipped into supply and could spring back to the 50k area. Target 50 - 54k.


XBT uptrend will beginAs you see, XBT after the correction will begin the upward wave 5 and the target is up to the area I've declared (normally).
Due to extension of wave 3 and sharp collapsing of wave 4, the wave 5 can be truncated.
So consider every probability!

Bitcoin (BTC) • The correction Bitcoin was long due for deeper correction and we are finally seeing it unfold possibly for the reasons discussed in my previous video.
Today, I take a look at the trend and some structural technical levels to be paying attention in the near future. Also cover liquidations, funding rates and futures premiums.

BTCUSD 1D BitfinexBitcoin on the Daily with a bunch of indicators:
200EMA
TD9
618FIB
NVT
35% correct, sure looks like the bottom if you compare to the 2017 bull run.


A clear wave of five waves ended, and Bitcoin had a short breath Bitcoin has been so weak recently that the total market value has reached 40%, a new low since 2018. The rise of copycat coins and Musk's constant denigration made Bitcoin a little out of reach. But Wang will always be king. Without Bitcoin, I don't know if the digital money market can survive, because 99% of tokens come from Bitcoin. Of course, history will always be subverted, and one day the digital money market will be replaced. But for now, Bitcoin is still the soul of the market. If Bitcoin falls 90 percent, most tokens will return to zero.
Far from it, there are things that require historical falsification, which is not the key for secondary market traders.
We may be more concerned about today or tomorrow's trading points. Back to the chart, here is a clear wave of 5 waves down ,30, about a week. From time to space, there should be a decent rebound here. But from the day line, the long-term box at any time to break, the day line macd short trend has not changed, the average line ma144 lost. Panic index fell below 20, can be said to be embattled in all directions. But I believe that the market has a strong law of its own, we should not use their subjective will to judge the trend of the market. It's a favor.
There must be a 2-hour rebound, the difference is space. If we look at the rebound caused by the two bottom deviations, it should be a challenge in theory ma144, but we can't rule out the possibility of a rebound in time. So this is the principle of trading.
I have always stressed that the right-hand standard, which is not limited to buying, stop loss or stop earnings, is also valuable.
macd+ma operation, in the past period of time has been fully verified. When we fell to about $45000 on May 13, we proposed that this would be a two-hour L chart (about how the L chart works, my history article can search), and we tend to double-dip, forming a bottom deviation and rebounding. But I gave a limit ma36, that's the key to a lot of people who do n' t understand deviations (many question the validity of deviations because they don't add limits to deviations). macd deviation has proved to benefit from it ma36, so we have avoided the technology trap perfectly.
And now, I think, the probability of this secondary deviation is very large, and the probability of rebound is also very large. Similarly, we still have to add a limit to the deviation, ma18. if we break through, in theory we look at two rebound heights, one is D front point, the other is the ma144. point Of course, any analysis is based on the principle of probability, so operational insurance is transaction discipline. When the rebound fails and triggers the stop loss index, remember to leave. (If you expect every judgment to be correct, you might as well expect time back)

This is not the beginning nor the EndIn September 2020, when bitcoin was 10400 I published an analysis with a 100k price target in the next 2 years, why I changed my target and duration of the bullish rally on April 13, 2021, just one day before Coinbase IPO. and on April 29, I updated my target to 42-46k between May 10-20th.
Why did I change my target?
The best answer to this question will receive 1500 TradingView coins (1 month Free Pro subscription).
Write your answer below the TradingView post as a comment.
1-Sep 12, 2020: Bitcoin could technically soar to 100 Thousand, what next?
2- Oct 21, 2020: Do Not Trade Bitcoin, Invest in Bitcoin for The next 2 years!
3-Apr 13: History tends to repeats itself..!
4-Apr 29: An updated target for Bitcoin

Bitcoin Exclusive Update and Ready for $31000 or $55100...?#BTCUSDT Exclusive TA Update:-
#BITCOIN is currently trading above 200 Days Moving average near to $43000.
BTCUSDT price Still respecting and strongly the following support.
So now, what next...?
We are waiting for the daily candle close, if the daily candle closes above $44400 then This is good for Some upward move.
But if not then what next...?
If the daily candle closes below the support level then we are ready for next support 2 and Support 3.
200D EMA Support:- $42104
Support:- $44400/$39444/$31975
Resistance:- $48687/$55100
Please click the like button and Appreciate my hard work.
Must follow us for the latest crypto real-time updates.
Thank you.

Bitcoin Some Elliot Wave optimismHere is the Bitcoin on Daily, showing pretty nice wave setup
below is the pic of how it looks zoomed out

I wouldn't be surprised if Bitcoin dropped to $20,000 this time If $40000 falls, I won't be shocked to see $20000 of Bitcoin this time next year.
In fact, the market has been highly speculative, even the so-called Wall Street institutions have entered, can not prove that the market is very mature. Because there is no regulation, a so-called decentralized market, is controlled by some central institutions. An inappropriate example, like a group of 21st-century, heavily armed thugs, traversed a primitive tribe that was still slash-and-burn. At this time, the original order was broken, the original rights were subverted.
Is the current direction of the development of digital money the original intention of Nakamoto? Is there a community spirit that would have challenged totalitarianism? When Bitcoin becomes a tradable commodity, its intrinsic value may have become a tool for some people to profit.
Since it is highly speculative, then the boom must have plummeted. So I think if the $60,000 head is confirmed, there should be a one-year adjustment cycle, and the decline is not an exaggeration in history.
Advice: traders should know what their purpose is.
If you are a believer, you should reflect on whether your faith can withstand the test of time. If you confirm that this is the right decision, please do not look at the market with a gambling mentality, you should stay away from secondary market transactions.
If you are a speculator, don't think about any short, you have to make a difference, your biggest risk is that the money is locked up. In a market without fundamentals, charts and indicators are the tools you can rely on, and the right side is your good friend.

Bitcoin Finally Entered in Bearish Zone so Ready for $33000..?#BTCUSDT TA Update:-
#BITCOIN currently trading at $44500
This is a bearish zone.
Yesterday broke out resistance again dumped because that was Trap.
Now..?
Now overall bearish Bitcoin in the daily time frame.
What next support..?
According to This chart Bitcoin, last support is $45100
And 300D EMA support is $46382
So I am waiting for daily close.
If the Daily candle closes above $46400 then we can think about Bullish scenarios.
Otherwise, we entered the bearish zone.
I already told you when BTCUSD broke down $59000 that time we entered the bearish zone.
But Still, last hope to hold bull zone.
Bullish scenario depends on Support 1
What if not close above support..?
If Not close above $46400 then Ready for $33176 and $26480
Not instant guys but in mid-term.
Support:- $45000/$33176/$26480
Resistance:- $59839
Please click the like button and Appreciate my hard work.
Must follow me for the latest crypto real-time updates.
Thank you.

BTC BITCOIN Heading to 45K IMP WEEKLY WEEKLY MACD CROSSOVER XBTBTC BITCOIN Heading to 45000 - IMP WEEKLY WEEKLY MACD CROSSOVER

just to claim clout if this gamble paid off.Weekly momentum red after weeks of green.
Elon selling ending bullish talks about institution buying.
Retest of $20k still maintains bullish HTF bias.
"No way" mentality on this one.

Bitcoin brokeout resistance and bullish so Ready for $56000..?#BITCOIN Breakout Update:-
#BTCUSDT currently trading at $49100+
And now broke our all resistance with high Volume and Now I am bullish.
As I told you $48438 is strong resistance and if breakout then Bullish scenario for Bitcoin.
Now...?
Now 2 more new support levels:-
Support:- $48438/$47796
Resistance:- $51362/$54706/$56835
Now I am watching my Target/Resistance level.
Please click the like button and Appreciate my hard work.
Must follow me for the latest crypto real-time updates.
Thank you.

Bitcoin Historic OverviewThis is something that I made for fun to educate myself about the cycles of Bitcoin, I hope you learned something too!

Bitcoin | Rising Channel & MA128 Support..!!#BTC (Update)
In 1D Chart, Bitcoin Bulls Already lost the MA50 & MA100 Support Levels But From last 3 Days, Still Bulls Defending the MA128 (49.8k) & Channel Support (49k)
In Worst Case, If Channel Broken Down & Bulls lost the MA128 Support too, Next Stop would be 30k Horizontal Support Area 📉
In Bullish Case, If Bitcoin remains Inside the Channel & Above the MA128, Expecting Higher High (68k) 📈
In Weekly Timeframe Chart, Bitcoin is Still Moving Above the Weekly EMA21 (46.6k) , EMA21 Acting As Support Since May 2020..!!
Fingers Crossed 🤞
Please like the idea for Support & Subscribe for More ideas like this and share your ideas and charts in Comments Section..!!
Thanks for Your Love & Support..!!

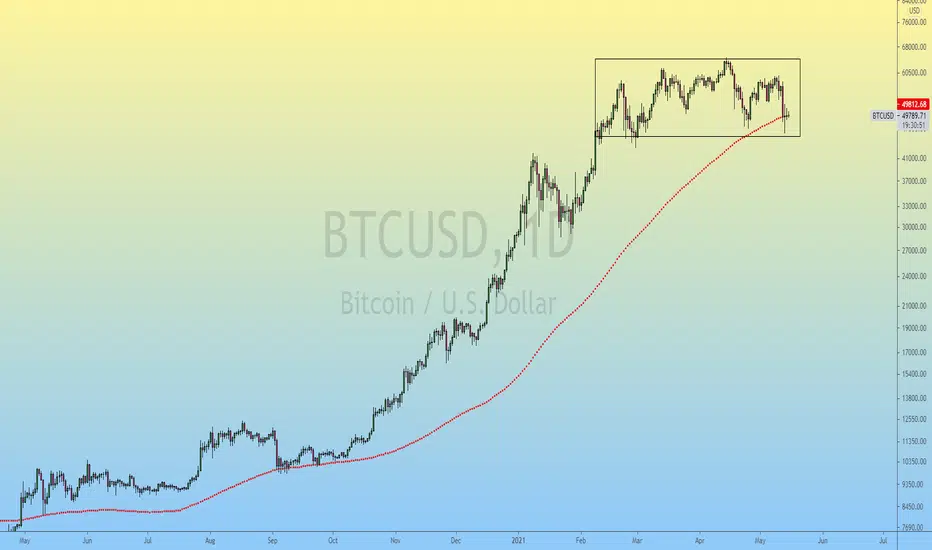
Bitcoin | Daily MA128 & Weekly EMA21 Both Acting As Key Support.#BTC (Update)
In daily timeframe Chart, Bitcoin is Moving Above MA128 (49812)..!!
In 2016-17 Bullrun, Daily MA128 has Played An Important Role & Now, Again It's Acting As Key Support Since MAY 2020.
In 2016-17 BullRun, Bitcoin Tested it 5-6 times & Went up from it, 📈
If Bitcoin Remains Above MA128, It'll be Good for Bitcoin & Alts as Well..If Bulls Lost the It then Bitcoin Bullrun will End Soon like 2017. 📉
In Weekly Timeframe Chart, Bitcoin is Still Moving Above the Weekly EMA21 (46.6k) , EMA21 Acting As Support Since May 2020..!!
If Weekly Candle Closed Below the EMA21, Bitcoin Might Retest the 30k Support Area. 📉
Please like the idea for Support & Subscribe for More ideas like this and share your ideas and charts in Comments Section..!!
Thanks for Your Love & Support..!!
Bitcoin Ready for $56000 in short term analysis.?#BTCUSDT LTF update:-
$Bitcoin currently trading at $49500
And the Last post about the bitcoin I told you we can see Retest at $49800
Now done.
Now...?
After Retest we can see an upward moment from here.
But..?
$48942 is good support and Retest 2.
So this is also good and last hope for the bull scenario.
Don't panic above $48500
Support:- $49700/$48600
Resistance:- $51362/$54704/$56835
Please click on the like button and appreciate my hard work.
Must follow me for the latest crypto real-time information.
Thank you.

