BTCUSD broke above range with strong bullish candle,what next.. BTCUSD
yesterday I was bearish on BTC as it was trading below support/resistance structure, but that changed after price broke above the resistance with a strong momentum. Now after a short pullback/correction if price holds above support I expect the price to move higher towards the next resistance..
Push LIKE & SUPPORT the Idea...
*The content on this analysis is subject to change at any time without notice, and is provided for the sole purpose of assisting traders to make independent investment decisions
XBTUSD

BTCUSD showing rejections from resistance, more downside to $36KBTCUSD
The price is below short term support/resistance, and price is showing rejection from the resistance, If price continues to stay below the support/resistance I expect the price to move lower..
Push LIKE & SUPPORT the Idea...
*The content on this analysis is subject to change at any time without notice, and is provided for the sole purpose of assisting traders to make independent investment decisions.

btc 3-9 update ~good evening,
i mentioned in my last update that we'd see a short squeeze if the previous high was breached
and a short squeeze we got.
despite the little squeeze, 'm still looking for 35k in the week ahead.
watch the local golden zone for a potential entry tomorrow.
----
there's an alternative path as well, which takes us up to 50k.
it is a lot less probable than the bear projection, but keep it in mind just in case.
stop losses, always.
✌

btc 3-8 updategood afternoon,
btc seems to be playing out an expanding diagonal as of right now
currently in a wave e (in theory)
wave E invalidation sits at 39536.0, if this level is breached - we will see a short squeeze to the upside.
so long as this level is not breached, we should see follow through to the downside from here to anywhere between 35~34k.

Bitcoin (BTC) - March 8Hello?
Traders, welcome.
If you "follow", you can always get new information quickly.
Please also click "Like".
Have a good day.
-------------------------------------
(BTCUSDT 1W Chart) - Mid-Long-Term Perspective
28130.0-29300.0 or higher: Expected to continue upward trend
41950.0-46930.0 or more: Expected to create a new wave.
Strong support section: 28K-32K
In order to rise above the M-Signal line of the 1M chart, it must rise above the 40100.0 point.
It must rise above the 41950.0 point to turn into an uptrend.
(1D chart)
Resistance section: 46487.52-49266.69
Support section: 27033.35-29812.52
It is necessary to check whether support can be obtained near the 37253.81-38150.02 section.
Support should last until after around March 10th.
That's because we expect the Bollinger Bands to converge more, giving them the strength to continue the trend when they diverged.
It is falling after failing to break through the 45135.66 point and the M-Signal line of the 1W chart.
You need to make sure you have support at the 38150.02 point.
You also need to see if you can break out of the short-term downtrend line.
Recently, the number of days with trading volume above 55.602K is increasing.
Accordingly, the force required for divergence is accumulating.
It is a coin market with an investment environment similar to the stock market, but is a fundamentally different investment product.
The stock market has an entity, but the coin market does not yet have an entity (?), so I do not think it is affected by the current issues in the world.
I think that investment institutions in the stock market tend to follow the flow of the stock market by entering the coin market, but I think it's really irrelevant.
I think the coin market will create a trend unique to the coin market.
Bitcoin's charts are still more chart-following than any other stock market instrument.
I think this is also because there is no substance (?) yet.
The entity will gradually emerge as the coin develops and becomes related to the actual business.
Then, I think it will move away from the chart-following trend and follow the current stock market.
The next volatility period is around April 8th.
------------------------------------------------------------ -------------
(XBTUSD 1M Chart) - Big Trend
All patterns and waves can be known when they are completed, so it is best to conduct a trade that matches your average unit price rather than a trade based on prediction.
Looking at the big picture, I think 4-5 waves are going on.
Depending on how you interpret section A, the wave may be different.
Likewise, you need to be more careful in your trading, because the parts that have not yet been created may have the same flow as section A.
The expected ascent section is near the 80574.0-83397.0 section.
This is an expected value considering the fluctuation range that has risen from the 1st section to the 2nd section.
There are two large resistance intervals to move up to the expected level.
The two large resistance sections are sections a and b.
If it fails to break through section a upward, I think it can represent the same flow as section A.
If it rises above the 72104.0 point with this rise, it is expected that it will not fall below the 26K-29K section (maximum 21K section) even if a downtrend continues.
If the 38K section is touched, it is expected to lead to a sharp rise.
------------------------------------------
We recommend that you trade with your average unit price.
This is because, if the price is below your average unit price, whether the price trend is in an upward trend or a downward trend, there is a high possibility that you will not be able to get a big profit due to the psychological burden.
The center of all trading starts with the average unit price at which you start trading.
If you ignore this, you may be trading in the wrong direction.
Therefore, it is important to find a way to lower the average unit price and adjust the proportion of the investment, ultimately allowing the funds corresponding to the profits to be able to regenerate themselves.
------------------------------------------------------------ -----------------------------------------------------
** All indicators are lagging indicators.
Therefore, it is important to be aware that the indicator moves accordingly with the movement of price and volume.
However, for convenience, we are talking in reverse for the interpretation of the indicator.
** The MRHAB-O and MRHAB-B indicators used in the chart are indicators of our channel that have not been released yet.
(Since it was not disclosed, you can use this chart without any restrictions by sharing this chart and copying and pasting the indicators.)
** The wRSI_SR indicator is an indicator created by adding settings and options to the existing Stochastic RSI indicator.
Therefore, the interpretation is the same as the traditional Stochastic RSI indicator. (K, D line -> R, S line)
** The OBV indicator was re-created by applying a formula to the DepthHouse Trading indicator, an indicator disclosed by oh92. (Thanks for this.)
** Support or resistance is based on the closing price of the 1D chart.
** All descriptions are for reference only and do not guarantee a profit or loss in investment.
(Short-term Stop Loss can be said to be a point where profit and loss can be preserved or additional entry can be made through split trading. It is a short-term investment perspective.)
---------------------------------

btc 3-7 update ~morning,
the idea i shared last night seems to be at play.
looks like we're playing out a wave b of that D wave right now through an expanded flat.
might go as high as 40k, before dropping further into wave c to about 34k.
once this move is completed, i do expect a move up to complete the triangle into wave E before a deeper draw down.

IS BITCOIN IN REACCUMULATION RANGE?History shows how bitcoin moves inside parallel channels, their size so far are similiar so we can try to predict top according to this scheme only if we accumulate and stay in intact accumulation figure. We can drop a little more but we have to keep higher low to 29 k levels.

btc 3-6 update 🔻good evening,
coming through with some bad news here.
btc does not look so hot breaching the local golden zone as i type this.
there was no absorption \ no demand in one of the highest areas of liquidity, which is not a very good sign for the bulls.
-----
i've to deviate from my bullish approach towards the market as of this moment, and lean towards this idea which i shared last week via:
I call this scenario, the wave triangle.
------
i've noticed over these last couple of weeks as btc continued to range sideways, that there was no real momentum behind any of these moves.
we've continued to build bearish divergence on the larger timeframes, and we are currently about to backtest the monthly 21ema yet again.
it isn't going to hold forever, so i do expect a breakdown eventually which will take us to about 24~20k.
this is not something many people would ever think of happening, and it will surely catch a ton of humans off-guard.
as of me typing this, 97.1% of the cumulative market is net long.
2.79% of the market is short.
think about that for a moment.
✌

Bitcoin (BTC), Ethereum (ETH) - March 7Hello?
Traders, welcome.
If you "follow", you can always get new information quickly.
Please also click "Like".
Have a good day.
-------------------------------------
(XBTUSD 1W Chart) - Mid-Long-Term Perspective
Above the 27650.0-29350.0 section: An uptrend expected to continue.
(27650.0-33101.0 section: strong support section)
The 42084.0-47010.0 section is a support section for creating a new wave.
(XBTUSD 1D Chart)
Resistance section: 46695.0-49518.0
Support section: 26932.0-29755.5
You should make sure you have support near the 38225.0 point.
If the price falls below the 37265.0 point, it could fall near the 32290.5 point, so trade cautiously.
However, as the Bollinger Bands appear to have begun to converge, the trend is expected to continue as it moves out of the range of up to 35028.0-45211.0.
The price must remain in the range 42084.0-45211.0 to convert into an uptrend.
However, in order to get out of the bottom section, it must rise above the 40163.5 point.
Therefore, deviations from the 36252.0-42084.0 section of the 1D chart, which is the lowest point, are important to determine the trend.
We need to see if we can break out of the downtrend line (3) with the volatility around March 9th.
The next volatility period is around April 13th.
-----------------------------------------------------
(ETHUSDT 1W Chart)
Above 1728.74 point: Expected to create a new wave.
In order to turn into an uptrend, it should move upwards near the 3343.06 point.
(1D chart)
First resistance section: around 3375.08
Second resistance section: 4191.93-4464.22
Support section: 2285.94-2558.23
You need to make sure you have support in the support section.
If the price declines from the support zone, it may move towards the 1741.38 point, so trade cautiously.
In order to turn into an uptrend, it needs to rise near the 3151.97 point.
The next most volatile period is around April 18th.
------------------------------------------
(XBTUSD 1M Chart) - Big Trend
All patterns and waves can be known when they are completed, so it is best to conduct a trade that matches your average unit price rather than a trade based on prediction.
Looking at the big picture, I think 4-5 waves are going on.
Depending on how you interpret section A, the wave may be different.
Likewise, you need to be more careful in your trading, because the parts that have not yet been created may have the same flow as section A.
The expected ascent section is near the 80574.0-83397.0 section.
This is an expected value considering the fluctuation range that has risen from the 1st section to the 2nd section.
There are two large resistance intervals to move up to the expected level.
The two large resistance sections are sections a and b.
If it fails to break through section a upward, I think it can represent the same flow as section A.
If it rises above the 72104.0 point with this rise, it is expected that it will not fall below the 26K-29K section (maximum 21K section) even if a bear market continues.
If the 38K section is touched, it is expected to lead to a sharp rise.
------------------------------------------
We recommend that you trade with your average unit price.
This is because, if the price is below your average unit price, whether the price trend is in an upward trend or a downward trend, there is a high possibility that you will not be able to get a big profit due to the psychological burden.
The center of all trading starts with the average unit price at which you start trading.
If you ignore this, you may be trading in the wrong direction.
Therefore, it is important to find a way to lower the average unit price and adjust the proportion of the investment, ultimately allowing the funds corresponding to the profits to be able to regenerate themselves.
------------------------------------------------------------ -------------------------------------------
** All indicators are lagging indicators.
Therefore, it is important to be aware that the indicator will move accordingly as price and volume move.
However, for convenience, we are talking in reverse for the interpretation of the indicator.
** The MRHAB-O and MRHAB-B indicators used in the chart are indicators of our channel that have not been released yet.
(Since it was not disclosed, you can use this chart without any restrictions by sharing this chart and copying and pasting the indicators.)
** The wRSI_SR indicator is an indicator created by adding settings and options to the existing Stochastic RSI indicator.
Therefore, the interpretation is the same as the traditional Stochastic RSI indicator. (K, D line -> R, S line)
** The OBV indicator was re-created by applying a formula to the DepthHouse Trading indicator, an indicator disclosed by oh92. (Thanks for this.)
** Support or resistance is based on the closing price of the 1D chart.
** All descriptions are for reference only and do not guarantee a profit or loss in investment.
(Short-term Stop Loss can be said to be a point where profit and loss can be preserved or additional entry can be made through split trading. It is a short-term investment perspective.)
---------------------------------

Bitcoin (BTC) - March 5Hello?
Traders, welcome.
If you "follow", you can always get new information quickly.
Please also click "Like".
Have a good day.
-------------------------------------
(BTCUSDT 1W Chart) - Mid-Long-Term Perspective
28130.0-29300.0 or higher: Expected to continue upward trend
41950.0-46930.0 or more: Expected to create a new wave.
Strong support section: 28K-32K
In order to rise above the M-Signal line of the 1M chart, it must rise above the 40100.0 point.
(1D chart)
Resistance section: 46487.52-49266.69
Support section: 27033.35-29812.52
It is falling after failing to break above the 45135.66 point and the M-Signal line of the 1W chart.
You need to make sure you have support at the 38150.02 point.
We should see if there is movement out of the 38150.02-41950.0 zone due to the 5-7 March volatility.
If the price falls below the 37253.81 point, there is a possibility that it will fall below the 32259.90 point, so you need to trade cautiously.
A move above the 40100.0 point to find support is expected to trigger a move towards breaking through the 45135.66 point.
The Bollinger Bands will start to converge soon as the lower end of the Bollinger Bands has started consolidating.
Therefore, the important thing in the current flow is to check which direction the 38150.02-41950.0 section deviates from.
To get out of the bottom section, you have to climb over 40100.0 points.
The next volatility period is around April 8th.
------------------------------------------------------------ -------------
(XBTUSD 1M Chart) - Big Trend
All patterns and waves can be known when they are completed, so it is best to conduct a trade that matches your average unit price rather than a trade based on prediction.
Looking at the big picture, I think 4-5 waves are going on.
Depending on how you interpret section A, the wave may be different.
Likewise, you need to be more careful in your trading, because the parts that have not yet been created may have the same flow as section A.
The expected ascent section is near the 80574.0-83397.0 section.
This is an expected value considering the fluctuation range that has risen from the 1st section to the 2nd section.
There are two large resistance intervals to move up to the expected level.
The two large resistance sections are sections a and b.
If it fails to break through section a upward, I think it can represent the same flow as section A.
If it rises above the 72104.0 point with this rise, it is expected that it will not fall below the 26K-29K section (maximum 21K section) even if a bear market continues.
If the 38K section is touched, it is expected to lead to a sharp rise.
------------------------------------------
We recommend that you trade with your average unit price.
This is because, if the price is below your average unit price, whether the price trend is in an upward trend or a downward trend, there is a high possibility that you will not be able to get a big profit due to the psychological burden.
The center of all trading starts with the average unit price at which you start trading.
If you ignore this, you may be trading in the wrong direction.
Therefore, it is important to find a way to lower the average unit price and adjust the proportion of the investment, ultimately allowing the funds corresponding to the profits to be able to regenerate themselves.
------------------------------------------------------------ -----------------------------------------------------
** All indicators are lagging indicators.
Therefore, it is important to be aware that the indicator will move accordingly as price and volume move.
However, for convenience, we are talking in reverse for the interpretation of the indicator.
** The MRHAB-O and MRHAB-B indicators used in the chart are indicators of our channel that have not been released yet.
(Since it was not disclosed, you can use this chart without any restrictions by sharing this chart and copying and pasting the indicators.)
** The wRSI_SR indicator is an indicator created by adding settings and options to the existing Stochastic RSI indicator.
Therefore, the interpretation is the same as the traditional Stochastic RSI indicator. (K, D line -> R, S line)
** The OBV indicator was re-created by applying a formula to the DepthHouse Trading indicator, an indicator disclosed by oh92. (Thanks for this.)
** Support or resistance is based on the closing price of the 1D chart.
** All descriptions are for reference only and do not guarantee a profit or loss in investment.
(Short-term Stop Loss can be said to be a point where profit and loss can be preserved or additional entry can be made through split trading. It is a short-term investment perspective.)
---------------------------------

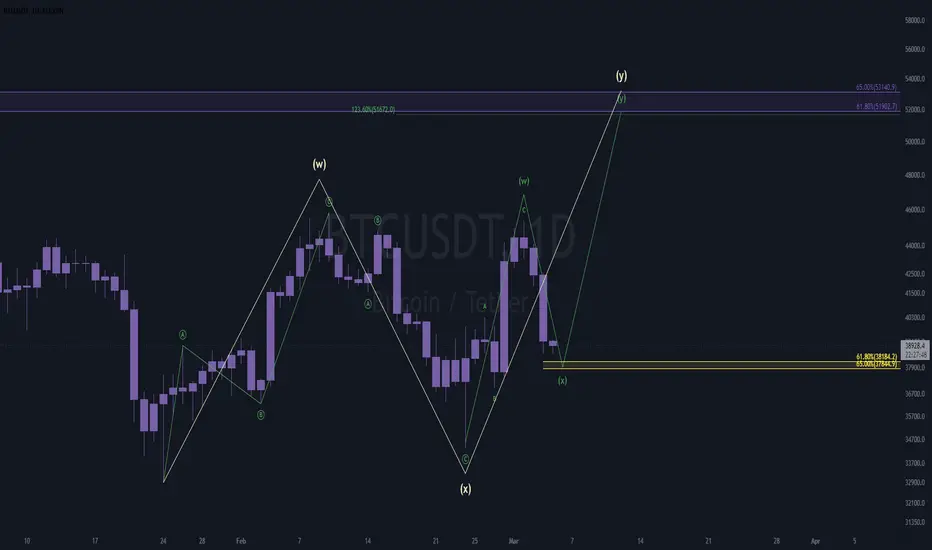
52kgood evening,
i've gotta lean just slightly bullish on btc from here.
this is a scenario i favor very much, and it fits the narrative quite nicely with the traditional market as well.
if this local golden zone can hold, which i do believe it will - i'd be looking for a move up to the larger golden zone at 52~53k.
💸
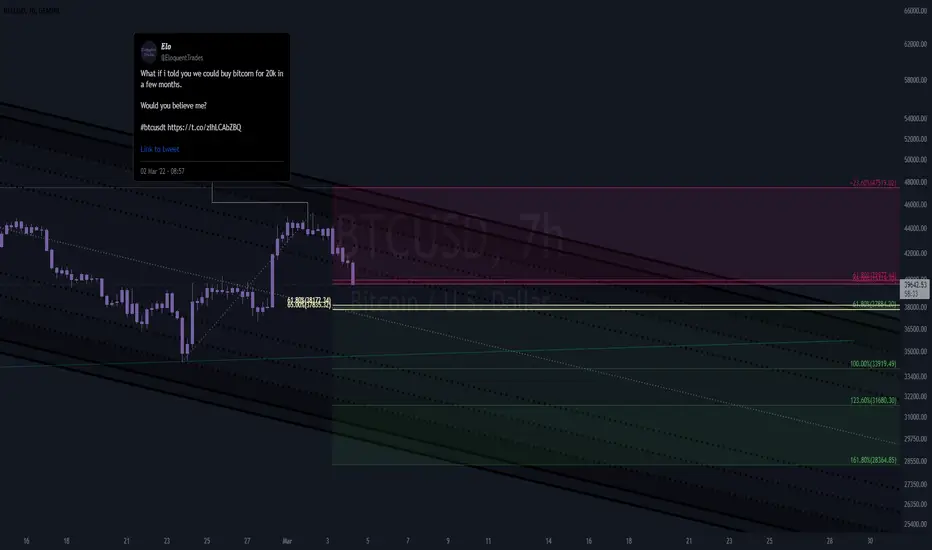
btc 3-4 update (key levels)hello o/
now that bitcorn is in a downward spiral, we can easily disqualify a few of the bull cases.
here's a bear case which has a pretty high probability of playing out ~
i've highlighted this idea many times before, and i've gotta bring it to your attention once again.
-----
another one that i am a big fan of is the wavy triangle via:
-----
there might be one more that i'm missing, but i'll leave a short-term bullish alternative as well - just in case.
and of course, if the local golden zone is able to hold, it might be able to make a push to 47.7k.
-----
overall, i lean toward the idea of btc dropping sub-30k before anything substantial takes place.
✌
BTCUSDT, This route can becoming true because ...Hello everybody
I did something different in my serial previous analysis of Bitcoin. Did you follow us ? Did you read previous analysis ?
I wanna start today different, do you have any idea about the market ??
Do you have any scenario for your capital ? or Do you have any plan if the market drop from here ? Or Do you have any plan if the market wanna move upwards ??
This is the most important thing that you should write it and schedule it to know what should you do in anytime in anywhere in any price of market.
According to the chart and from our last analysis of Bitcoin that we published we expected that the price should drop because of the kind of movement that is similary to the last movement in a range of trading trendline.
And exactly happend what we should thought and now its time to take decision for the live of market that is now.
According to the heavy movement and powerful candle that bullers made, we expect the price can go up again to re-test the resistance zone that we shown, if the price can break this level it can reach to the new target BUT the chance for the drop is more than ago and the price its ready to have amazing dump from here or from 45K to 31K and then we have some rises in there and again we need to have another big dump to 15k and in there zone its time to buy and hold.
Im so tired to write again the reason why the market should have dump if its wanna be alive for the investor and ...
If you wanna know that, you can check our previous analysis
Paradise is near to us, live the moment and love your loved ones as much as you can
Good Luck
Abtin

BTC/USD Wykoff AccumilationUsing the Wykoff theory there we have completed Phase A moving into Phase B.
Key Terms in Phase A
PS – preliminary support, after prolong down-move the buying begins and you can see the stock bounces with some higher volume. It shows the stock is approaching the bottom.
SC – selling climax, panic selling by the public and it is being absorbed by larger professional operators. Normally it comes with bad news and usually appears with high volume.
AR – automatic rally, after the selling pressure has diminished and the buying pushes the price up.
ST – secondary test, the retest of previous SC. Usually the volume is low and large operators are testing the SC price.
Phase B we can expect that the lower levels of support will be tested with a dip down to the lower 30s before the spring in Phase C which is the final test by the large operators to make sure the available supply is absorbed before the markup. It is also the best time for short term traders to enter the trade (If moment is strong we will stay above the upper support). Followed by a test of support not returning down to the previous dip. At this point we will move into Phase D last point of support (LPS), the stock pullback to test the support with the volume diminished. This will lead us into The sign of strength (SOS), the stock rallies with high volume and shows the stock is preparing for the next rally. Sometimes it looks like pennant or flag which we lead us to the promise land.....
***note I assume the upper resistance will be around 49k (200EMA) with the about of sells(asks) at this price
"Mannnnnn I hope Richard Wyckoff knew what he was doing"
-KewlKat

Bitcoin (BTC), Ethereum (ETH) - March 3Hello?
Traders, welcome.
If you "follow", you can always get new information quickly.
Please also click "Like".
Have a good day.
-------------------------------------
(XBTUSD 1W Chart) - Mid-Long-Term Perspective
Above the 27650.0-29350.0 section: An uptrend expected to continue.
(27650.0-33101.0 section: strong support section)
The 42084.0-47010.0 section is a support section for creating a new wave.
(XBTUSD 1D Chart)
Resistance section: 46695.0-49518.0
Support section: 26932.0-29755.5
If the price holds above the M-Signal line of the 1W chart, it is expected to turn into an uptrend.
However, since the section 46695.0-49518.0 is the section that determines the trend, it must be supported and rise in this section to continue the upward trend.
Therefore, if it rises to the 46695.0-49518.0 section, it is expected that the trend will continue in the direction deviating from the 45211.0-50876.0 section.
If it falls below the 45211.0 point after rising to the 46695.0-49518.0 section, Stop Loss is required to preserve profit and loss.
If it rises above the 50876.0 point,
1st resistance section: around 55164.5 point
Secondary resistance section: from 60811.0-63634.5
resistance is expected.
It is important to find support near the 42084.0 point (up to the 40163.5 point) as it is important to keep the price above the 60 SMA to sustain the current trend.
In the CCI-RC indicator, it is necessary to check whether the CCI line rises above the zero point around March 7th.
Therefore, careful trading is required as large volatility is expected between March 7-9 (up to March 6-10).
The next volatility period is around April 13th.
-----------------------------------------------------
(ETHUSDT 1W Chart)
Above 1728.74 point: Expected to create a new wave.
In order to turn into an uptrend, it should move upwards near the 3343.06 point.
(1D chart)
(All: )
First resistance section: around 3375.08
Second resistance section: 4191.93-4464.22
Support section: 2285.94-2558.23
You need to make sure you have support above the 2910.0 point.
In particular, we need to see if we can move above the 3151.97 point to break away from the M-Signal line and the downtrend line on the 1W chart.
If support is found above the 3151.97 point, I would expect a reversal to the uptrend.
If they move down from the 2910.0 point, they should check to see if they find support at the 2826.99 point.
If it falls below the 2826.99 point, a short-term Stop Loss is necessary as there is a possibility of re-entry to the bottom section.
Support near the 2910.0 point is important as it is attempting to break through for the first time since falling below the 60 SMA line.
The next biggest volatility period is around April 18th.
------------------------------------------
(XBTUSD 1M Chart) - Big Trend
All patterns and waves can be known when they are completed, so it is best to conduct a trade that matches your average unit price rather than a trade based on prediction.
Looking at the big picture, I think 4-5 waves are going on.
Depending on how you interpret section A, the wave may be different.
Likewise, you need to be more careful in your trading, because the parts that have not yet been created may have the same flow as section A.
The expected ascent section is near the 80574.0-83397.0 section.
This is an expected value considering the fluctuation range that has risen from the 1st section to the 2nd section.
There are two large resistance intervals to move up to the expected level.
The two large resistance sections are sections a and b.
If it fails to break through section a upward, I think it can represent the same flow as section A.
If it rises above the 72104.0 point with this rise, it is expected that it will not fall below the 26K-29K section (maximum 21K section) even if a bear market continues.
If the 38K section is touched, it is expected to lead to a sharp rise.
------------------------------------------
We recommend that you trade with your average unit price.
This is because, if the price is below your average unit price, whether the price trend is in an upward trend or a downward trend, there is a high possibility that you will not be able to get a big profit due to the psychological burden.
The center of all trading starts with the average unit price at which you start trading.
If you ignore this, you may be trading in the wrong direction.
Therefore, it is important to find a way to lower the average unit price and adjust the proportion of the investment, ultimately allowing the funds corresponding to the profits to be able to regenerate themselves.
------------------------------------------------------------ -----------------------------------------------------
** All indicators are lagging indicators.
Therefore, it is important to be aware that the indicator moves accordingly with the movement of price and volume.
However, for convenience, we are talking in reverse for the interpretation of the indicator.
** The MRHAB-O and MRHAB-B indicators used in the chart are indicators of our channel that have not been released yet.
(Since it was not disclosed, you can use this chart without any restrictions by sharing this chart and copying and pasting the indicators.)
** The wRSI_SR indicator is an indicator created by adding settings and options to the existing Stochastic RSI indicator.
Therefore, the interpretation is the same as the traditional Stochastic RSI indicator. (K, D line -> R, S line)
** The OBV indicator was re-created by applying a formula to the DepthHouse Trading indicator, an indicator disclosed by oh92. (Thanks for this.)
** Support or resistance is based on the closing price of the 1D chart.
** All descriptions are for reference only and do not guarantee a profit or loss in investment.
(Short-term Stop Loss can be said to be a point where profit and loss can be preserved or additional entry can be made through split trading. It is a short-term investment perspective.)
---------------------------------

Bitcoin Analyze (Short Term/Timeframe 4H)!!!Russian people pumped Bitcoin , but I don't think Bitcoin can continue this situation.
Bitcoin Analyze ( BTCUSDT ) Timeframe 4h⏰
Bitcoin is in the heavy resistance zone : Cluster of Fibs 44080$ until 43330$ + Downtrend line + Uptrend line + Bitcoin sees SMA100 on top of itself.
In addition, Stochastic RSI is on the Resistance line , and I expect that it goes down around the current situation 👇https://www.tradingview.com/x/hGDZYTp5/
As a result, Bitcoin can go down to 40500$ .
Do not forget to put Stop loss for your positions (For every position you want to open).
Please follow your strategy , this is just my idea, and I will be glad to see your ideas in this post.
Please do not forget the ✅' like '✅ button 🙏😊 & Share it with your friends; thanks, and Trade safe.
