#BTC, Retesting 'range-high' from above after the breakout..#BTC
Retesting 'range-high' from above after the breakout..
Looking for it to show strength & hodl/bounce from this area as continuation toward 45K+
Crossing above Ichi cloud for the 1st time since May (bullish)
~25% up since 1D UCTS Buy signal
Let it run
$BTC
Xbtusdt

algo targets, long\short setups 🔑looks like we've confirmed this impulse quite eloquently, and i think we can all agree on that together.
this is my current projection as of this morning, and the one i am willing to trade with confidence.
sub wave 3 target: 43~45k
sub wave 4 target: 39~37k
sub wave 5 target: 47~50k.
this should put in wave (1) on a higher degree; after which we should in theory see a 0.618% retracement of this entire move into wave (2) on the higher degree.
that wave (2) algo target is beautifully in confluence with a retest of the bigger bull channel which is at play, it's also the strongest area of demand in this current visible range.

it isn't time yet.i took a closer look at this recent rally, and i can't help but feel like something is off about it. my intuition is telling me that this is yet again another phase of distribution before the deeper drop to lower lows.
it would explain the unusual volume spikes in this 34k range.
----
my downside projection sits at 25.5k as of this morning, and until the charts tell me otherwise - this will be my primary count going forward.
i could be wrong, but i have to trust my intuition on this one, as it is what got me here in the first place.
we could make one last push to about 36.2k, but the probability of that is very slim as of this moment.
i started layering in shorts as of this morning, and will continue to do so until i am proven wrong.
💸
ps. i talked about this scenario not too long ago, and this false break out of this wedge is the ultimate trap to anyone who doesn't see it coming. i have seen this scenario play out so many times on the smaller timeframes, so i just felt like sharing my opinion on this with you all.

btc long setup 7\22.Now that we know where we are, we can safely know where we are going.
Wave 4 corrections tend to be very complex, and very complicated to figure out - which is why i have spend so many days and nights working on this picture; unlike simple corrections which are a piece of cake and take me a few minutes to chart. This was one of the hardest charts I've ever had the pleasure of working on, and it was very much worth the experience.
--------
I am safely theorizing that we have begun working on Wave (B) of Wave 4 on the highest degree.
Wave B's move in three waves (a-b-c) or (w-x-y).
We can eliminate the w-x-y, as this is a clear impulse-
Leaving us with just one final scenario.
The structure we have begun working on, on July 20th is wave a of the larger Wave B structure of Wave Y of Wave 4 on a highest degree.
When this wave (a) finishes its five wave impulse and tops out at 33,600, we should in theory see a 0.5 ~ 0.618 pull back for the smaller downward wave b move.
Knowing this, we can position ourselves nicely for that wave C swing in the days ahead.
I am projecting this wave c of Wave Y of Wave B of Wave 4 on the highest degree to move to about 40.5k as of this evening.
That is my safe target, and is as high as I am willing to swing a long.
Taking it any higher is playing with fire in my professional and honest opinion.
Buy zone:
0.5 = 31378
0.618 = 30,875
---
Sell zone = 40k.
see the full idea via:

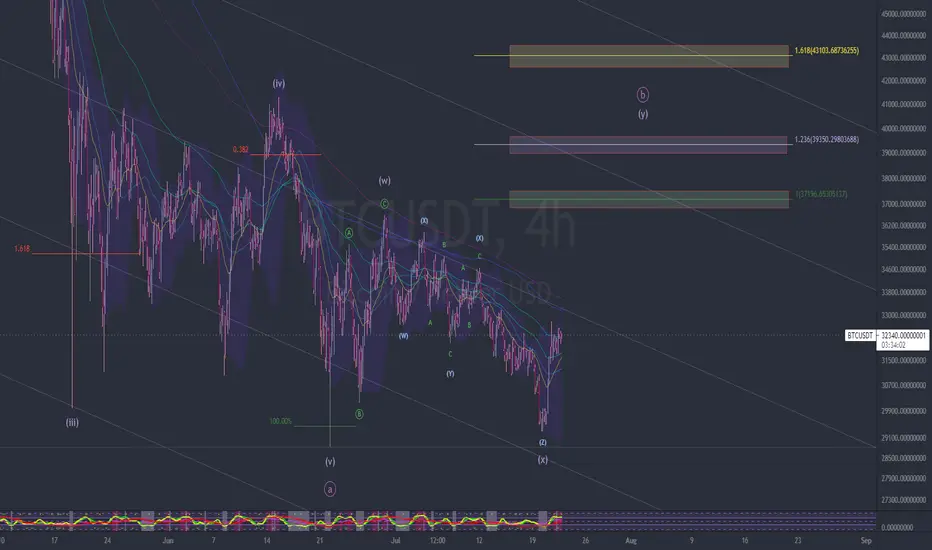
"it's just a double three" 👆Been thinking long and hard about this picture, and i think this is the one.
i've been observing the price action these last two nights on the smaller time frames, and noticed that from our july 20th "bottom", there was a shift in momentum, a break of pattern - and a totally new vibe that's entered into this market space. hard for me to explain what i mean, but i'm sure you could see\feel it too. we haven't seen an impulse this clean in quite a long time, which leads me to believe that we are finally in Wave Y of this Wave B correction.
all of the fib relations check out for this flat idea, and i have a few potential targets for you guys.
• Wave Y = 61.8%, 100%, or 123.6% of wave W
• Wave Y can not pass 161.8% of wave W otherwise it will become considered a Wave 3 impulse.
Therefore,
•100% = 37.1k
•123.60% = 39.3k
•161.80% = 43.1k
If btc breaks above 43.1k on this run, then our Wave 4 correction is behind us, and we can expect to see new highs.
-------------
Ps. I've never traded a flat correction before, in fact this is the first time I am seeing one this large with my own eyes. All of these relations are textbook accurate, so I'm going to simply treat these coming days as a learning experience, so I'll know what to expect if we ever come across this sort of structure again.
I appreciate all of your support, and I hope you guys trade safe in these crazy markets.
\\
i entertained this flat idea the other night, but the liquidity hunt the other day really threw me off.
which would put our wave C target ranging between 14~20k depending on where this wave b move tops out.
a deep dive into the projected downside target.i made a post on february 4th calling the top of btc at 60k - i was off by 5k \\ you can view that post down below.
also made a post back in march, warning everyone about the massive signs of weakness i was seeing.
my projected downside target back then was between 10k~15k, but i've come a long way in this learning journey, so i'm here to say that we will not be seeing 10k.
we could though, get all the way down to 14k as that would be the 123.60% fib extension (aka wave 5 target of wave c) - which would keep our 11 year grand cycle count still in tact.
the bullish invalidation for the 11 year move would be at 13831.41 (via the bitcoin liquid index chart) each exchange varies in price, but i think the blx is the universal chart which matters the most - so let's go with that number.
you don't want to know what would happen to btc if 13831.41 was breached - matter of fact, let's not even talk about it.
-
if you press alt + i on your tv chart, you are able to inverse it. i find it much easier to chart downtrends from this perspective - so that is precisely what i did here.
as you can see: wave 3 of wave (a) hit the 1.618% fib extension, wave 4 hit the 0.386% fib retracement, and wave 5 is projected to hit anywhere between 14~18k via the 100%~123.60% fib extension.
this is probably not something any of you want to hear right now, but it is not like i am making this number up, it is simply what the chart tells me as of this evening.
Wave A target = 25k
Wave B target = 43k
Wave C target = 14k.
-

liquidity hunting.the og whales want their 100x longs filled at the downside w5 algo target.
tonight is the night.
buy the green box
sell the red box.
✌

BTC - FIB play PART IIHello trader,
Nice week and profitable deals 💲
This BTC 1D chart is a combination of:
1. FIBretracement from 3k low to 64k high
2. FIBretracement from Wave 2 to Wave 3
3. FIBretracement from 64k Top to Wave3
4. 2017 Top
5. FIBextencion from Wave 2 to Wave 4
6. FIBextencion from Wave 2 to Wave 3
7. Pitchfork
Detailed BTC
FIB roadmap
Weekly logscale roadmap II and Fractal
Roadmap 3
I would like to mention that all I post are just options and my own opinion !
Always trade with SL, and do not risk more than 1% of your portfolio (max 3%) per trade.
No trading advice !
➡️If you like my posts smash the like👍👍 button, comment or follow me.⬅️
Thanks for reading my ideas,
Trade save!!

btc shorti'm 11x short from 32,900, will add if we make it to the 0.382 (32,233)
sticking to this as my primary.
with markets about to roll over, i will continue to update this as we move along.
stay safe ladies and gents.
outlined this main scenario very articulately in last nights post:

short shorts 🩳17x short at 33,700
target = 32,550
will look to short the bounce from there. taking this one step at a time.
previously:
ps. this sub-division was very complicated for me to figure out, as i am still learning ewt.

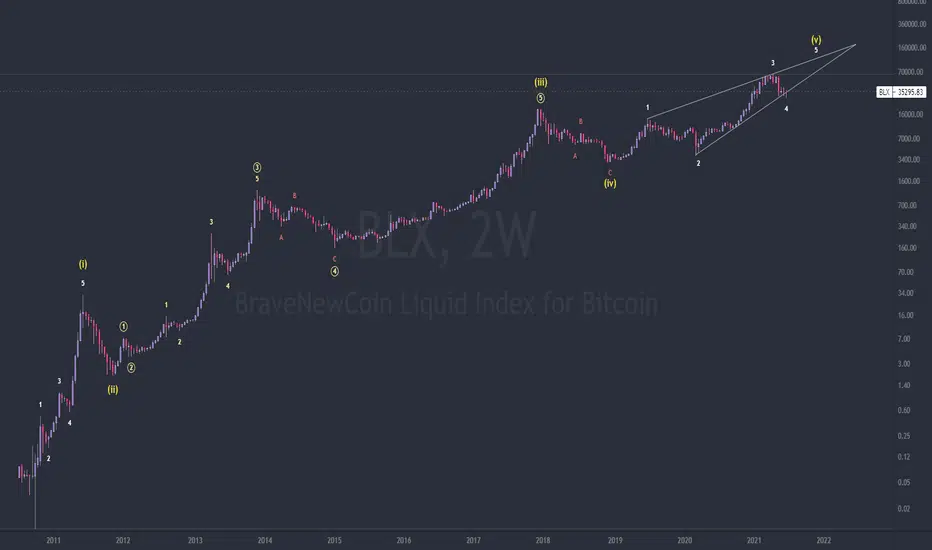
Bitcoin Grand Cycle Ewt Analysisfrom the beginning of time, until today, btc has surprised us all.
that being said, let's talk about what i'm seeing here.
wave 5's tend to end in a nice wedge, or an ending diagonal kinda formation.
the wedge we're currently in is reminiscent of this potential scenario.
we're currently at a critical point in my opinion, and this wedge must hold, otherwise things will get messy very quickly.
this is one of many scenarios that i am seeing, and i am happy to share them all with you guys.
ps. i am not taking anymore crypto trades for awhile, until we get a concrete direction.

BTC GO BACK TO 50K SOON // BITCOIN HODLBITCOIN VERY GOOD ACCUMULATING AT THIS PRICE, NEXT TARGET 50K


BTC | Harmonic Pattern | Cypher PatternBTC | Long Term Chart Analytic | Harmonic Pattern | Cypher Pattern


BTC - How strong are crypto bulls really? Hello trader,
Good mood and profitable deals 💲
If you're new in the game,and you are interested in my plan🗺️, check out my previous analysis ( link below ) :
BTC-Money on the siding!
BTC welcome to a boring,tricky...
BTC Crypto Hype III - The top is set -618 play !!
Education
Elliott Wave Ratios
Trading psycology
After a panic sell-off, in which all investors with weak nerves threw their shares on the market, a small offer is enough to make prices rise.
It is enough if there are virtually no salespeople left.
This is usually followed by a sharp rise in the price with an extremely thin trading volume.
Because there are only a few buyers because all market participants are simply afraid. In this case, the lack of new sales is practically enough for prices to rise again.
At the moment we are at the top of the triangle, where the 1D MA20 is also. Usually the MA20 is a strong resistance after such a strong sell-off.
Although the triangle is a bearish pattern, I think we are ready to break it.
We can also see that most market participants have closed their shorts and switched to long positions.
So the first step for the bulls is to break the 38.8K. 40-42k and 1D MA200 is the next strong resistance.
Bears should take over again at the latest from 45-47k.
30-27K is a good level to look for a LONG entry in my opinion.
Unfortunately, my english is not so good and I work with google translate, but if you have any questions I will be happy to answer them .
My followers have been making a big ride with me since I posted.🤑
If you are interested to learn privately from my trading ideas,conntact me
If you like my posts smash the like👍👍 button, comment or follow me.
➡️Donations via TradingView coins also help me a great deal at posting more free trading content and education, (also on request)⬅️
Thanks for reading my ideas,
Trade save!!


Bitcoin - No Trade ZoneCurrently, Bitcoin is in a No Trade Zone in my opinion. I don't see a great signal in either direction.
I would like to see BTC move up to somewhere between 45-47k next but could definitely see the possibility of it falling to the 18-20k area just as easily.
When trading, I suspect that most people lose money easily in the midranges where the price action is chopping back and forth without any good signal of where it may go next. There could be many fakes in either direction up or down and the next move may just be an initial 'spring' to get traders offsides before it moves in the opposite direction with greater strength.
I think the safest play at the moment is to wait until the price reaches 45-47k Resistance or 18-20k Support. After that, you may be able to make a much safer and more profitable entry in anticipation of the next move from those levels.
Good luck and happy trading!


BTC- Quick on-chain analysis (Wipe your hand dry)
Spot any similarity? Just my two cents. Please do your own due diligence as on-chain analysis is only a part of the BTC price analysis.
