BITCOIN | 5 MILLION DOLLARS LIQUIDATED | BUY THE DIPSWe called the UpTrend here.
Key things to take away from this:
There is a Bullish ABCD pattern to $10,000.
Dips to 23.6% level at $8,900 and 38.2% level at $8,400 will be a buying window.
UpTrend seems to be on.
Halving event is 97 days away.
Take it easy team.
See you on the next one.
~Bo Bugra
Xbtusdt

BTC NEXT MOVE Due to following reasons i think the btc short term move will push us to test the down trend line
1. need of a retrace for previous attack to the new upper trend line that failed and needs a dump to gain more power
2. negative regular divergence in volume and AO indicator in 4h and 1d
3. huge sell walls on 9350-9500 that is a key factor for more pump (closing candle upper the parallel trend)
4. price below MA50
Our strategy
scenario 1 :: due to the period of time btc was in sideways we expect a sharp move toward the first target around 8800-8900 i expect a good push from this support toward 9100 level if it can pass this resistance with good volume it will push the price to 9800 level
scenario 2 :: if we can`t push the price from 8800 upper 9100 the 8300-8500 level activates as a level that btc can gain enough power for the 9800 level
FYI any 4hr candle close above 9500 will terminate this setup and automatic long pump to 9800 and above

BTC possible movementsREAD THIS VERY IMPORTANT
after a good bullrun all eyes are on this parallel channel on the chart for btc next move
break of price in either side and sustaining with a good 4h candle above 9500 or below 9200 confirms the next movement
i personally think because of the regular divergence in volume and AO indicator a good short entry is more likely giving the fact that we have 2 CME gaps around 9100 and 8500
and in my opinion this trendline in the top is more likely to break above.
happy trades.

BITCOIN: Detailed coin overview by TF: 4h, 1d, 1M (BUY and BUY!)Dear friends, I am glad to welcome everyone again!
To begin with, I would like to thank all of you for your support! I am extremely pleased to read your comments, I try to answer everyone!
As expected, I begin my review with a short-term picture. Time frame: 4 hours
So, bitcoin is still trading in an upward imbalance, and, currently, locally, the price is in the active stage of accumulation of $ 9470-9220. Today, the coin once again successfully tested the zone of liquidity accumulation (the main zone of control of buyers), as a result of which, we again saw an instant price buyback. This indicates the interest of the market and its growth as a whole. Also, it is worth paying attention to altcoins, the growth of which I regularly spoke in my posts, both on tradingview and in telegrams. This is a good signal for the market.
For further growth, the price needs to break through and gain a foothold above local resistance, where a huge accumulation of limit sell orders is concentrated. Given the globally bullish picture, and the aggressive demand of buyers, I expect the resumption of an upward trend in the region of $ 9,800-10,300.
Let's switch to the time frame 1 day:
Pronounced signals for buyers are:
1) Successful consolidation above ma200;
2) Consolidation and aggressive purchase of prices from psychological $ 9,000;
3) Successful consolidation above the main line of a downtrend;
4) Fixing for 382 Fibonacci levels ($ 9270);
5) A new influx of volumes;
6) Wave structure;
7) 3-month consolidation and a set of positions by major players;
Now the bulk plans to buy bitcoin from $ 8800-9000, and, in principle, it is quite possible. This is the strongest support area, but everyone remembers how the crowd wanted to enter the market for $ 8,000? Realizing that the train leaves without them, they had to enter a market position, pushing the price higher and higher.
Let's take a look at the 1 month time frame:
This time frame most deeply shows the current mood of the market, and gives us another extremely strong signal to continue the upward trend, namely the candlestick model: “Morning Star”. This is one of the most powerful trend reversal patterns.
It consists of 3 consecutive Japanese candles:
The first is a bearish candle with a long red body;
The second - with a short body with a gap down and a long lower shadow;
The third is a bullish candle, with a long green body, which should cover most of the red body of the first candle. It is the last candle that finally confirms the prevailing morning star reversal pattern.
I have repeatedly said in my posts that the "Bottom" ($ 6,400) has passed, and you and I are witnessing a new wave of growth. How it drags on and in what form it is transformed, only ... nobody knows.
Based on the foregoing, globally I expect a continuation of the upward trend to the prices indicated above.
P.S. As I said earlier, my limit orders from 8800 to 9100 are also waiting in the wings. If the price is fixed for $ 8300, the analysis will lose its relevance.
If you wish, share your ideas in the comments and like them! ❤️
And also subscribe to my telegram channel!
All successful bidding!

Bitcoin | Can we go 10k this weekend?In this video, we talked about a shorter term swing trading opportunity.
Take it easy team.
See you on the next one.
~Bo Bugra

BTC is bullish on 15m, scalp long nowWe are on the bottom of the current range and i think its good opportunity to go scalp long now, stop under the pinbar on the 15m.

Bitcoin | Once in a lifetime opportunity.The more we consolidate, the more likely we will break for the upside.
Key things to take away from this:
10k target is still on the table.
9.2k is the 38.2% retracement level.
Halving event is 103 days away.
Take it easy team.
See you on the next one.
~Bo Bugra

Bitcoin | Did you miss the Bottom? | Wait for this levelIt will be important to see if we can break above 9.2k. Bullish ABCD pattern setup is still taking us to $10,000.
Key things to take away from this:
The next area of support is around $8,900 and $8,800!
38.2% retracement level at 8.8k will most likely bring the buyers back if the up trend is on.
UpTrend seems to be still on. If we can close above 9.2k for this month, it will be the beginning of a Bullish Market.
Halving event is 104 days away.
Take it easy team.
See you on the next one.
~Bo Bugra

Bitcoin | Are we going to 10,000?Weekend is here. If the bull is on, we really need to break 8.5k level.
Key things to take away from this:
If we break above $8,500, there is a Bullish ABCD pattern to $10,000.
$6,400 level is a big support on the Daily Time Frame, if broken, down trend is on.
Accumulation Zone is between $8,300 - $8,000.
Halving event is 108 days away.
Take it easy team.
See you on the next one.
~Bo Bugra

Bitcoin | Time to Bet the Farm?8.5k level has been broken this weekend. New weekly candle is open.
Key things to take away from this:
Bullish ABCD pattern setup is taking us to $10,000.
Up trend seems to be as long as $9,000 is broken.
Pull downs are buying opportunities if they ever happen.
Halving event is 105 days away.
Take it easy team.
See you on the next one.
~Bo Bugra

BITCOIN | Uptrend Seems to Be OnUp Trend seems to be on as we have broken out of the trend line in both logarithmic and non-logarithmic scaled charts.
Key things to take away from this:
$6,400 level is a big support on the Daily Time Frame, if broken, down trend is on.
Accumulation Zone is between $8,500 - $8,000.
Halving event is 110 days away.
If we break above $9,100 - $10,000 and $11,000 are the targets.
Take it easy team.
See you on the next one.
~Bo Bugra

#BTC Resumption of the BULL trend after local correction!Colleagues, I am glad to welcome everyone!
Yesterday, it was seen how buyers showed their weakness, therefore, decided to place limit orders for selling long positions at $ 9050 (Btc) and $ 176 (Eth), respectively. Congratulations to everyone who heeded my advice, they kept longs with $ 7900 and $ 136, and closed yesterday in, I think, an excellent profit. My decision was also influenced by factors such as:
1) The psychological level of $ 9,000;
2) KDT (rising wedge);
3) ma200 (on TF 1D);
4) Extremely strong zone of increased liquidity;
5) Testing the rH&S pattern
6) Fibonacci level 618
7) Bearish divergence (weakness of the buyer)
(I wrote about this to everyone in my post on January 15)
What we have now: as part of the correction, we tested the first locally significant support zone, which coincides with the median of the rising channel. Earlier, I wrote that $ 8460-8520 is an extremely liquid zone, from where you can try to get long. I expect the end of the correction and the continuation of the upward movement at the levels of $ 8100-8200 (2nd zone ma100). It is pointless and extremely stupid to open short deals, so I do not advise you to do this in any case. In any case, this action is the opportunity to buy a coin at a better price, so in no case should you be upset. The script will lose its relevance when consolidated below $ 7,700.
Like, if you want, I won’t lie, if I say that I will be pleased: *
Good luck to everyone!
P.S. Subscribe to my telegram channel, link in status, or contact personal messages!

Bitcoin Update (Jan 12)BTC is gaining momentum very well, we can totally believe that BTC price will increase to 8600$ or even above 9500$ within the next few days!
Try to buy BTC close to 7900-8000$ as possible
We will consider getting out if BTC hits 7800$ zone

Bitcoin Bullish Scenario $9500 & 12500$ Target WorkingBitcoin Now Struggle at Resistance Level at $7700-$7800.
If We hold This Price then We can see next Spike very Soon.
and this Spike will be big.
According my my Chart and DATA Next Spike would be 1000$-1200$ possible .
Because Bitcoin Chart now Very Bullish and also 3 Day chart MACD also looking Very Bullish crossover.
Guys We need to hold Above $7700-$7800.
We can see one drop $100-$200 but this only for Liquidate fund for high Leverage .
And this will again buy opportunities .
Next key level Resistance is $8703 and $9300.
And support: $7550 and $7150.


Precision macd divergence - Bitcoin's time-sharing top and bott
I've been writing analysis articles on cryptocurrencies for the golden disk since 2018.
There was not much experience at that time, i used the technical indicators I used in the stock market to analyze.
After studying the trend, I found that the deviation accuacy of macd is very useful.
At that time, several important stage head and bottom, are the appearance of macd divergence, the accuracy is very high, but also let many people have a understanding of macd divergence.
So much so that a lot of people started imitating it, but I found that a lot of interpretation was not true.
Divergence technology also has its drawbacks, in the case of a unilateral market, divergence will recur and disappear.
So in the bull market in the first half of 2019, divergence softened many times, but the final formation of a definite signal was not very frequent.
This is not a departure from technology is not good to use, the key question is, different trends, how to interpret the deviation reasonably.
And, crucially, for the confirmation of divergence, many people make buying and selling decisions without signaling them, to the extent that mistakes occur.
In recent times, the divergence technology has begun to charm again, from 5 minute charts to 2-hour charts, several top and bottom formations, all due to divergence.


Bitcoin [BTC] Bears in Control: Oscillators + TriangleAll Oscillators are pointed south:
The CMF on the daily flipped negative on the drop yesterday. The MACD is at a cross-section of a bearish shift.
Moreover, the RSI is also showing room for further drop on the daily scale.
The descending triangle with the Wick from the Xi pump could drive the price below $3000. While it seems far less probable, the descending trend signal a sell-off no doubt.
The weekly oscillators have been pointing towards a sell-off as well!


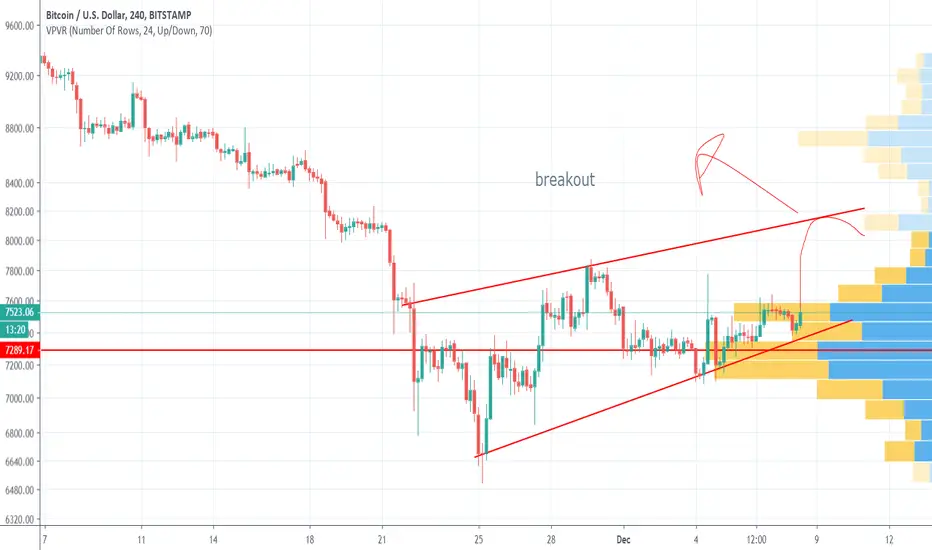
High volume, is there a breakout coming to 8k?!!as it looks on the chart, they are strong up volume, maybe will break this volume 8K before down trend.
Be ready for the next hour in bitcoin, good news from china!Next hour seems very important for btc. follow it, i expect a breakout. but this can also happen later.
the next hours are high volume.

Bitcoin become strong since more exchange interst in lightningI expect a breakout to above 8K next time.
Bitcoin become strong since more exchange interst in lightning network, and this will make the new level for btc.
Whales effect are active, they can do bulk orders any time, beacase they see btc changing in rate.

lightning network news will explode btc, whales more interst i think from this days, we will see a up trend.
I am personaly all in BTC!
