Bitcoin time analysis cycle based on machine learningcycle Analysis this Should Happen in the Coming Years i will update it every week until the cycle in black color end good luck .
Xbtusdt

60 thousand dollars.Good evening!
Our group reached a milestone of 70 members last night, and I'm excited to share a bullish idea with the world.
Bullish momentum continues to build as increasing pressure mounts on the financial world.
For many, Bitcoin appears to be "the way out," or so the simple narrative goes.
However, I'm not here to discuss narratives; I'm here to analyze market structure.
The market seems poised for a breakout, and I believe it could be massive.
While most people expect a 32k 🎯,
my target was 39k since last august.
I've raised my target to 60k as of this evening for this particular bull case.
It is only after reaching 60k that I predict Bitcoin will fall to revisit the November 2023 lows.
---
Key levels:
🔨 60k (Target)
🔺 10k (Support)
---
Stay vigilant and trade wisely!

Bitcoin Analyze (Short Term, 1-hour Time Frame,04/08/2023)!!!While Bitcoin seems to be completing Wave B, or even past it, there is a possibility that wave B may follow higher Fibonacci levels or even form a contracting triangle pattern.
At the same time, Bitcoin managed to form a symmetrical triangle pattern in the RSI indicator in the 4-hour time frame, which can be considered as a key for the next big move.👇
I expect Bitcoin to decline toward the 🟢support zone (26,980-26,580)🟢 after breaking the support line.
❗️ Note ❗️: If BTC goes over HKEX:29230 Scenario will change.
Bitcoin Analyze ( BTCUSDT ), 1-hour time frame ⏰.
Do not forget to put Stop loss for your positions (For every position you want to open).
Please follow your strategy, this is just my Idea, and I will be glad to see your ideas in this post.
Please do not forget the ✅' like'✅ button 🙏😊 & Share it with your friends; thanks, and Trade safe.

Bitcoin will fall by Contracting Triangle❗️❗️❗️As I said in the previous post, it seems that the corrective structure of wave B can be in the form of a contracting triangle.
Bitcoin managed to break the lower line of the contracting triangle, and it also seems to be the sign of the end of Bitcoin's pullback to the broken triangle of the evening star candlestick pattern.
After breaking the support line, I expect Bitcoin to go down toward the 🎯targets🎯 I have specified on the chart.
Bitcoin Analyze ( BTCUSDT ), 1-hour time frame ⏰.
Do not forget to put Stop loss for your positions (For every position you want to open).
Please follow your strategy, this is just my Idea, and I will be glad to see your ideas in this post.
Please do not forget the ✅' like'✅ button 🙏😊 & Share it with your friends; thanks, and Trade safe.

Bitcoin Analyze (Short Term, 30-minute Time Frame,04/05/2023)!!!Bitcoin seems to be forming a complex corrective structure, and a bearish scenario from the 🔴resistance zone($28,900-$28,480)🔴 is still possible.
Also, it seems that the new corrective structure that Bitcoin started yesterday will be the expanding flat(most common/3-3-5)corrective structure. So I expect Bitcoin to drop at least to the support line.
❗️ I shared the position ➡️ RR=7 with you, but please open a position according to your strategy and don't forget capital management.❗️
❗️ Note ❗️: If BTC goes over $29230 Scenario will change.
Bitcoin Analyze ( BTCUSDT ), 30-minute time frame ⏰.
Do not forget to put Stop loss for your positions (For every position you want to open).
Please follow your strategy, this is just my Idea, and I will be glad to see your ideas in this post.
Please do not forget the ✅' like'✅ button 🙏😊 & Share it with your friends; thanks, and Trade safe.

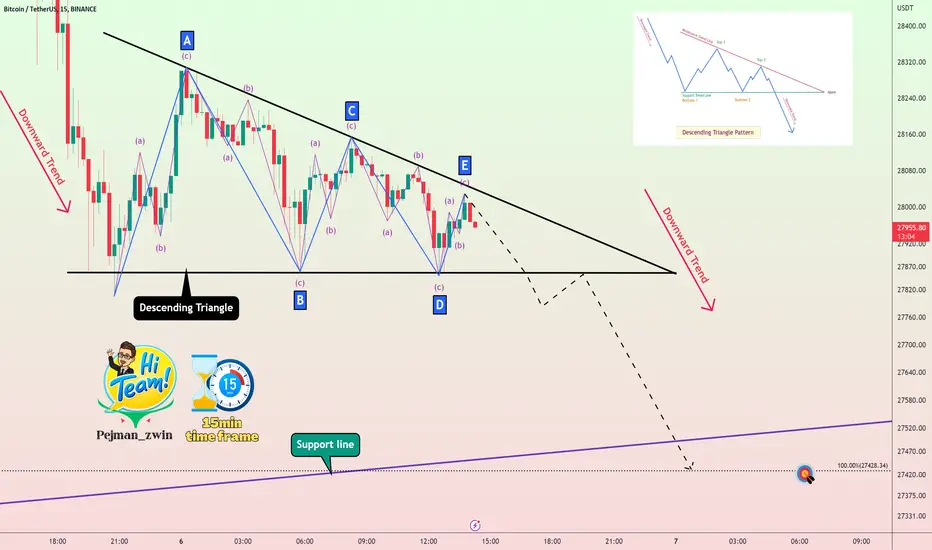
Bitcoin Analyze (Short Term, 15-minute Time Frame,04/06/2023)!!!It seems that Bitcoin has managed to create a descending triangle.
I expect Bitcoin to fall at least to the support line after breaking the lower line of this triangle.
Bitcoin Analyze ( BTCUSDT ), 15-minute time frame ⏰.
Do not forget to put Stop loss for your positions (For every position you want to open).
Please follow your strategy, this is just my Idea, and I will be glad to see your ideas in this post.
Please do not forget the ✅' like '✅ button 🙏😊 & Share it with your friends; thanks, and Trade safe.
[Bitcoin] ready to rise againDespite the FTX affair wich caused a new low, I believe BTC is ready to rise again due to bullish technical factors:
- many bullish divergences in W, 3D, D, 4h
- end of the big falling wedge (throwback completed)
- new small falling wedge (dashed lines)
- historical technical supports (Price, MACD, Disparity index)
- blue pill (Hash Ribbons indicator)
- bottom found (Puell Multiple indicator)
- reversal signal (Network Value to Transactions ratio)
Of course, in the event of another major crisis, BTC will fall sharply again.

Bitcoin Analyze (Short Term, 15-minute Time Frame,04/03/2023)!!!Bitcoin is on its way to completing wave C of the zigzag corrective structure.
The end of wave C is most likely in the 🔴resistance zone($28,900-$28,480)🔴 and most likely in the $28,720-$28,890 range.
After confirming the end of wave C, Bitcoin is expected to finally fill the 🔵CME GAP($27,505-$27,465)🔵 and reach the 🟢support zone ($26,980-$26,580)🟢.
❗️ Note ❗️: If BTC goes over $29230 Scenario will change.
Bitcoin Analyze ( BTCUSDT ), 15-minute time frame ⏰.
Do not forget to put Stop loss for your positions (For every position you want to open).
Please follow your strategy, this is just my Idea, and I will be glad to see your ideas in this post.
Please do not forget the ✅' like '✅ button 🙏😊 & Share it with your friends; thanks, and Trade safe.

Bitcoin Analyze (Short Term, 15-minute Time Frame,04/02/2023)!!!Bitcoin was able to make a head and shoulders pattern on the 🔴resistance zone($28,900-$28,480)🔴.
I expect Bitcoin will fall to fill the CME GAP($27,505-$27,465)🔵(at least).
Bitcoin Analyze ( BTCUSDT ), 15-minute time frame ⏰.
Do not forget to put Stop loss for your positions (For every position you want to open).
Please follow your strategy, this is just my Idea, and I will be glad to see your ideas in this post.
Please do not forget the ✅' like'✅ button 🙏😊 & Share it with your friends; thanks, and Trade safe.

Bitcoin 500-Day journeys before each Halving🚌🚌🚌!!!🔹Bitcoin's number of 500-day journeys has been four since the data was posted on the chart. Although the information about the first journey is incomplete, I tried to complete the candles of the first journey by using valid charts.
🔸In general, Bitcoin's 500-day journeys start when Bitcoin has experienced a new All Time High(ATH) before Halving and then started to fall (around -80%) and has formed a price floor. The price floor can follow Fibonacci levels.
🔹Another sign for the start of the 500-day Bitcoin journey is the crossing of the 6-Simple Moving Average (6-SMA) above the 12-Simple Moving Average (12-SMA) (Buy signal).
🔸In general, this signal is seen 274 days before each Halving, so if we want to confirm✅ the start of the fourth journey of Bitcoin, we must wait for the see of the Buy signal by these two simple moving averages. Currently, these two moving averages are very close to each other, and the candle of April can be of great importance. But there is still time to reach 274 days before the 2024 Halving, so if history is to repeat itself again, we will have to wait until June to see this signal.
❗️ Note ❗️: Another point is that at no time in the history of Bitcoin the price of Bitcoin before the Halving has reached its previous ATH price, so we should NOT expect strange prices for Bitcoin at least until the 2024 Halving.
Bitcoin Analyze ( BTCUSD ), Monthly time frame ⏰.
Do not forget to put Stop loss for your positions (For every position you want to open).
Please follow your strategy, this is just my Idea, and I will be glad to see your ideas in this post.
Please do not forget the ✅' like'✅ button 🙏😊 & Share it with your friends; thanks, and Trade safe.

[Bitcoin] Christmas gift 🎁Despite the FTX affair which caused a new bottom, I believe BTC is ready to rise again due to bullish technical factors:
- many bullish divergences in W, 3D, D, 4h
- end of the big falling wedge (throwback completed)
- historical technical supports (Price, MACD , Disparity Index, RSI)
- blue pill (Hash Ribbons indicator)
- bottom found (Puell Multiple indicator)
- reversal signal (Network Value to Transactions ratio)
Of course, in the event of another major crisis, BTC will fall sharply again.

Bitcoin Analyze (Short Term, 15-minute Time Frame,03/30/2023)!!!It seems that this growth over the last two days was in the form of the wave 5 impulse of Bitcoin (see the post below for more information.)👇
The end of wave 5 on the Important Resistance line (Weekly TF) was placed and was accompanied by a bull trap; Bitcoin's strong reaction to this resistance line shows us the importance of this line.
🔔To confirm the wave counter, Bitcoin needs to break down support line 1.🔔
Probably, wave 3 will fill the 🔵CME GAP($27,505-$27,465)🔵 drop, and end on support line 2.
I expect Bitcoin to reach at least the 🟢support zone ($26,980-$26,580)🟢 again finally.
Bitcoin Analyze ( BTCUSDT ), 15-minute time frame ⏰.
Do not forget to put Stop loss for your positions (For every position you want to open).
Please follow your strategy, this is just my Idea, and I will be glad to see your ideas in this post.
Please do not forget the ✅' like '✅ button 🙏😊 & Share it with your friends; thanks, and Trade safe.

Bitcoin Analyze (Growth without Volume(RD-))!!!🤔In the last 24 hours, Bitcoin grew by about ➕7%, but this growth was accompanied by a small volume, and the regular divergence(rd-) between price and volume can be seen well in the volume indicator.
Also, the current 4-hour candle is in Price Reversal Zone(PRZ), Time Reversal Zone (TRZ), and 🔴heavy resistance zone ($32,400-$28,120)🔴; I expect this candle to become a ⭐️shooting star⭐️ candlestick pattern.
I shared with you the position with RR=5, but you must jump to the positions with your own strategy.
Bitcoin Analyze ( BTCUSDT ), 4-hour time frame ⏰.
Do not forget to put Stop loss for your positions (For every position you want to open).
Please follow your strategy, this is just my Idea, and I will be glad to see your ideas in this post.
Please do not forget the ✅' like '✅ button 🙏😊 & Share it with your friends; thanks, and Trade safe.

Bitcoin Analyze (Double Top ⚔️VS⚔️ Inverted Head and Shoulders)As you know, Technical analysis has many complex tools; today, I want to analyze Bitcoin using the simplest ones, such as trendlines and classic patterns in the weekly time frame.
If you take a look at the chart closely, you see two patterns in the Bitcoin chart:
Double Top Pattern
Inverted Head and Shoulders Pattern
Now let's see which of these patterns will succeed in the battle and reach the target without fail. Which one do you think will raise its 🏳️white flag🏳️ and surrender in battle?
I’m now diving into the chart ⚔️battle square⚔️:
The Double Top pattern has 4 types, which can be seen in this chart, Eve and Adam, which is the weakest state of this pattern.
Another pattern I see is the Inverted Head and Shoulders pattern, which has broken the neckline here and reached the 🔴resistance zone ($32,400-$28,120)🔴 & resistance line.
The resistance and support lines have also worked well and reacted every time the price hits them. It’s a good sign for these shields to be strong enough.
The point is that in the weekly time frame, after the neckline of the inverted head and shoulders pattern, Bitcoin has reached the resistance zone for the first time and is not expected to break this zone within its first encounter.
🔔There are scenarios , as always which I’ll point out:
⬇️This whole movement so far can be a pullback to the double top pattern neckline. Therefore, it is expected that Bitcoin will have a fall to the neckline of the inverted head and shoulders pattern. If this drop happens sharply and is accompanied by high volume, the inverted head and shoulders pattern will likely fail, the winner will be the double-top pattern, and Bitcoin will fall to the🟢support zone ($19,950-$17,530)🟢 & support line.
⬆️Suppose this movement is with a gentle slope and low volume. In that case, it will be confirmed as a neckline pullback of the inverted head and shoulders pattern, and my expectation is that Bitcoin will grow after the pullback and attack the resistance zone & resistance line ahead. If this happens, there is a possibility of breaking the resistance zone & resistance line, and the price of Bitcoin can reach 🟣the inverted head and shoulders pattern's target($40,780)🟣.
Which of the patterns do you think will win the battle❗️❓
------------------------------------------------------------------------------------------------------------------------------------------------------------------------------------------------
Bitcoin Analyze ( BTCUSDT ), Weekly Time frame⏰.
Do not forget to put Stop loss for your positions (For every position that you want to open).
Please follow your strategy, this is just my Idea, and I will be glad to see your ideas in this post.
Please do not forget the ✅' like '✅ button 🙏😊 & Share it with your friends; thanks, and Trade safe.

Bitcoin Analyze (Short Term, Double Zigzag Correction)!!!To complete wave 4, Bitcoin has created a Double Zigzag Correction structure inside the ascending channel and support zone ($26,980-$26,580)🟢.
The end of wave Y can be above the upper line of the ascending channel and 🟡Price Reversal Zone (PRZ)🟡.
I expect Bitcoin to reach the lower line of the ascending channel and most likely break the channel down.
If you would like to have a better view of the wave count in the 15-minute time frame, I suggest you look at the below post for a few seconds.👇
Bitcoin Analyze ( BTCUSDT ), 15-minute time frame ⏰.
Do not forget to put Stop loss for your positions (For every position you want to open).
Please follow your strategy, this is just my Idea, and I will be glad to see your ideas in this post.
Please do not forget the ✅' like '✅ button 🙏😊 & Share it with your friends; thanks, and Trade safe.

🔎3 Classic Reversal Patterns for Bitcoin at the same time🔍If you look carefully at the Bitcoin chart in the 4-hour time frame⏰, we can see three classic reversal patterns(at the same time).
The first pattern is Symmetrical Triangle pattern 🚩, which in general, the continuation pattern can be used as a reversal pattern in some cases (for example, right now 😉)
The second pattern is the Diamond Top pattern 💎.
The third pattern is the Rounding Top pattern 🍙.
Each pattern seems to complement the other pattern, and the last pattern we have to wait for is the Rounding Top pattern. With the Rounding Top pattern neckline breaking, the three patterns worked correctly, and Bitcoin is expected to decline at least to the 🟢support zone($25,250-$24,830)🟢 (even more).
Bitcoin Analyze ( BTCUSDT ), 4-hour time frame ⏰.
Do not forget to put Stop loss for your positions (For every position you want to open).
Please follow your strategy, this is just my Idea, and I will be glad to see your ideas in this post.
Please do not forget the ✅' like '✅ button 🙏😊 & Share it with your friends; thanks, and Trade safe.

Bitcoin Analyze (Short Term, 15-minute Time Frame,03/28/2023)!!!Today I want to show you how to get Bitcoin to the support zone using 🌊Elliott's Theory🌊.
Yesterday I showed you the way to the support zone using classic patterns.👇
It seems that Bitcoin is completing the 3rd wave, which is extended.
The end of wave 3 will be below the 🟢support zone ($26,980-$26,580)🟢, and since wave 2 had a price correction, we can expect wave 4 to be a time correction and play the role of pullback to the broken 🟢support zone ($26,980-$26,580)🟢.
I expect Bitcoin to break down to at least the 🟢support zone($25,250-$24,830)🟢.
Bitcoin Analyze ( BTCUSDT ), 15-minute time frame ⏰.
Do not forget to put Stop loss for your positions (For every position you want to open).
Please follow your strategy, this is just my Idea, and I will be glad to see your ideas in this post.
Please do not forget the ✅' like '✅ button 🙏😊 & Share it with your friends; thanks, and Trade safe.

Bitcoin will fall by Symmetrical Triangle & Candlestick patternBitcoin seems to have managed to form a symmetrical triangle near the🔴heavy resistance zone ($32,400-$28,120)🔴 and resistance line.
Also, candlestick reversal patterns on the upper line of the triangle can be a sign to break the lower line of the triangle.
I expect the lower line of the symmetrical triangle will eventually break and take Bitcoin to the 🟢support zone($25,250-$24,830)🟢.
Bitcoin Analyze ( BTCUSDT ), 4-hour time frame ⏰.
Do not forget to put Stop loss for your positions (For every position you want to open).
Please follow your strategy, this is just my Idea, and I will be glad to see your ideas in this post.
Please do not forget the ✅' like '✅ button 🙏😊 & Share it with your friends; thanks, and Trade safe.

Bitcoin Analyze (Short Term, 15-minute Time Frame,03/25/2023)!!!Bitcoin seems to have completed wave 4 with a double three correction structure(WXY) on the downtrend line.
Wave 5 is expected to continue until the 🟢support zone ($26,980-$26,780)🟢(Wave 3 is extended).
But since the volume of trading is not high on Saturday and Sunday, as a result of breaking the support zone, it is a bit far from expected, although 5 downward impulse waves are approaching this zone with a slight slope, which confirms this issue.
Bitcoin Analyze ( BTCUSDT ), 15-minute time frame ⏰.
Do not forget to put Stop loss for your positions (For every position you want to open).
Please follow your strategy, this is just my Idea, and I will be glad to see your ideas in this post.
Please do not forget the ✅' like '✅ button 🙏😊 & Share it with your friends; thanks, and Trade safe.

Bitcoin Analyze (Short Term, 15-minute Time Frame,03/23/2023)!!!It seems that we are seeing the second 🐮Bull Trap🐮 in 24 hours for Bitcoin, with the difference that the regular divergence(rd-) between these two peaks is clearly visible in terms of volume.
Also, when Bitcoin has supported the resistance zone towards the zone, it is less than today's upward movement, and we conclude that there is still a high probability of a decline after the bull trap of the previous hours.
Bitcoin Analyze ( BTCUSDT ), 15-minute time frame ⏰.
Do not forget to put Stop loss for your positions (For every position you want to open).
Please follow your strategy, this is just my Idea, and I will be glad to see your ideas in this post.
Please do not forget the ✅' like '✅ button 🙏😊 & Share it with your friends; thanks, and Trade safe.

Bitcoin Analyze (Short Term, 1-hour Time Frame,03/22/2023)!!!Bitcoin formed an ascending triangle but failed to break the upper line of this triangle and created a 🐮bull trap🐮.
I expect Bitcoin to go down to the 🟢support zone ($26,980-$26,780)🟢 and most likely break this zone.
Bitcoin Analyze ( BTCUSDT ), 1-hour time frame ⏰.
Do not forget to put Stop loss for your positions (For every position you want to open).
Please follow your strategy, this is just my Idea, and I will be glad to see your ideas in this post.
Please do not forget the ✅' like '✅ button 🙏😊 & Share it with your friends; thanks, and Trade safe.

Bitcoin Analyze (Short Term, 15-minute Time Frame,03/19/2023)!!!It seems that Bitcoin has used two classic patterns of Double Top and Fan Principle at the Bottom patterns to fill the first upper CME Gap.
I expect Bitcoin to completely fill the upper CME gap after breaking the third line of the Fan Principle at the Bottom pattern and most likely fall again.
Bitcoin Analyze ( BTCUSDT ), 15-minute time frame ⏰.
Do not forget to put Stop loss for your positions (For every position you want to open).
Please follow your strategy, this is just my Idea, and I will be glad to see your ideas in this post.
Please do not forget the ✅' like '✅ button 🙏😊 & Share it with your friends; thanks, and Trade safe.

Bitcoin Analyze (Short Term, 15-minute Time Frame,03/20/2023)!!!It seems that the story of filling the 🔵CME Gap🔵, which Bitcoin tried to fill for several days, is coming to an end.
It seems that gap filling is happening by 🟣bearish AB=CD harmonic pattern🟣.
Point D of the bearish AB=CD harmonic pattern will most likely end at the end of the gap and on the 🔴resistance line🔴.
I expect Bitcoin to decline to the 🟢support line🟢 and then the 🟢support zone ($26,980-$26,780)🟢.
🔔In general, because Bitcoin reaches the 🔴heavy resistance zone ($32,400-28,120)🔴 for the first time, it is very unlikely that it will break this zone so easily, so don't take FOMO.
Bitcoin Analyze ( BTCUSDT ), 15-minute time frame ⏰.
Do not forget to put Stop loss for your positions (For every position you want to open).
Please follow your strategy, this is just my Idea, and I will be glad to see your ideas in this post.
Please do not forget the ✅' like '✅ button 🙏😊 & Share it with your friends; thanks, and Trade safe.
