Bitcoin Analyze (Short Term, 15-minute Time Frame,03/21/2023)!!!Bitcoin was able to break the lower line of a 🔵symmetrical triangle 🔵and 🟢support line🟢 by a breakout candle.
I expect Bitcoin will go down to the 🟢support zone ($26,980-$26,780)🟢, and It will most likely break this zone.
Bitcoin Analyze ( BTCUSDT ), 15-minute time frame ⏰.
Do not forget to put Stop loss for your positions (For every position you want to open).
Please follow your strategy, this is just my Idea, and I will be glad to see your ideas in this post.
Please do not forget the ✅' like '✅ button 🙏😊 & Share it with your friends; thanks, and Trade safe.
Xbtusdt

Bitcoin Analyze (Road Map, 03/18/2023)!!!🗺️After breaking the important downward trend line, Bitcoin seems to have passed the main corrective wave A and is on the way to completing the main corrective wave B.
If you are curious about the structure of the main wave A, I suggest you take a look at the following post.👇
After breaking the resistance zone, which has now become a 🟢support zone($25,260-$24,440)🟢 for Bitcoin, the Elliott wave counting scenario for Bitcoin has changed.
In fact, Bitcoin is about to finish its main wave 5. Because Bitcoin has filled every CME Gap throughout its history and because it has already filled a part of this gap, it is expected to fill this gap at least completely filled and; also I used Fibonacci levels to define a zone 🔵(28,740$-$27,365 == CME Gap)🔵 for the end of wave 5 on the chart.
Another reason we can confirm the new count is that we see a regular divergence(rd-)between the main wave 3 and the main wave 5.
🔔I expect Bitcoin to drop back to the 🟢support zone($25,260-$24,440)🟢after confirming the end of wave 5.
🔔In general, because Bitcoin reaches the 🔴heavy resistance zone($32,400-28,120)🔴 for the first time, it is very unlikely that it will break this zone so easily, so don't take FOMO.
🔔I drew the possible 🗺️road map of Bitcoin🗺️ in my chart.
Bitcoin Analyze ( BTCUSDT ), Daily time frame ⏰.
Do not forget to put Stop loss for your positions (For every position you want to open).
Please follow your strategy, this is just my Idea, and I will be glad to see your ideas in this post.
Please do not forget the ✅' like '✅ button 🙏😊 & Share it with your friends; thanks, and Trade safe.

🔄Bitcoin wants to follow CME Gaps❗️❓🔄Hello dear traders.
As you know, there is a sign💡 for everything in this world.
For example, before the arrival of spring, the snow will melt, the trees will bloom, and the cold weather will gradually disappear.
In the world of cryptocurrencies, there is a sign for everything, too👌🏻. There are many ways and signs for upward and downward movements or distinguishing scam crypto projects from good ones.
As you can see in this chart, Bitcoin was stuck in a downward trend for about 60 weeks, but in this post, I will examine the positive and negative signs for Bitcoin in the weekly time frame.
First, let's follow the ➕ Positive ➕ signs together.
➕In the chart, it is clear that the downward trend line has been broken.
➕As mentioned in the previous posts, the Golden Cross signal has been seen in the daily time frame.
➕If the current candle closes above the resistance zone and the price of $25,214, Bitcoin has risen above its previous Lower High(LH), which will be another positive sign for Bitcoin.
Now it's time to check the dramatic and ➖ Negative ➖ scenarios:
➖Losing the ⚫️Uptrend line(Monthly Time Frame)⚫️ is one of the negative signs for young Bitcoin.
➖Bitcoin is approaching its 🔴heavy resistance zone($)🔴, which can be a bad sign.
➖Bitcoin is also moving near the 🟣yearly pivot point($26,743.45)🟣.
➖And the last sign is that, as you can see in the chart, there is a 🔵divergence between price and volume🔵.
Another point that Bitcoin can grow up or return to the 🟢heavy support zone($19,950-$17,530)🟢 is the presence of the CME gaps on the chart.
If the weekly candle closes above the 🔴resistance zone($25,290-$24,370)🔴 (closes in about two days). Bitcoin can be expected to grow until the first gap($28,740-$27,365).
If the weekly candle closes below the 🔴resistance zone($25,290-$24,370)🔴 , Bitcoin has seen a bull trap, and we can expect to touch the lower gap($21,110-$20,330).
Considering all these signs I have found, I would also like to know your ideas.😊
How many of these signs did you come across❗️❓
Or according to what kind of signs do you check Bitcoin movements❗️❓
Also, if you have any questions, ask me in the comments.💬❤️

⬆️⬇️Bitcoin Scenarios⬆️⬇️Bitcoin has mocked the 🟢support zone($21,600-$20,940)🟢 in the last 4 days😂.
Bitcoin reacted to the Price Reversal Zone (PRZ) ,Important support line, and 200-SMA, as I expected in the previous post (Title:➕Positive➕ and ➖Negative➖ signs of Bitcoin🤓
) and started to grow.
Bitcoin is currently moving on the 🔴resistance zone($22,640-$22,350)🔴 and downtrend line.
Also, if we look at the status of the RSI indicator, we will find that the RSI is also on the downtrend line and the important line of 50%.👇
🔔According to the above explanations, Bitcoin can see two scenarios for the coming days:🔔
🔜First scenario: If Bitcoin breaks the 🔴resistance zone($22,640-$22,350)🔴and the downtrend line, we can expect Bitcoin to even touch its previous ceiling($25,250) and even go beyond it.
🔜Second scenario: If we see bearish signs in the coming hours, we can expect Bitcoin to start falling again and at least reach the low range of 🟢support zone($21,600- $20,940 )🟢.
Bitcoin Analyze ( BTCUSDT ), Daily time frame ⏰.
Do not forget to put Stop loss for your positions (For every position that you want to open).
Please follow your strategy, this is just my Idea, and I will be glad to see your ideas in this post.
Please do not forget the ✅' like '✅ button 🙏😊 & Share it with your friends; thanks, and Trade safe.

Bitcoin Analyze (Where is the end of correction!?)🧐This is Bitcoin’s chart in the monthly timeframe (Log scale). I want to talk about movements that can be similar, and I tried to find the bottom price of Bitcoin through these movements.
I analyzed each significant movement and correction that Bitcoin had from the first.
Bitcoin was able to make a new All-Time High (ATH) after each significant movement.
🔆In terms of time: Each major correction of Bitcoin has taken about 12-13 months since the All-Time High (ATH).
🔆In terms of price: Every major price correction of Bitcoin follows Fibonacci levels (23.6%_38.2%), and these corrections have deepened each time. Also, the price reduction percentage from the previous ATH was 86%, and 84%.
If Bitcoin wants to follow the previous corrections, we can find the bottom of Bitcoin through these movements.
⏰When can the end of the current correction of Bitcoin❓⏰
According to the above details, the end of the current correction of Bitcoin can be around ⏰Nov 2022 & Jan 2023⏰.
📉Where can the end of the current correction of Bitcoin❓📉
According to the above details, the end of the current correction of Bitcoin can be 📉14800$_13000$📉 (The price retracement of every major move seems to follow Fibonacci numbers. And each time, these returns increase. It is expected, considering that the efficiency of the first move was 23.6% and the efficiency of the second move was 38.2%. This movement will experience a return of about 50%.)
🔆In addition, each time that Bitcoin was able to penetrate the space of EMA 200 ( Exponential Moving Average / Weekly Timeframe ) and SMA 200 ( Simple Moving Average / Weekly Timeframe ), some months later, Bitcoin started to rise.
🟢Recommendation🟢: If you want to verify the end of the correction, it is better to wait for a monthly candle that closes over EMA 200 ( Exponential Moving Average ).
🔆 Fundamental : Due to the ongoing war between Russia and Ukraine and the impact that this war can have on the supply of gas and electricity in Europe (increasing the cost of living in Europe), especially in winter. Also, probably the more inflation growth in the USA, it seems that the Cryptocurrency market will not have good days.
In the comments, tell me your thoughts about BTC’s future scenarios and probabilities. Thanks in advance.
Do not forget to put Stop loss for your positions (For every position that you want to open).
Please follow your strategy, this is just my idea, and I will be glad to see your ideas in this post.
Please do not forget the ✅' like '✅ button 🙏😊 & Share it with your friends; thanks, and Trade safe.

Navigating to a Landscape of Bitcoin 🕊️Phoenix🕊️ Rebirth!!!Hi✋🏻dear traders, I'm pejman🙋🏻 and welcome🌼 to the navigation👁️ of the Bitcoin Phoenix rebirth🔥.
As you know, Bitcoin has appeared as a legend in the cryptocurrency🪙world, so this currency should be described📜 as a legendary💫 bird.
Bitcoin, the world's🌍 first and most popular💕 cryptocurrency, has experienced a rollercoaster🎢 of highs⬆️ and lows⬇️ over the years. Bitcoin has seen its share📈 of ups and downs, from its early days as part of the dark🌆 web to its extreme✨ mainstream popularity💰.
Today I invite💌 you to watch👀 the rebirth🌋 of the Bitcoin Phoenix , and I'm🙋🏻 gonna tell my opinion🗯️ about the rise💲 of this legendary bird from its ashes♨️.
In the chart📈, you can see👀 that this beautiful✨ bird formed a High⬆️ at the price of $69,000 and began to burn🔥 during this downward⬇️ trend in the weekly timeframe.
As you know, the downward trend happens when the candles🕯️ can form 🔻Lower Highs(LH) and 🔻Lower Lows(LL) every time ( General definition of a downward trend ).
As shown in the above chart📉, after reaching the peak⛰️ of $69,000, Bitcoin has been experiencing a price fall🔻 for less than a year and a half and is stuck👊🏻 below an important downward trend line.
In the last few weeks, Bitcoin has been able to break💥 this important downward🔻 trend line to the top🔝, which could be a positive✅ sign for the rebirth🍀 sparks✨ of the young Bitcoin.
The next sign❇️ is that Bitcoin was able to form one of the essential bullish🟢 signals in the financial markets yesterday, the golden🟡 cross.
A Golden🟡 Cross is a basic technical indicator that occurs✔️ in the market when a short-term moving average (50-day) of an asset rises☝🏻 above a long-term moving average ( 200-day ). When traders🤑 see a Golden Cross occur, they take this chart pattern as indicative of a strong bull🟢 market.
The next sign for this spark💥 and confirmation✅ of the bullish🟢 market's beginning is that Bitcoin can close a candle🕯️ above its previous Lower High(LH).
In addition, as you can see👀, the RSI indicator has crossed the 50% line in the weekly timeframe📅 and rose higher🔺. The RSI also can pull back to the 50% line and increase again.👇
According to these signs👌🏻, I expect Bitcoin to decrease🔻 to the Support zone($21870-$20870)🟢, and this price falling⬇️ can be like a pullback and a tribute to this zone.
After that, I expect it to grow💸 to the heavy Resistance zone($31820-$26550)🔴, which is probably our target🎯 price can be around the yearly pivot point, In the future👌🏻.
Maybe this young bird🕊️ will set the market on fire🔥 and be born again. But be patient my friends🙏🏻. Bill Gates says: ‘’Patience is a key🔑 element of success💪🏻’’.
Also, if you are interested in seeing my Bitcoin 🗺️Road map🗺️ drawn using Elliott's theory, be sure to visit the following post.👇
Remember✋🏻 to consult with experienced people, do a lot of research🔍, and be cautious in any investment💰 or financial decisions; Because Discretion is the most significant👌🏻 part of valor.
If you have any ideas💡 or questions❓, I'll gladly answer them in the comments💬.
Bitcoin Analyze ( BTCUSDT ), Weekly time frame ⏰.
Do not forget to put Stop loss for your positions (For every position that you want to open).
Please follow your strategy, this is just my Idea, and I will be glad to see your ideas in this post.
Please do not forget the ✅' like '✅ button 🙏😊 & Share it with your friends; thanks, and Trade safe.

Bitcoin Analyze (Short Term, 15-minute Time Frame,03/16/2023)!!!Bitcoin analysis has been like a 🧩 puzzle 🧩 to me for the past two days (It has always been a pleasure for me😉).
During the last two days, Bitcoin has been able to make a rectangle pattern, so Bitcoin has reacted well to the upper and lower lines of the rectangle pattern.
Also, according to the theory of Elliott waves, it seems that Bitcoin has succeeded in forming a Regular flat pattern (ABC/3-3/5) inside the rectangular pattern so that wave C has completed above the rectangular pattern and the ascending channel.
I expect Bitcoin to at least fall to the lower line of the rectangle pattern after breaking the ascending channel and most likely succeed in breaking the lower line this time.
❗️ Note ❗️: If Bitcoin manages to break the upper line of the rectangle pattern, the scenario will change.
Bitcoin Analyze ( BTCUSDT ), 15-minute time frame ⏰.
Do not forget to put Stop loss for your positions (For every position you want to open).
Please follow your strategy, this is just my Idea, and I will be glad to see your ideas in this post.
Please do not forget the ✅' like '✅ button 🙏😊 & Share it with your friends; thanks, and Trade safe.

Bitcoin Analyze (Short Term, 15-minute Time Frame,03/15/2023)!!!Bitcoin is breaking the support line.
After confirming the break of the support line, we can confirm the end of the Double Three Correction(WXY).
I expect Bitcoin to follow the way I have outlined on the chart over the next few hours.
Bitcoin Analyze ( BTCUSDT ), 15-minute time frame ⏰.
Do not forget to put Stop loss for your positions (For every position you want to open).
Please follow your strategy, this is just my Idea, and I will be glad to see your ideas in this post.
Please do not forget the ✅' like '✅ button 🙏😊 & Share it with your friends; thanks, and Trade safe.

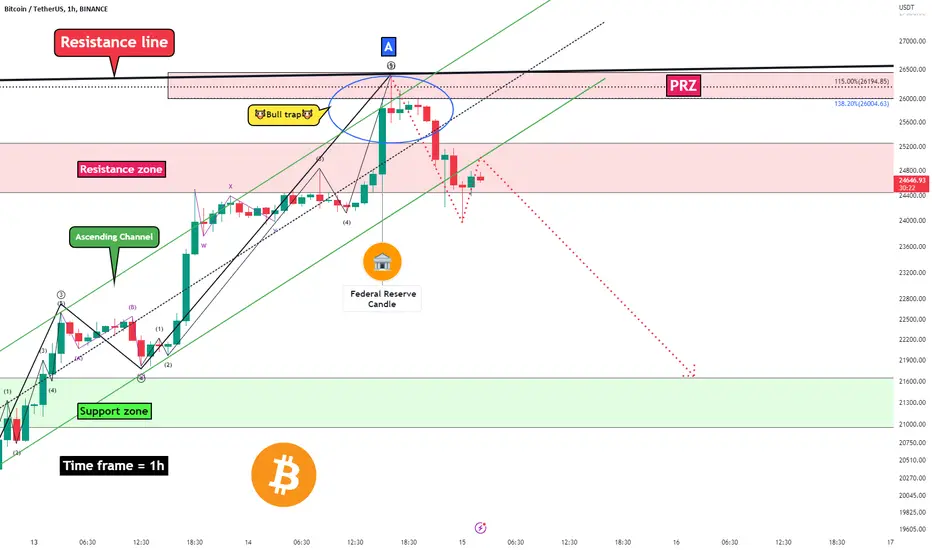
Bitcoin Analyze (Short Term, 1-hour Time Frame,03/15/2023)!!!To start this post, I suggest you read the Bitcoin Roadmap that I shared with you yesterday.👇
Bitcoin was moving in an ascending channel to complete main wave A, and breaking the 🔴resistance zone($25,250-$24,440)🔴 ahead was far from expectation.
Regarding to CPI announcement published by The Fed, we witnessed a 🐮Bull trap🐮 that ended above the ascending channel and near the resistance line and PRZ . Then the Bitcoin fell.
After the ascending channel breaks, we can almost confirm the end of main wave A.
Bitcoin is also likely to form a Head and Shoulders Pattern (Head = 🐮Bull trap🐮).
So, After a pull back to ascending channel, I expect Bitcoin to move towards the 🟢support zone($21,600-$20,940)🟢 over time or with a Sharpie mode.
Bitcoin Analyze ( BTCUSDT ), 1-hour time frame ⏰.
Do not forget to put Stop loss for your positions (For every position you want to open).
Please follow your strategy, this is just my Idea, and I will be glad to see your ideas in this post.
Please do not forget the ✅' like '✅ button 🙏😊 & Share it with your friends; thanks, and Trade safe.
Bitcoin Analyze (Road Map, 03/13/2023)!!!🗺️Hi everyone.👋
Because Bitcoin grew by more than 😱20%😱 in the last 24 hours. I decided to update the roadmap I shared with you on Feb 26.👇
Better first, let's take a look at the fundamental reason for Bitcoin's rise:
Fundamental :
Why are Bitcoin and Crypto Prices Rising❗️❓
After the recent collapse of Silicon Valley bank and the domino effect falling upon Signature Bank due to the Federal Reserve raising interest rates, Fed gave an announcement stating decisive actions to protect the US economy.
Fed’s plan is to do this by increasing the USD liquidity and have bailed SVB out of short liquidity. Increased USD liquidity means an increase in taking risks by investors which has caused a bullish sentiment on the complete cryptocurrency market.
Bitcoin and other cryptocurrencies have rallied in response to the United States Federal Reserve's injection of liquidity into the economy.
🔓Here are the main factors that caused this reaction by the market:🔓
Fed bails out Silicon Valley Bank depositors
Speculation gathers over Fed interest rate "pivot"
BTC price jumps to $24K in blistering comeback
USDC looks to regain $1 peg
Sentiment rebounds as "short squeeze" risk rises
----------------------------------------------------------------------------------------------------------------------------------------------------------------------------------------
Technical :
Now let's take a look at the possible 🗺️roadmap🗺️ of Bitcoin:
Bitcoin completed the main wave A with the Double Three Correction structure(WXY) so that the end of wave A played the role of a bear trap for traders.
It seems that the main wave B has a zigzag correction(ABC/5-3-5) structure due to the sharpie of microwave A (5 microwaves)from the main wave B.
I expect microwave B from the main wave B to touch the 🟢support zone($21,600-$20,940)🟢 again and the main wave B to finish in the areas I have 🎯marked🎯on the chart.
Bitcoin Analyze ( BTCUSDT ), 4-hours time frame ⏰.
Do not forget to put Stop loss for your positions (For every position that you want to open).
Please follow your strategy, this is just my Idea, and I will be glad to see your ideas in this post.
Please do not forget the ✅' like '✅ button 🙏😊 & Share it with your friends; thanks, and Trade safe.

Bitcoin Analyze (Road Map, 02/26/2023)!!!🗺️After breaking the important downward trend line, Bitcoin seems to have passed the main corrective wave A and is on the way to completing the main corrective wave B.
If you are curious about the structure of the main wave A, I suggest you take a look at the following post.👇
If you pay attention to the microwaves in the 12-hour time frame, you will notice that Bitcoin has passed microwave A of main wave B at $25250.
Now, it seems Bitcoin has started the microwave B of the main wave B.
The structure of microwave B of the main wave B can be a zigzag correction(ABC/5-3-5).
The end of microwave A of zigzag correction(ABC/5-3-5) can end on 🟢heavy support zone ($21660-$20330)🟢.
Since microwave 2 of microwave A of zigzag correction was a price correction, I expect microwave 4 of microwave A of zigzag correction to experience a⏰time⏰ correction.
I drew the possible 🗺️road map of Bitcoin🗺️ in my chart.
Bitcoin Analyze ( BTCUSDT ), 12-hour time frame ⏰.
Do not forget to put Stop loss for your positions (For every position that you want to open).
Please follow your strategy, this is just my Idea, and I will be glad to see your ideas in this post.
Please do not forget the ✅' like '✅ button 🙏😊 & Share it with your friends; thanks, and Trade safe.

➕Positive➕ and ➖Negative➖ signs of Bitcoin🤓Hi everyone.👋
Today I want to share with you a complete analysis of Bitcoin.
When we talk about the complete analysis, then we have to deal with the fundamental analysis of Bitcoin in addition to the technical analysis.
----------------------------------------------------------------------------------------------------------------------------------------------------------------------------------------------
Fundamental ;
So let's start by reviewing the news that has affected Bitcoin and the cryptocurrency market in the last 24 hours.
I must say from the beginning that all the news in the last 24 hours has been ➖negative➖.
Don't judge too soon and stay with me until the end of this post. Thank you.🙏🌹
The ➖negative➖ news of the last 24 hours are:
Bitcoin fell below $20,000 after 2 months, and after 56 days the Fear and Greed index re-entered the Fear zone.
In the 2024 US budget, Joe Biden's government has proposed a 30% tax on the electricity used to mine Bitcoin and other cryptocurrencies.
New York's attorney general General Letitia James on Friday sued crypto exchange KuCoin for failing to register with the state before letting investors buy and sell cryptocurrencies on its platform, as part of her effort to rein in what she calls "shadowy" cryptocurrency companies
The Hedera platform suspended all its activities after confirming the hacker attack.
Blockchain.com suspends its asset management subsidiary launched in April.
Huobi’s HT Token Suddenly Falls 93%, Then Rebounds Just as Quickly.
It seems that the results of all these negative news in the last 24 hours have been applied to the Bitcoin chart, and I expect Bitcoin to rebound from its current price and complete its pullback to the support zone.
Now that we talk about the support zone, it is better to go to the technical analysis and see what results we get.
Stay with me in this section.👍
----------------------------------------------------------------------------------------------------------------------------------------------------------------------------------------------
Technical :
Regarding technical analysis, let's take a look at the ➖negative➖ and ➕positive➕ signs in the chart.
➖ Negative signs ➖:
Sell signal by 50-SMA and 50-EMA.
Loss of 🟢support zone($21,600-$20,940)🟢.
Completion of 5 impulse bitcoin waves at $25,250.
➕ Positive signs ➕:
Bitcoin is moving in price Reversal Zone(PRZ).
Bitcoin has reacted positively to the 200_SMA.
The fall of Bitcoin to the import support line can act as a pullback to this line.
----------------------------------------------------------------------------------------------------------------------------------------------------------------------------------------------
Conclusion :
According to the explanations I gave in the fundamental and technical sections, I expect Bitcoin to grow to at least the lost support area and complete a pullback to this area before starting to fall again.
The best area to finish the decline can be the intersection of the important support line and the uptrend line, which is the intersection of the 🟢heavy support zone($18,700-$17,810)🟢.
----------------------------------------------------------------------------------------------------------------------------------------------------------------------------------------------
Do not forget to put Stop loss for your positions (For every position you want to open).
Please follow your strategy, this is just my idea, and I will gladly see your ideas in this post.
Please do not forget the ✅' like '✅ button 🙏😊 & Share it with your friends; thanks, and Trade safe

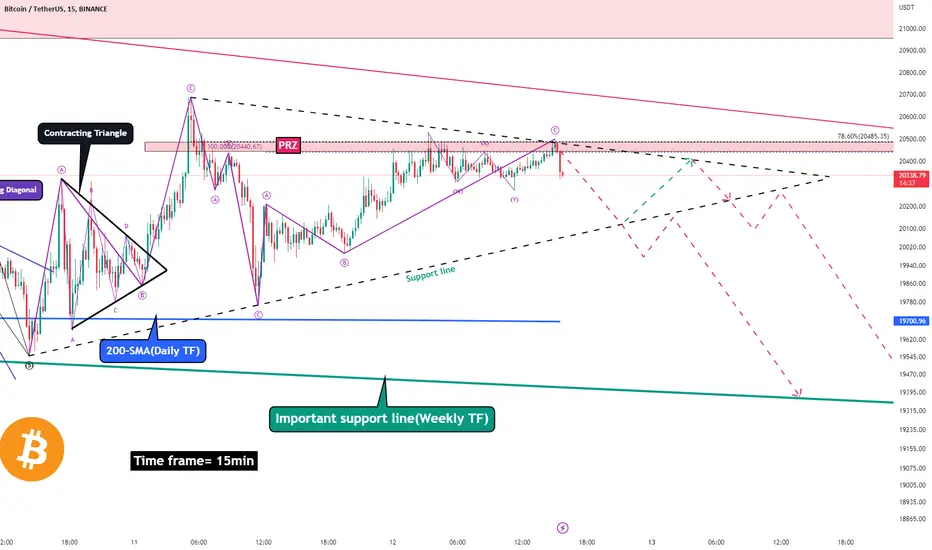
Bitcoin Analyze (Short Term, 15-minute Time Frame,03/12/2023)!!!Bitcoin is running near the Price Reversal Zone(PRZ).
It seems Bitcoin was able to complete last microwave C on PRZ.
I expect Bitcoin will go down after breaking the support line to Important support line(Weekly TF).
Also, Bitcoin can make another contracting triangle by previous waves.
Bitcoin Analyze ( BTCUSDT ), 15-minute time frame ⏰.
Do not forget to put Stop loss for your positions (For every position you want to open).
Please follow your strategy, this is just my Idea, and I will be glad to see your ideas in this post.
Please do not forget the ✅' like '✅ button 🙏😊 & Share it with your friends; thanks, and Trade safe.
Bitcoin Analyze (Short Term, 15-minute Time Frame,03/10/2023)!!!Bitcoin is running near important downtrend line (Weekly TF) and 200 day Simple Moving Average {200_SMA200(Daily).
Also, Bitcoin was able to make and Expanding Ending Diagonal.
I expect Bitcoin will go up at least to 🔴resistance zone($20500-$20390)🔴.
Bitcoin Analyze ( BTCUSDT ), 15-minute time frame ⏰.
Do not forget to put Stop loss for your positions (For every position you want to open).
Please follow your strategy, this is just my Idea, and I will be glad to see your ideas in this post.
Please do not forget the ✅' like '✅ button 🙏😊 & Share it with your friends; thanks, and Trade safe.

Can Descending🥟Scallop🥟Deliver Bitcoin to Support zone❗️❓Bitcoin has been moving in a descending channel for several days.
It seems that Bitcoin has formed a descending scallop pattern to break the support line.
I expect Bitcoin to fall to the 🟢support zone($21600-$20940)🟢 and the lower line of the descending channel after breaking the neckline.
❗️Note❗️: We must wait to break the neckline to verify the descending scallop pattern.
🔔Descending Scallop🔔: Descending Scallop is a continuation pattern that forms in the middle of the downward trends, where the price continues its downward trend after that.
Bitcoin Analyze ( BTCUSDT ), 1-hour Time frame ⏰.
Do not forget to put Stop loss for your positions (For every position you want to open).
Please follow your strategy, this is just my idea, and I will gladly see your ideas in this post.
Please do not forget the ✅' like '✅ button 🙏😊 & Share it with your friends; thanks, and Trade safe

Bitcoin can Escape from 🎪Descending Channels Festival🎪❗️❓Bitcoin is moving in a main descending channel in the 4-hour time frame, and as I expected, the descending Scallop pattern worked well.👇✅
But if you look a little more at the Bitcoin chart in the 1-hour time frame, you will notice that Bitcoin was able to create a smaller descending channel inside the main descending channel.
I expect Bitcoin to break out of the minor descending channel soon and reach the support line.
Bitcoin Analyze ( BTCUSDT ), 1-hour Time frame ⏰.
Do not forget to put Stop loss for your positions (For every position you want to open).
Please follow your strategy, this is just my idea, and I will gladly see your ideas in this post.
Please do not forget the ✅' like '✅ button 🙏😊 & Share it with your friends; thanks, and Trade safe.

Can Bitcoin Break the Support Line❗️❓🧐Bitcoin seems moving in a descending channel and is currently near the support line.
I expect the support line to be broken and Bitcoin to reach the 🟢support zone($21600-$20940)🟢, the lower line of descending channel, and start to grow from the TRZ (at least to the support line is broken).
You may ask why I say that Bitcoin can break the support line❗️❓
🔆Because of the sell signal created by EMA50 and SMA50.
If the daily candle closes below the SMA50, the probability of the support line being broken by the next day's candle is very high.
Bitcoin Analyze ( BTCUSDT ), Daily time frame ⏰.
Do not forget to put Stop loss for your positions (For every position you want to open).
Please follow your strategy, this is just my Idea, and I will be glad to see your ideas in this post.
Please do not forget the ✅' like '✅ button 🙏😊 & Share it with your friends; thanks, and Trade safe.

Bitcoin Analyze (Short Term, 15-minute Time Frame,03/02/2023)!!!Bitcoin is running near the zone and support line.
I expect Bitcoin to start rallying to the resistance line and, from there, to a resistance zone or back to the support zone again.
🔥More possible🔥: Bitcoin is likely to break the resistance line and move toward the resistance zone.
Bitcoin Analyze ( BTCUSDT ), 15-minute time frame ⏰.
Do not forget to put Stop loss for your positions (For every position you want to open).
Please follow your strategy, this is just my Idea, and I will be glad to see your ideas in this post.
Please do not forget the ✅' like '✅ button 🙏😊 & Share it with your friends; thanks, and Trade safe.

Bitcoin Analyze (Short Term, 15-minute Time Frame,02/28/2023)!!!Bitcoin was able to break the uptrend line by a breakout candle.
I expect Bitcoin to fall to my targets that I specified in my chart.
Bitcoin Analyze ( BTCUSDT ), 15-minute time frame ⏰.
Do not forget to put Stop loss for your positions (For every position you want to open).
Please follow your strategy, this is just my Idea, and I will be glad to see your ideas in this post.
Please do not forget the ✅' like '✅ button 🙏😊 & Share it with your friends; thanks, and Trade safe.

Bitcoin Analyze (Short Term, 1-hour Time Frame,02/26/2023)!!!If you want to know more about my bitcoin road map that I shared with you today, look at the below post as well. 😉👇
Bitcoin is moving in a descending channel on the 1-hour time frame.
If we want to look at Bitcoin in the one-hour time frame from the perspective of the Elliot wave theory, Bitcoin is near the upper line of the descending channel, and at the same time, it is completing microwave 4, and since microwave 2 was a price correction, it looks like a microwave 4 is time correction, and counting is correct.
I believe Bitcoin will fall from this price range to the next support zone.
Bitcoin Analyze (BTCUSDT), 1-hour Time frame ⏰.
Do not forget to put Stop loss for your positions (For every position you want to open).
Please follow your strategy, this is just my idea, and I will gladly see your ideas in this post.
Please do not forget the ✅' like '✅ button 🙏😊 & Share it with your friends; thanks, and Trade safe

Bitcoin Analyze (30-minute Time Frame,02/23/2023)!!!Bitcoin seems to be forming a descending channel, and to complete this channel; it needs to complete its zigzag(ABC/5-3-5) correction.
As a result, I expect microwave B of this zigzag correction to end on the middle line of the descending channel and Fibonacci levels, and then Bitcoin will start to rise to the PRZ(Price Reversal Zone).
❗️ Note ❗️: if Bitcoin goes over $25340, the scenario will change.
Bitcoin Analyze ( BTCUSDT ), 30-minute time frame ⏰.
Do not forget to put Stop loss for your positions (For every position that you want to open).
Please follow your strategy, this is just my Idea, and I will be glad to see your ideas in this post.
Please do not forget the ✅' like '✅ button 🙏😊 & Share it with your friends; thanks, and Trade safe.

Bitcoin Analyze (Short Term, 15-minute Time Frame,02/22/2023)!!!Bitcoin was able to make a rectangle pattern after breaking the uptrend line.
To form a rectangle pattern, it is enough to find two pivots on the top and two pivots on the bottom, and it is better that these pivots are aligned.
In my opinion, Bitcoin can break the lower line of the rectangle pattern and fall to the support zone( More possible ), although it is also possible that Bitcoin will continue its way in the rectangle
Bitcoin Analyze ( BTCUSDT ), 15-minute time frame ⏰.
Do not forget to put Stop loss for your positions (For every position that you want to open).
Please follow your strategy, this is just my Idea, and I will be glad to see your ideas in this post.
Please do not forget the ✅' like '✅ button 🙏😊 & Share it with your friends; thanks, and Trade safe.

⚖️Bitcoin Analyze (15-minute Time Frame,02/20/2023)!!!⚖️Bitcoin seems to have responded to yesterday's bearish move with a mirror movement.
This mirror movement ends in the 🔴PRZ(Price Reversal Zone)🔴.
Also, in PRZ, Bitcoin has to 👊fight 👊with Psychological Resistance Level(Round Number).
Since Bitcoin has been able to break the uptrend line, I expect Bitcoin to fall again.
❗️ Note ❗️: if Bitcoin goes over $25340, the scenario will change.
Bitcoin Analyze ( BTCUSDT ), 15-minute time frame ⏰.
Do not forget to put Stop loss for your positions (For every position that you want to open).
Please follow your strategy, this is just my Idea, and I will be glad to see your ideas in this post.
Please do not forget the ✅' like '✅ button 🙏😊 & Share it with your friends; thanks, and Trade safe.
