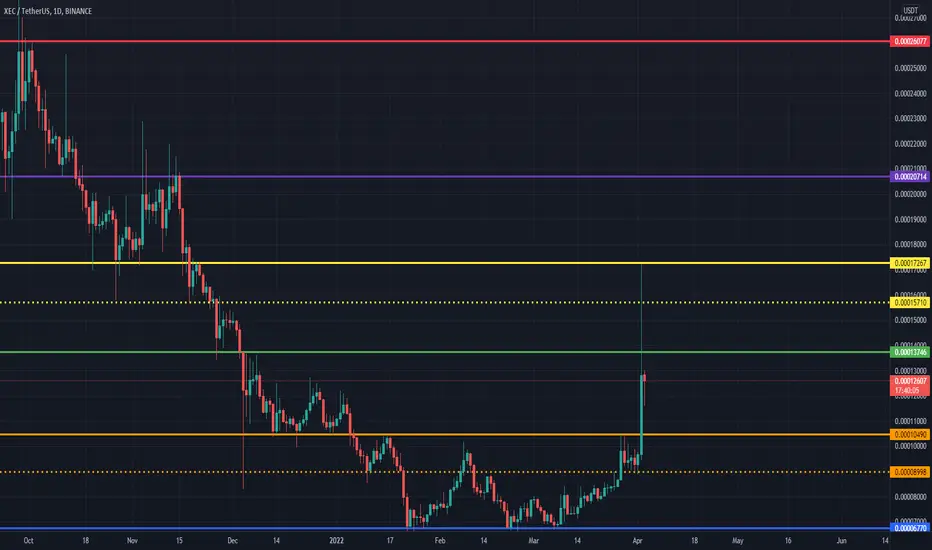
XECUSDT (ECASH) Daily tf Range Updated till 3-4-22XECUSDT (ECASH) Daily timeframe range. there are not much of solid data behind this chart as its fairly new listed with very generic price action. that tells not much of retail interest like other alt's and that explain the slow bleeding till the lower zones. going down from listing number never a good rep. price #discovery messes things up. but hey there is a chance to retrace back for the distance from its top. as for its generic price action the chart is clean and lots of gap within range, how it will be respected depend on volume that will coming in and its holders.
XECUSDT

eCash XECUSDT - New bull market + Bullish rectangle!- eCash is turning bullish, right now the coin is breaking out of the bullish rectangle.
- On the daily chart we can spot a double bottom reversal pattern + trendline breakout.
- Profit target is previous all time high.
- The neckline is breaking out and volume favors bulls.


XEC morning star start to BULLISHAs we can see XEC very powerful morning star pattern in monthly
Start buying and keep monitoring
Mid-Long target 0.0005-0.001

$XEC Trade Idea With The Buy Zone & Possible Targets!!Hi Traders,
This is my analysis for XEC, Entry at the mentioned buy zone, or with a stop limit Order at 0.0...9
Targets are mentioned in the chart, and StopLoss after a Weekly Close Below 0.0...6
Good Luck.
NFA, DYOR. and Remember to calculate your risk according to the StopLoss % ...


eCash (XEC) - March 17Hello?
Traders, welcome.
If you "follow", you can always get new information quickly.
Please also click "Like".
Have a good day.
-------------------------------------
Support and resistance points are weak as the chart has been created shortly.
Therefore, please refer only to the flow level.
(XECUSDT 1W chart)
(1D chart)
Primary resistance section: 0.0001 0763 - 0.0001 1786
Secondary resistance section: around 0.0001 5800
It is more likely to move higher as it is breaking out of the downtrend line and consolidating.
We need to see if we can sustain the price above 0.0000 8300.
It must rise above 0.0001 0763 to turn into an uptrend.
------------------------------------------------------------ -----------------------------------------------------
** All indicators are lagging indicators.
Therefore, it is important to be aware that the indicator moves accordingly with the movement of price and volume.
However, for convenience, we are talking in reverse for the interpretation of the indicator.
** The MRHAB-O and MRHAB-B indicators used in the chart are indicators of our channel that have not been released yet.
(Since it was not disclosed, you can use this chart without any restrictions by sharing this chart and copying and pasting the indicators.)
** The wRSI_SR indicator is an indicator created by adding settings and options to the existing Stochastic RSI indicator.
Therefore, the interpretation is the same as the traditional Stochastic RSI indicator. (K, D line -> R, S line)
** The OBV indicator was re-created by applying a formula to the DepthHouse Trading indicator, an indicator disclosed by oh92. (Thanks for this.)
** Support or resistance is based on the closing price of the 1D chart.
** All descriptions are for reference only and do not guarantee a profit or loss in investment.
(Short-term Stop Loss can be said to be a point where profit and loss can be preserved or additional entry can be made through split trading. It is a short-term investment perspective.)
---------------------------------


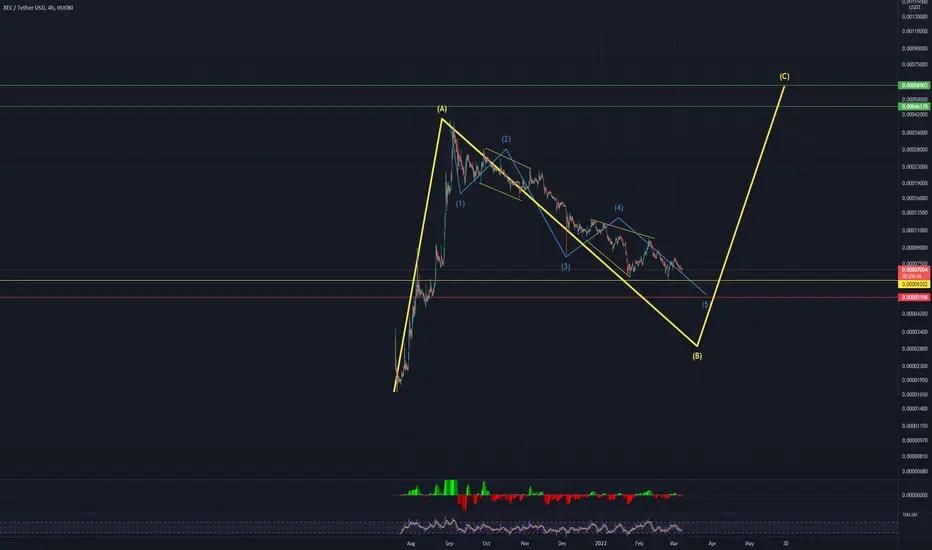
XEC XEC is very close to hits the targets need few more weeks to complete ( B )wave then wait one or 2 months to hits first target maybe takes longer so patience is the key.
if XEC breaks 0.000062 support we might see it at 0.000051 area. but do not worry its better for you to buy from there :)
Peace

#XECUSDT to the moon!After a long time a trade worth it with SL's
0.6336 hammer low (Not adding zero's, youre smart enough to know)
0.8186 and 0.9890 on cards. Best but at CMP or 0.7318

$XEC #XEC Long idea / 2x in the next 10 daysGreat investment for mid-long term
eCash is 99.06% below the all time high
Also on high tf formed a potential Double bottom
Target for short term .00015
Buy & HOLD, soon u`ll thank me!

ECASH THE NEXT GEM WITH 2000% 🚀🌕#XEC Next target 🚀 $ 0.00015 🚀 $ 0.00027 🚀 $ 0.00039 🚀 $ 0.00060 🚀 $ 0.00271 long term analysis

E Cash xecusd 10% long positionHello Traders,
this is my idea for BINANCE:XECUSDT .
See other ideas updated
⬇️⬇️⬇️⬇️⬇️⬇️⬇️⬇️⬇️

XECXEC looking like we are getting ready to continue up soon. Hitting the order block, wedge getting tighter.

XEC ready to startI think XEC In falling chanel which was hard to break it recently
And the uptrend is coming soon
Can we expect any move soon ???
Let me know your thoughts too
I will be glad to hear from you ❤

XECUSDT - SETUPXECUSDT price is moving positively after posting a breakout at a lower timeframe. As support area remain intact by the efforts of bulls and they again show interest which will lead the price towards near-term resistance zone. So buying on dips will be a good strategy. Good Luck!

XEC where is the liquidity zone ? BINANCE:XECUSDT
✅Before we start to discuss, I would be glad if you share your opinion on this post's comment section and hit the like button if you enjoyed it.
Thank you.
Possible Targets
➡️At the bottom I mentioned almost 0 interest zone. Where nobody wanna sell or buy this coin.
➡️Marked Interest zone for trade where will be a lot of Limit orders to SELL
➡️No volume on chart. MACD - bullish. RSI - D1 bullish we lay down long time at the bottom, big players accumulate to pump this coin UP and sell it off in liquidity zone.
Hope you enjoyed the content I created, You can support with your likes and comments this idea so more people can watch!
✅Disclaimer: Please be aware of the risks involved in trading. This idea was made for educational purposes only not for financial Investment Purposes.
Don't forget sub and join my channels under this idea!

XEC Possible Trend Reversal. HUGE PUMP!The next time the price go beyond that yellow line, we can expect it to go even more higher. However, if the price go below the white trend lines, expect it to continue its downtrend.

Xec/usdt Possible Buy Setup.Based on my assumptions so anything can happen not a trading or financial advice kindly do ur own ta thanks and trade with care, good luck.


XECUSDT scenario Next days, Very clearHello there...
this is my XECUSDT scenario For the next Next days, and i think is very clear. do you have a question ?. Feel free to contact me. or by commenting. Your opinion is my concern :)
