New Economy Movement. (XEMBTC) !63% potential! How's it going everyone?!? Thank you everyone for liking and following my content! Much more to come. We will all continue to keep profiting together in our telegram chat. We actively trade on ZOOM daily! PM ME for LINK
LIKE & SHARE & FOLLOW
Looking for signal's on BitMEX/Binance ask me how to join premium!?!
TRADE DURATION: SHORT TERM 1 WEEK
CHART DURATION: 4HR
CURRENT PRICE: 1817
ENTRY PRICE : 1750-1850
TARGETS : 2000-2200-2500
STOP LOSS 5% Below Entry
Key Point's
1. Support low 1700's
2. ( MACD ) - Bullish Divergence
3. Resistance 1800's
4. Binanace Volume 3,644
5. BULLFLAG PENNANT ON (30MIN)
Xembtclong

Profit on XEM with 1 indicatorBuy Green
Sell Red
//
it's mainly for swing trading, i use the 3 day / 15 day / monthly charts with it and it works perfectly,
//
it works good for stocks and cryptocurrency.
//
you will use heiken ashi chart style and turn on the EMA DOTS indicator.
once the indicator is on you will hide the heiken ashi so you only see the dots.
//
when a green dot -6.68% -7.44% -7.44% appears you buy, if a green dot -6.68% -7.44% -7.44% appears after that green dot -6.68% -7.44% -7.44% you hold your investment.
if a red dot appears you sell your position. easy as that.
//
the standard dots setting will be set to 10 - use this for any chart above 3 days
change the dots setting to 6 for 3day charts and below
//
shorter time frames will be choppy.
//
larger time frames will be smooth.
//
*Daytrading smaller timeframes is possible but not recommended.


Daily Bullish Signal $XEM #XEM XEM/BTC (09 November)#XEM (XEM/BTC)
Buy : 1425
Stop : 1300
BLUE ARROW indicates EXPECTED Time and Targets
Contact me if you need help


XEM (NEM) Making Falling Wedge PatternNEM (XEM) Trying to Falling Wedge Pattern if You are Thinking to buy then Follow this Wedge Pattern at Try to Buy Between 1300-1350.

BTC XEM MOONTIME HISTORY
I was checked XEM history a bit. In this picture we see the first accumulation phase beetwen 8 feb 2016-30 may 2016 and after we can see a nice pump
Second accumulation phase was beetwen 7 sept 2016-6 feb 2017 after a hugeeee puuuuump and now..also we are in accumulation phase and we have a very huge bullish divergence at 1week timeframe.
First fibonnaci target and also ichimoku cloud resistance are in 0.236 fib which means 0.00003444 sats
It s not much to say about this chart,we have bull divergence,accumulation phase and after we are mooning!
Enjoy


Daily Bullish Signal #XEM #XEMBTC (11-10)#XEM (XEM/BTC)
Buy : 1450-1500
Flash Sell : 1550
Short Sell : 1600
Long Sell : 1650-1700-1750-1800-1850
Stop : 1400

NEM (XEM) ready to took off?There are bullish divergences in both the SRI and the MACD, plus an increase in volume in what appears to be support. Worth the risk.- POLONIEX:XEMBTC

New Economy Movement Falling Wedge Reversal..XEM/BTC GAINS!XEM is another top altcoin which has been in a big bearish market as we can see and we can see that it has been making a reversal pattern in its bear movement and now we are at our ultimate bottoms, however we can see that we are still inside the wedge and there is still room for downward movement so we should wait for the bounce from our trend line which will get us out of the wedge and the green price zones are our targets and the blue prices are our next supports if we go for more downward movement.
As I am more of mid/long term trader the price we have now is pretty attractive for me and may be a buy in however if you are for instagains then you should probably wait for it to get out of the wedge.
Bullish inedicators:
-EWO - we had a bearish divergence which got rejected by the green wave circled in the graph, and now we are having bullish divergence
-STOCH - has started moving from oversold are and now we are going up
-MACD - strong bullish divergence on MACD (trend has made 3 touches and now we are going for the 4th one, if we bounce from this touch this is a very strong bullish divergence we are having on MACD)
Details of the trade:
Targets:
1. 0.00002029 BTC
2. 0.00002228 BTC
3. 0.00002532 BTC
4. 0.00002735 BTC
Stop loss: well if we are joining the trade now then our stop loss should be 0.00001490 BTC and we can sell there and buy at lower prices(the blue prices shown)
Buy-in: 0.00001495-0.000016 BTC and if we go for downward movement inside the wedge then you are free to buy at the blue prices.
Good Luck, Traders! #moon #mooncommunity

XEMUSD IN DOWNWARD WEDGE - HUGE PUMP TO COME - CryptoManiac101XEMUSD TRADE
Enjoy this trade advice my Crypto Maniacs, but remember to invest only what you can afford to lose or you're going right back to poverty on drop. We are not your financial advisors.

XEMBTC Potential Weekly SupportXEMBTC has been on a downtrend along with all cryptocurrency assets since January, this week we are looking at some relief on the selling pressure. Coins are randomly pumping out of nowhere after being exhausted and taking this in account along with XEM being a solid platform, we believe to have a small swing trade opportunity. ADX is on all time low, and considering that volatility is all time low too, it could indicate a sudden move up which is something that goes accord to the "story" of the current cryptocurrency market, my own targets are posted below.
Buy: 0.00001670-0.00001680 ; SL: 0.00001572
Target 1: 0.00001749; Target 2: 0.00001799; Target 3: 0.00001839
Disclaimer
Cryptocue is not providing individually tailored investment advice and is not taking subscribers personal circumstances into consideration when discussing investments. Investment involves a high degree of risk and should be considered only by persons who can afford to sustain a loss of their entire position. Investors should consult their registered financial adviser before investing.
Cryptocue is not registered to provide investment advice and is simply providing an opinion, giving a particular experience. Information contained here is not an offer or solicitation to buy, hold, or sell any security.
Cryptocue is not a broker-dealer or financial adviser and is not affiliated with an investment advisory firm and does not engage in activities that would require such registration.
Cryptocue and/or any others affiliated with CryptoCue, are not responsible for any gains or losses that result from the opinions expressed herein.
Cryptocue makes no representation as to the completeness, accuracy, or timeliness of the material provided and all materials are subject to change without notice. Opinions discussed herein have not been reviewed by the securities and exchange commission or any state securities regulatory authority. Furthermore, in cases of ICO the foregoing authorities have not confirmed the accuracy or determined the adequacy of the ICO offering documents

Will XEM bounce from it's support?POLONIEX:XEMBTC
what way will we go? It's definitely a roller coaster ride.

XEM - get ready for the RALLYHey guys,
This time i'm taking a look at XEM.
As with most altcoins,this seems to be resting at the very bottom of the white line of the triangle,that's been confirmed at least 5 times.
Problem is,we were in the same situation with the green-triangle support line that we broke under.We still lack the volume necessary to get this growing.
How to trade: My advice would be to wait and see.A breakout out of this triangle would imply the appearance of a Golden Cross,which is one of the clearest signals in technical analysis,once it's confirmed.
(Golden cross= a bullish breakout pattern formed from a crossover involving a price's short-term moving average breaking above its long-term moving average >>>In our case,200MA crossing under 30 and 50 MA<<< )
You can use the ''Blockfolio'' mobile app to set some alerts on the price,in order not to miss out this potential opportunity.
Chances are,break out of this triangle UPWARD ,so if you really want to get into this trade now, you can buy and set a stop-loss at the 2389 satoshi line ,just to be sure you have your funds protected.
As always,i hope everything plays out according to plan,so that we all get to benefit from this.
Cheers!

XEM is getting ready for a trade, 100% potentialHello Friends,
Another trade for you,
#Bithumb (Korea's One of The Biggest Exchanges) is going to List #AE and #XEM Today.
So good volume and XEM has other risk hope you remember the hack stuffs. So take a trade if you are convinced.
I am taking a risk with sl below the Triangle line
Entry can be now or after the breakout. Good luck.


XEM Short term tradeHello Friends,
Please find the XEM trade. (SHORT Term trade)
1) Listed in Binance.
2) Forming Double bottom, as we broke the neckline already and the price is testing the neckline and forming a pull back.
3) Volume is good.
Considering the above points, we would hit 15%, target : 4150, Stoploss is below the neckline.
Post your thoughts.

XEM Long term tradeHello Friends,
Please find the XEM long-term view.
1) Listed in Binance means more volume.
2) We have made the double bottom around 3000 SATs twice which is a sign of coin reaching the bottom. And a decent bounce of 3000 SATs from 5600 SATs is a good sign that price has reached the bottom.
3) Volume is good.
So my trade is
Buy on the neck line : 3640 SATs
Target 1: 4200 SATs
Target 2: 5600 SATs
Target 3: 10000 SATs (once broken the neckline at 5600, expect a pullback and the price could move to 10000 SATs.)
Sl : 2800 SATs
Risk Reward for this trade, 800 SATs : 6360 SATs , 1: 8

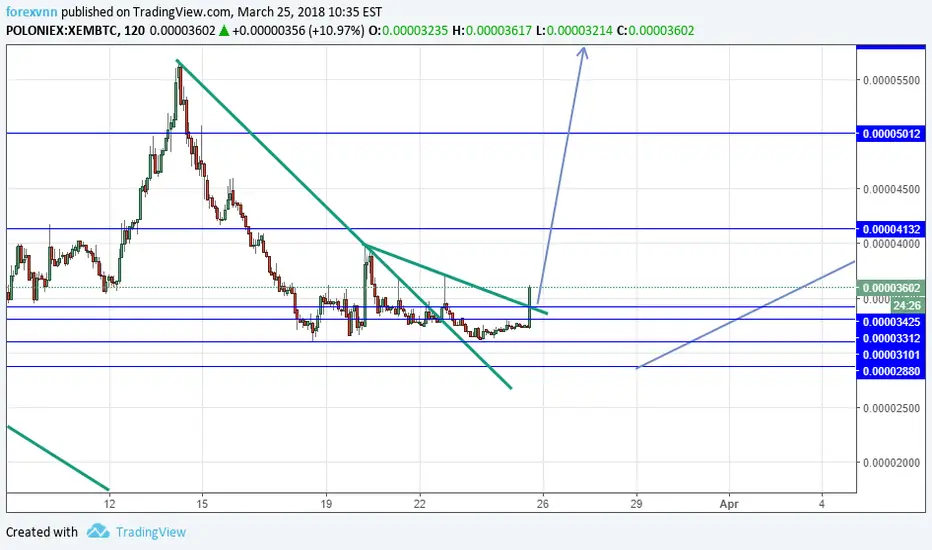
XEMBTC long above 3100 ASSP Tp at the Blue on CHART XEMBTC long above 3100 ASSP Tp at the Blue on CHART

10SMA Crosses Above the 20SMA - Moving Average Crossover SIgnalIf you have been trading for some time and have been
using Technical Analysis as a way to find trading
opportunities, you would have probably come across the
Moving Average Crossover strategy.
It is probably one of the most well-known Technical
Analysis signals out there. The strategy basically uses
Two Moving Averages, one with a shorter period and the
other with a longer period.
A bullish signal is generated when the shorter period
Moving Average crosses the longer period Moving Average
from below.
When the opposite happens, that is when the shorter
period Moving Average crosses the longer period Moving
Average from above, we have a bearish signal.
Now the million dollar question is does this strategy
actually work?
There are those who swear by it, while others feel that it
is the sure road to the poor house.
*DISCLAIMER*:
I am not a financial advisor nor am I giving financial advice.
I am sharing my biased opinion based on speculation.
You should not take my opinion as financial advice.
You should always do your research before making any investment.
You should also understand the risks of investing. This is all speculative based investing.
