One more ratio Chart: $HWKN vs $XLBSome say ‘there is no bull market without materials and industrials. Today we looked at a specialty chemicals and material company called Hawkins Inc. This stock is a great compounder and a huge momentum play. The stock has returned more than 500% to its investor. This small material cos., which works in the field of specialty chemicals and provides industrial solutions for waste and water management has outperformed the Select Sector Materials sector ETF ( AMEX:XLB ).
IN the ratio chart of NASDAQ:HWKN vs AMEX:XLB we see the bullish momentum in favor of NASDAQ:HWKN and its relative outperformance against the Material sector. Recently this momentum has stalled, and the Ratio is below the 20-Day, 50-Day and 100-Day SMA and just hanging above the 200-Day SMA. If this holds, we can accumulate NASDAQ:HWKN at this level as one of the strongest momentum stocks within the materials complex.
XLB

SANA - two scenarios to evaluateNASDAQ:SANA is offering two potential scenarios. The first is a breakout of a descending trendline after a lengthy consolidation. These are some of my favorite patterns to trade.
I'd look to take profits in 3 stages that start with the fib resistance areas and recent highs, and end with anticipation of resistance at the volume weighted average anchored to IPO (purple). I like a tighter stop for the first scenario (~5.70) since biotechs are risky and we're in a month that has a history of seasonal weakness.
The second scenario is the potential would be a breakout of a broadening pattern that formed between May and October 2023. Since Jan 10 2024 only wicked through, we'll look for another test and overhead resistance ~7.20 prior to breakout. I will enter on breakout since breakouts from broadening patterns may not retest support. Profit taking would take place at measured ranges from the pattern and key fib levels.
Note that the technical projection exceeds 12 month consensus price targets. We also have earnings in March which could be a positive or negative catalyst. A move below ~5.45 would require a new analysis.

This sector looks incredibly weak!XLB materials sector saw a nasty down day today despite the S&p500 closing positive.
Clear relative weakness is being observed.
One of the leading stocks in XLB : DD (Dupont) collapsed by 14% after issuing weak forward guidance ahead of their earnings.
If they're expecting softer demand from China you can almost count on contagion through the sector.

XLB - Monthly SupportInvestors waiting for a more probable long term support zone could wait until price action retraces to the top of the channel .
This channel has kept price action in check since the early 2000/s
We only broke out of the channel when we expanded the monetary supply and lower rates to zero.

XLB tagging Intermediate SupportMaterials Sector is getting oversold on the daily chart and tagging a key daily upsloping trend line.
A technical bounce is favoured at this level, however there is a weekly support level lower that is much stronger if this were to sell off more.
This bounce may only last a few days unless the indices firm up.

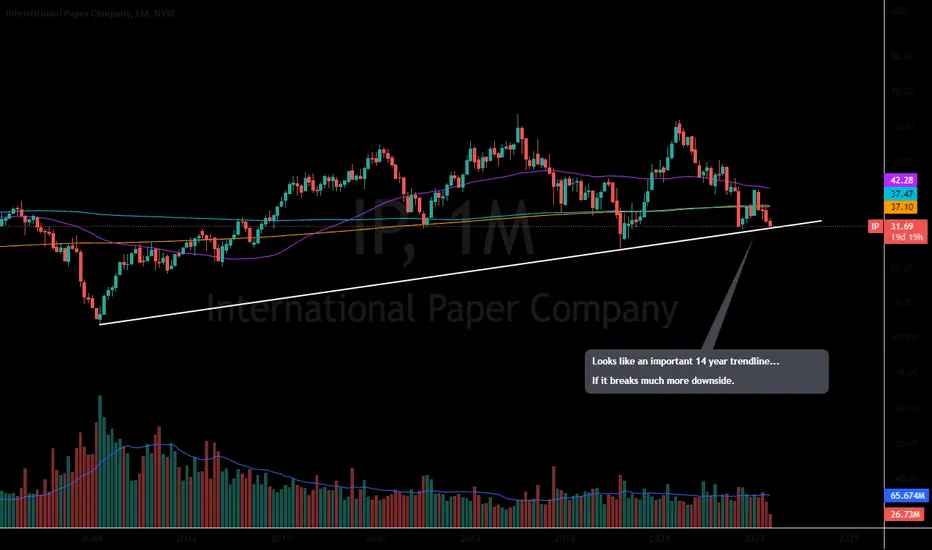
IP (XLB) needs to hold this level or trouble lies aheadLots of weakness in many Material stocks.
Material stocks are leading indicators for aspects of our economy.
This pattern trendline breaks and it could signal a massive decline.
CE showing weaknessOn the verge of breaking lower...if it holds this neckline it could push higher.
Below all key Moving Averages

Week 5 Sector Analysis: S&P 500Discussing all the leading sectors
0:15 XLK
1:40 XLV
3:45 XLY
4:45 XLC
5:37 XLP
6:26 XLF
7:33 XLI
9:00 XLU
10:54 XLRE
12:14 XLB
13:15 XLE

Weekly Sector Analysis S&P 500Looking into all the major sectors of the S&P 500 to see if this breakout can be trusted.
we review all sectors on a weekly basis to provide insights of the overall market.
Most sectors have not broken out & trading at major resistance.

Reliance Steel (RS) WeeklyWhat is not to like about this chart. 30.08 ROE, low debt ratios, good margins and cash flow. Solid trend on weekly, looking for starter entry around the dashed red line or the top of the cloud (198.69).

XLB materials broke 78, the 2021 support; 70 or 57 may be nextThe worst may not be over. A 8% inflation is very hard to fight even with monetary & fiscal policy because the FED could only control the demand side & not the supply side of inflation. With the FED making it very clear that it wont stop until inflation comes down, we may be seeing aggressive rate hikes leading to layoffs & demand destruction in the near future & in turn causing a decline in manufacturing & materials.
XLB just lost the 78 (Fib 0.236) impt support since 2021. The next stop to watch very carefully is the Fib 0.383 pivot zone @70. This may come sometime in late August or early September 2022.
Make-or-break zone: if 70 fails, then 64 (Fib 0.50) will offer not much support till 57 which is the pre-pandemic zone. This scenario will end the ABC correction sometime in November or in the last Quarter of 2022.
Not trading advice.

APD Bull FlagAPB has formed a bull flag . Watching this week for a breakout to the upside. Note the volume .

X (United States Steel) - Bearish Double Top & Momentum - DailyX (United States Steel Corporation) stock price has double-topped below $38.57. Bearish momentum (MACD) has down-crossed on a daily time frame.
Entry (short): $37.25
Profit Target +12% (exit): $32.76
Stop Loss -6% (exit): $39.49
Utilize stop loss, profit targets, position sizing, and risk management.
Note: Many stocks and ETFs have already rallied up for the past two weeks, signs of price potentially topping out have formed.
XLB (Materials sector ETF) price has also reached a Resistance Zone and could possibly pull back to the downside.
All content is Not financial advice. Trade at your own risk.

XLB Nearing DECADE Long 2.618 ExtensionTrading plan on chart. Need a break and retest of the $94 area before adding positions. Favoring a corrective wave to add new positions. Earnings season could be the catalyst to spike into an ending diagonal (pointed out on chart).
This could be one of the top sectors for 2021 but I'd like to wait for a pullback to add.
If you get anything from this post please like and share. Start the conversation/debate in the comments :)
Cheers and happy trading!
Casey

Sector Winners and Losers week ending 9/17Energy (XLE) topped the sector list this week after the OPEC Monthly Report on Monday projected that demand for oil would exceed pre-pandemic levels by next year. The sector also got a boost from Crude Oil Inventories data released on Wednesday that showed much higher demand than expected.
Consumer Discretionary (XLY) moved into second place after great Retail Sales data on Thursday.
Utilities (XLU) and Materials (XLB) were the bottom two sectors for the week. Although markets were lower this week, investors did not flee to defensive sectors.

XLB Daily TimeframeSNIPER STRATEGY
This magical strategy works like a clock on almost any charts
Although I have to say it can’t predict pullbacks, so I do not suggest this strategy for leverage trading.
It will not give you the whole wave like any other strategy out there but it will give you huge part of the wave.
The best timeframe for this strategy is Daily, Weekly and Monthly however it can work any timeframe above three minutes.
Start believing in this strategy because it will reward believers with huge profit.
There is a lot more about this strategy.
It can predict and also it can give you almost exact buy or sell time on the spot.
I am developing it even more so stay tuned and start to follow me for more signals and forecasts.

Sector Winners and Losers week ending 9/13Materials (XLB) led the sector list for the week, getting a massive boost on Tuesday and Wednesday after the Infrastructure bill passed the Senate. Industrials (XLI) also got a boost from the bill.
Financials (XLF) contented for the top spot, gaining from rising Treasury yields that positively impact performance for the sector. However, yields dropped on Friday, and the sector dropped back to third place.
The defensive sectors of Consumer Staples (XLP) and Utilities (XLU) also ended the week near the top of the list, signaling caution throughout the week as investors worry about rising cases of COVID in the US and around the world.
Energy (XLE) had a few good days but ended the week in the last place.

Bias more on upside. The U.S. Senate voted to advance a $1 trillion infrastructure package on Saturday.
XLB may be benefited from this package.
Bias on the upside.
TP: $89
Trade Safe

Sector Winners and Losers week ending 7/30Materials (XLB) was the top sector of the week as manufacturing and core durable goods data showed increase demand and was confirmed in consumer spending numbers. The growth in the sector was matched by increased prices in metal commodities required to support economic expansion.
Energy (XLE) started the week strong and led several days throughout the week, but ended in second place behind Materials at the end of the week.
The three worst sectors were the growth sectors, all losing for the week. Technology (XLK), Communication Services (XLC), and Consumer Discretionary (XLY) were at the bottom of the weekly sector list.


Sector Winners and Losers week ending 6/18It was a volatile week in the indexes and the sector list as investors rotated on the Fed's new hawkish stance toward inflation. Energy (XLE) led early in the week, but Technology (XLK) topped the list by the end of the week, ending the week as the only sector to hold onto gains.
In second place was Consumer Discretionary (XLY). Growth stocks remained strong compared to Value stocks even in the sell-off that occurred on quadruple witching Friday.
The cyclical sectors were at the bottom of the weekly sector list, with Materials (XLB) having the worse performance among a drop in commodity prices.
