Natural Gas - The Epic Reversal? Natural gas had an astonishing move to the upside. Closing up over 5% today.
This volatility can make all tarders head spin if youre not used to it.
Why did Nat gas pop today?
Partly from being oversold and into really good technical support, Natural gas inventories were released today at 10:30am.
The inventories showed a smaller build than the market expected which implies stronger demand. 56B consensus vs 53B actual.
This could potentially be the start to a new bullish trend.
Names like EQT & AR hit some major support today. Some call options on these names have been accumulated.
XLE

Israel VS Iran War: Oil Spike!Tensions between Israel and Iran have escalated dramatically, with both nations engaging in direct military strikes. Israel launched Operation Rising Lion, targeting Iran’s nuclear infrastructure, missile factories, and military personnel. In response, Iran retaliated with missile attacks on Israel, hitting Tel Aviv and wounding civilians
The conflict stems from long-standing hostilities, particularly over Iran’s nuclear program, which Israel views as an existential threat. The situation has drawn international attention, with the United States distancing itself from Israel’s actions while maintaining strategic interests in the region.
The escalation has raised concerns about a wider regional war, with analysts warning of unintended consequences and further retaliation. The global markets have also reacted, with oil prices surging amid uncertainty.

RIG Mega Profits SecuredRIG is a high beta oil stock. We secured profits today and looking for another entry.
With the recent breakout and upside momentum in oil, this name caught a massive bid.
Crude oil has seen a sharp rise in just the last week and shaping up for a continuation move higher.
If this breakout holds energy stocks should continue to fly.
WTI has its first major resistance level coming up within 1% from current price.
Look for pullback buys in energy if oil continue to hold the inverse head & shoulder breakout.

Do You Smell That...Natural Gas Burning!Recent Trends: The Energy Information Administration (EIA) reported the seventh consecutive weekly gain in inventories since late April, indicating a steady buildup ahead of summer demand.
Regional Highlights:
East: 340 Bcf
Midwest: 396 Bcf
Mountain: 166 Bcf
Pacific: 199 Bcf
South Central: 658 Bcf
Next inventory report is June 12 2025
June 5 - 122B Build
May 29 - 101B build
May 22 - 120B Build
These last builds have come in higher than consensus andd price is still holding.
A weekly Bullish cross of the 7 / 20 MA is about to occur. This indicates high provability of higher prices on the next few months if this can hold above the key MA's.

$USOIL & $XLE: Sustainable bull run or short-term bounce?Recently the commodities and the commodity stocks are having a bull run. Oil being one of the largest categories within the Bloomberg Commodity Index Futures is late to the party after the AMEX:GLD rally. In my recent posts I made the case that the TVC:USOIL will remain range bound, and we will see 55 $ in $USOIL. But since then, TVC:USOIL has gone through a small rally with price currently @ 65 $ which has taken it closer to the 0.5 Fib retracement level. AMEX:XLE , which represents the S&P500 energy sector stocks, is also attempting to post a rally.
In the short-term markets have diverged from our last predictions. Let’s be honest in the short term such rallies might be accompanied by short covering and the weakness in TVC:DXY is also helping the Energy rally. But now the question comes where do we go from here?
TVC:USOIL and AMEX:XLE can have a bull rally due to short covering and momentum pushing it across the 0.5 Fib level. If TVC:USOIL breaks above 0.5 then the next stop 0.618 will take us 80 $ indicating a 25% upside form here. And a similar upside in the AMEX:XLE will take us 131 $, which is also 25% up from its current value and the upper range of the upward slopping channel indicative from the chart.
Verdict: Short term probable bounce in TVC:USOIL and $XLE. Long term bearish on TVC:USOIL with target 55 - 60 $.

COINBASE and it's massive inverse head and shoulders...observed in Coinbase chart formation indicates it has potential to become a trillion-dollar enterprise!
With a Logarithmic projection heading towards $4000 per shares.
#COIN has a market cap off $66 Billion right now
It has as just entered the SP 500
Is in the process of receiving a Banking Licence
And is the main custodian for all the major #crypto ETF's
Those are the drivers why this is likely to be a four figure stock in the coming years.

Will the US Energy Sector Outperform the Overall US Market📈 The US Energy Sector has completed a textbook corrective pattern, ideally a fourth wave.
⏺️ If the 74.49 low holds (-7% decline from today), this sector has the potential to gain at least 23% over the coming months.
🟠 A breach of 74.49 invalidates this outlook.

Exxon is oversold (the most since 2020)NYSE:XOM is inside it's sideways channel since March 2024 and trades within a price range of $108 - $123 with one failed breakout to the upper side in October.
The recent pulldown came from commodity prices (oil) and political drama about how much oil will be offered in Trump's term. Of course, it would be best if supply will not outpace demand too much since this would let oil prices drop. Trump will learn this soon enough. Because of that it's mostly noise what we have seen in this chart.
The level at $108 offered strong support twice and the sector (XLE) is also offering support itself. Also, the last time we've seen this stock so oversold was during the Covid crash in 2020.
From a fundamental perspective, Exxon Mobil's recent performance highlights its strong investment potential. The company's total shareholder yield, combining dividends and buybacks, now exceeds 7%, offering substantial returns to investors. In Q3 2024, Exxon reported $8.6 billion in net profit, with a 25% production increase, partly due to the acquisition of Pioneer Natural Resources. Despite a 5% earnings decline from lower commodity prices, Exxon's diversified operations and strategic investments in alternative energy position it well for long-term growth. The recent stock price dip presents an attractive entry point for investors seeking robust returns in the energy sector.
Target Zones
$114.00
$123.00
Support Zones
$108.00

Gas futures at 6-month highs, will oil follow?Oil futures NYMEX:CL1! are forming a weekly reversal pattern at support levels
Gas futures NYMEX:NG1! already made the same pattern and rebounded strongly and is now making 6-month highs
The US energy sector AMEX:XLE is already discounting that a rebound in oil will happen, as it is near all time highs

The MOST IMPORTANT Chart On The Planet - $1M Bitcoin Incoming MartyBoots here , I have been trading for 17 years and sharing my thoughts on the most important chart on the planet which is the XLE chart.
This chart will change the entire world
XLE is looking beautiful , very nice chart for more upside
Very similar to SPX500 which also went parabolic
Do not miss out on XLE as this is a great long term opportunity
Watch videos for more details

TLT tends to bottom at the same level of TLT/XLETLT seems to bottom at a consistent level of the ratio of bonds to energy represented by TLT/XLE. TLT is currently at the level associated with macro bottoms and the start of major bond market rallies.

XLE AT A INTERESTING PRICE WHEN LOOKING AT THE PASTDoes this mean anything?
Yes and no.
you need more to go on than just this to project the move, however, if you assume middle trend is where this price wants to go to stabilize, and you see we are at a major spot when it comes to horizontal support.
I really can't tell yet where it goes.
The upside percentage is far less than the potential downside percentage.
Upside is favored, but again, I can't really tell on this one to say anything other than, it's at a horizontal mark that has been historically important.

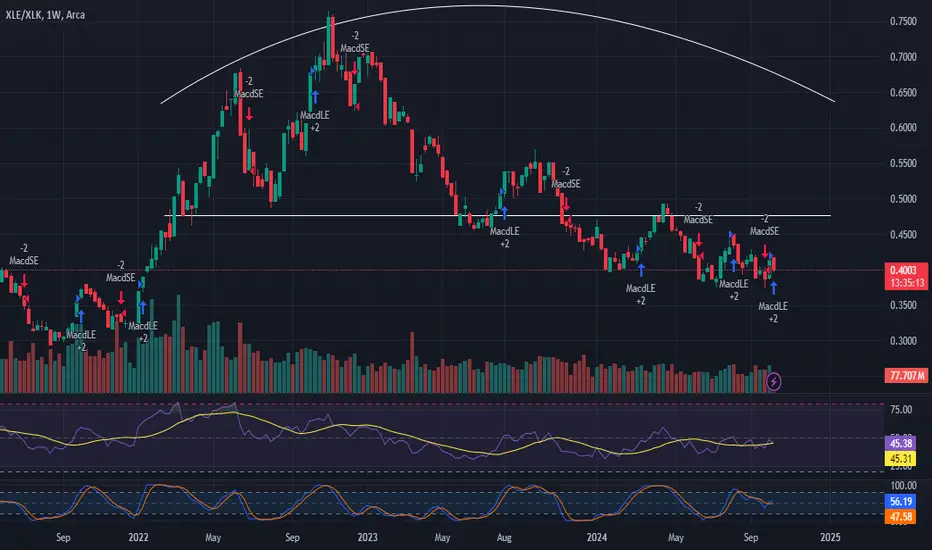
Energy vs Tech : Analyzing Sector Performance and Market TrendsIntroduction:
The comparison between the energy sector (XLE) and the technology sector (XLK) provides valuable insights into current market trends. As the largest sector in the S&P 500, XLK often serves as a barometer for broader market strength. Conversely, when XLE outperforms XLK, it may signal caution, as XLE's smaller size limits its impact on the overall index.
Analysis:
Sector Comparison: XLK's performance is crucial in indicating market health. When XLK outperforms, it generally suggests a robust market outlook. On the other hand, if XLE starts to outperform XLK, this may indicate potential weakness in broader market conditions.
Inflationary Pressures: This ratio between XLE and XLK also reflects inflationary trends. A strong performance from XLE relative to XLK may signal rising inflationary pressures, which investors should closely monitor.
Charting the Pattern: The energy sector has formed an inverted saucer pattern. A breakout from this pattern could signify a positive upward trend and possibly a return to inflation.
Trade Setup:
Entry Point: Monitor the XLE/XLK ratio for a potential breakout confirmation.
Stop Loss: Consider setting a stop loss below the recent support level identified on the chart.
Target Price: Set a target based on the measured move from the breakout point of the inverted saucer pattern.
Conclusion:
The comparative performance of XLE and XLK offers essential insights into market dynamics and inflationary pressures. Traders should keep an eye on the potential breakout from the inverted saucer pattern in XLE, as it may indicate a shift in market trends. What are your thoughts on this analysis? Share your insights in the comments!
Charts: (Include relevant charts showing the XLE/XLK ratio and the inverted saucer pattern)
#Energy #Technology #MarketTrends #Inflation #XLE #XLK
XLE: Rising Wave PatternTechnical analysis chart of the Energy Select Sector SPDR Fund (XLE), with Elliott wave analysis overlaid. Let's break down the analysis based on the chart and labels:
Overall Analysis:
The chart suggests a bullish trend for XLE, based on the Elliott wave structure. It indicates that we have completed wave ((4)) of wave V and are now in the unfolding wave ((5)). Within wave ((5)), we have started wave (1), and are currently in wave (3) of (1).
Wave Counts and Labels:
V Red: This represents the fifth and final wave of a larger Elliott wave pattern.
((4)) Black: The fourth corrective wave within V.
((5)) Black: The fifth and final impulsive wave within V.
(1) Blue: The first impulsive wave within ((5)).
1 Red: The first wave within (1).
2 Red: The second corrective wave within (1).
3 Red: The third impulsive wave within (1) (currently unfolding).
Price Projection and Invalidation as per Waves:
Bullish Projection: The chart suggests a potential target of 105 for wave ((5)).
Invalidation Level: A break below 83.02 would invalidate the current bullish analysis.
Educational Notes:
Elliott wave theory is a technical analysis tool that identifies patterns in price movements based on a series of five waves.
Impulsive waves (1, 3, 5) move in the direction of the overall trend, while corrective waves (2, 4) move in the opposite direction.
Wave labels use brackets to indicate different levels of analysis. For example, ((5)) is a larger wave than (1).
Colors are often used to visually differentiate between different waves and patterns.
I am not Sebi registered analyst.
My studies are for educational purpose only.
Please Consult your financial advisor before trading or investing.
I am not responsible for any kinds of your profits and your losses.
Most investors treat trading as a hobby because they have a full-time job doing something else.
However, If you treat trading like a business, it will pay you like a business.
If you treat like a hobby, hobbies don't pay, they cost you...!
Hope this post is helpful to community
Thanks
RK💕
Disclaimer and Risk Warning.
The analysis and discussion provided on in.tradingview.com is intended for educational purposes only and should not be relied upon for trading decisions. RK_Charts is not an investment adviser and the information provided here should not be taken as professional investment advice. Before buying or selling any investments, securities, or precious metals, it is recommended that you conduct your own due diligence. RK_Charts does not share in your profits and will not take responsibility for any losses you may incur. So Please Consult your financial advisor before trading or investing.

SPDR Select Sector Fund - Energy Select SectorIf you like my Idea, Don't forget to Boost and comment on my Analysis.. The recommendations are purely for educational purpose only, consult you financial advisor before trading.
if you have any questions do not hesitate to contact me.

Is oil signalling a recession? Oil has really started to free fall.
The death cross on the daily chart has occurred. this is where the 50 MA intersects with the 200 MA in a downtrend.
This often implies more downside to the medium and long term but is often a great short term long signal.
Usually when you get this signal the market makers bounce the stock or commodity a bit before taking it lower.
We are hitting a massive multi year trend line going back to 2022 that should act as some support.
XLE looks ready for 1 more down leg before a swing tradable low is in.
Energy does have a tendency to fall precipitously so understanding oil can keep falling if investors fear the worst or a recession.

Opening (IRA): XLE October 18th 83 Monied Covered Call... for a 81.41 debit.
Comments: This is a little early for a run at grabbing the September dividend, but wanted to get in when the underlying is still hovering around recent lows ... .
Metrics:
Break Even/Buying Power Effect: 81.41
Max Profit: 1.59 (ex. divvies)
ROC at Max: 1.95% (ex. divvies)
50% Max: .80
ROC at 50% Max: .98%

Opened (IRA): XLE August 16th 85 Monied Covered Call... for an 83.77 debit.
Comments: Some of the only red on my ETF board ... . Here, selling the -75 delta call against a one lot to emulate the delta metrics of a 25 delta short put, but with the built-in defense of the short call. There is also a divvy to be had some time in June, with the last distribution being .73.
Metrics:
Buying Power Effect/Break Even: 83.77
Max Profit: 1.23 ($123)
ROC at Max: 1.47%
50% Max: .62 ($62)
ROC at 50% Max: .74%

See you later ChevronNYSE:CVX
note the following directional arrows are concepts and how I want to enter
With firms rotating out of AMEX:XLE we can expect some of the sectors top holdings and laggers get downside potential. Looking more into this I found NYSE:CVX to be the best candidate. NYSE:CVX and other gas stocks seem to be the ones catching the momentum down. Chevron also is following the same structure as AMEX:XLE which if AMEX:XLE gets the drop Monday we can expect NYSE:CVX to follow.
Expected Range - Upside $158.78 Downside $151.82
Key Levels - $153.37 - $153.59, $155.05 - $155.30, $155.61 - $156.94
Rating - Rotation out of AMEX:XLE +5, Rising volume near pivot +1, formed a base (slowed down)/topping wicks after break of base +1, same weakness as AMEX:XLE +1
8/10 Bullish, 2/10 Bearish

Natural Gas: A Mega Move is BrewingNatural Gas has been a very volatile asset in recent sessions.
The price action in the 4 hour chart has triggered a bullish breakout.
The next bullish inverse head and shoulders pattern on the daily chart is starting to take shape. This pattern has not yet triggered.
If we see a breakout of this pattern there is about $1.50 of upside from the neckline.
Resource stocks are still holding up very well, granted so is the market.
A very similar structure is playing out on the weekly chart, regarding the 50 Weekly MA
If we see price trade in congruency we should see more upside this week and then potentially we may see some sellers the folling week

XLE reached the supportBullish move soon. It reached the support line. The previous historical resistance line.

May Market Outlook, Sectors Rotation, Relative Strength AnalysisSince February, the commodities asset class has surged ahead, overshadowing the S&P 500's faltering performance. This notable shift in market dynamics underscores the resilience and strength exhibited by commodities during this period.
Of particular interest are the XLE and XLU sectors, which have emerged as frontrunners since early March. This transition coincided with the decline in momentum of previously dominant sectors like XLK and SMH (refer to Fig. 2). Notably, XLE and XLU, characterized as growth defensive sectors, have thrived amidst market downturns. Investing in commodities and energy/utility sectors during these phases could have yielded significant profits, with select energy stocks boasting returns exceeding 25%, while the S&P 500 experienced an approximate 10% decline.
Looking ahead to May, it's anticipated that XLE and XLU will maintain their market leadership, albeit with a slight loss in momentum. However, investors are advised to remain vigilant as these sectors may soon witness a change in dynamics. It's crucial to employ stop limit orders to safeguard profits in such volatile conditions.
Following the current trajectory, XLY, XLRE, and XLF are poised to emerge as significant players in the market cycle (refer to Fig. 3&4). However, it's important to note that these sectors are susceptible to rapid momentum shifts, particularly when XLK and XLC regain momentum.
Looking towards June, indications suggest that XLK and XLC will likely regain prominence in the market. For buy-and-hold investors, this presents an opportune moment to consider purchasing assets during market dips.
Considering these market dynamics, my top investment picks are (TSLA), (GOOG), (AAPL), (ORCL), and Cisco Systems, Inc. (CSCO). These companies demonstrate strong growth potential, especially when timed strategically to align with sector rotation leadership shifts.

Solar stocks follow energy prices (crude oil).Solar stocks follow energy prices (crude oil) and AMEX:USO (oil etf) is about to break out. I read that chinese are outcompeting the west in cheaper solar products. ie NYSE:JKS
TNX is at bull market, crude oil and yields correlate (not sure which one cause the other).
I look at everything trough probabilities since nothing is ever known.
Stocks do bad when economy does good. But energy sector performs well during good economy, whilst everything else is falling (Tech). Peak tech means bottom for energy?
I think these are good hedge plays, if you believe rising oil or yields pose risk.
Recently Chinese gov asked Jack Ma to return because their financial markets did poorly. There could be a sentiment shift, where indicator will be NYSE:BABA performance. People might still have an old bias?
