Sector Winners and Losers week ending 12/18The sectors took on a character we have not seen for some time.
Technology (XLK) is back to leading the sectors for this week. Helped by a number of breakouts in technology growth stocks, some of those fueled by speculation in security stocks following a wide and troublesome security breach that impacted both the government and private sector.
Consumer Discretionary (XLY) came in second, after very briefly passing Technology on Wednesday morning. Retail Sales data and Santa Claus are likely the reasons for the great performance.
Materials (XLB) also performed well on Building Permits and New Housing Starts data that came in better than expected.
The big loser for the week was Energy (XLE). This is after five weeks of leading the sector list. Despite vaccine availability and positive oil prices giving it a boost midweek, the nervous sentiment caused by new lockdowns worldwide have put downward price pressure on the sector.
XLE

CVX-2.169*XOM $XOM Exxon Mobil Corp vs. $CVX Chevron CorpQuantamental Tools for Proprietary and Retail Investors.
Statistical Arbitrage Opportunities Delivered to Your Inbox.
QuantChart. io
Long 1000 $CVX
Short 2169 $XOM
Mean Reversion Time: 12 Trading Days

CVX-2.169*XOM $CVX Chevron Corp vs. $XOM Exxon Mobil CorpQuantamental Tools for Proprietary and Retail Investors.
Statistical Arbitrage Opportunities Delivered to Your Inbox.
QuantChart. io
Long 1000 $CVX
Short 2169 $XOM
Mean Reversion Time: 12 Trading Days

THE WEEK AHEAD: FDX, LEN, MU, CCL EARNINGS; XOP/XLE, IWM/RUTEARNINGS ANNOUNCEMENT-RELATED VOLATILITY CONTRACTION PLAYS (IN ORDER OF ANNOUNCEMENT):
Here are the options-liquid underlyings announcing next week that I've culled down to 30-day >50% as candidates for volatility contraction plays:
LEN (21/49/11.6%),* announcing Wednesday after market close
MU (24/52/12.2%), announcing Wednesday (no time specified)
FDX (29/53/11.9%), announcing Thursday after market close
CCL (27/91/21.1%), announcing Friday (no time specified)
Pictured here is a January 15th 17.5/27.5 short strangle in CCL which announces Friday, paying 1.36 as of Friday close with delta/theta of -4.86/4.84 with break evens wide of 2 times the expected move on the call side, and between the 1 and 2 x on the put. Although no time is currently specified, it is likely to announce before market open (because who, like, announces after Friday close?), so would look to put on a play in the waning hours of Thursday's session if you want to take advantage of Friday's post-announcement volatility contraction.
EXCHANGE-TRADED FUNDS RANKED BY BANG FOR YOUR BUCK:
XOP (21/60/16.3%)**
GDXJ (15/44/12.9%)
XLE (30/45/12.5%)
KRE 924/41/11.1%)
SLV (25/40/11.2%)
GDX (16/38/10.7%)
EWZ (15/39/10.6%)
XBI (24/38/10.0%)
BROAD MARKET EXCHANGE-TRADED FUNDS:
IWM (25/30/7.8%)
QQQ (23/30/7.6%)
DIA (16/23/6.0%)
SPY (16/23/5.6%)
EFA (20/24/5.1%)
TREASURY/BOND FUNDS:
Adding a little bond/treasury section to here since I occasionally park what would otherwise be idle cash in short puts (See Post Below).
TLT (11/15/3.99%) (1.609% yield)
HYG (11/11/2.41%) (4.917% yield)
EMB (5/9/--)*** (4.024% yield)
AGG (29/8/--)*** (2.252% yield)
* -- The first metric is the implied volatility rank or percentile (i.e., where 30-day implied is relative to where it's been over the last 52 weeks); the second, 30-day implied volatility; and the third, what the January 15th at-the-money short straddle is paying as a function of stock price.
** -- Here, I'm using the short straddle price nearest 45 days until expiry to calculate the "bang for your buck" percentage, which would be the January 29th weekly.
*** -- EMB and AGG don't have weeklies nearest 45 days.

Sector Winners and Losers week ending 12/11Despite starting the week in last place, Energy (XLE) rose to the top of the sector list starting from Tuesday as the first vaccine doses were made available in the UK. That positive vaccine news boosted the sector that is likely to benefit from the increased activity in travel and leisure sectors.
Communications (XLC) led at the beginning of the week, but could not keep up with Energy and finished the week in second.
Utilities (XLU) also had moments of leadership on Monday and Tuesday. The sector is a defensive play in equities and an alternative to moving money into other safe havens such as bonds.
Real Estate (XLRE) was the worst performing sector for the week.
Technology (XLK) that heavily impacts market performance, underperformed the S&P 500 this week.

THE WEEK AHEAD: GDXJ/GDX, XLE, KRE, SLV, IWM/RUTEARNINGS:
No options liquid underlyings announcing earnings this week that meet my criteria for a volatility contraction play, although ORCL (24/31) and WORK (2/33) both announce and could be played in some other way.
EXCHANGE-TRADED FUNDS RANKED BY THE PERCENTAGE THE JANUARY AT-THE-MONEY SHORT STRADDLE IS PAYING AS A FUNCTION OF STOCK PRICE:
GDXJ (14/41/12.1%)
XLE (25/41/10.4%)
KRE (23/40/10.6%)
SLV (28/41/10.2%)
GDX (15/38/10.2%)
EWZ (15/39/10.0%)
BROAD MARKET EXCHANGE-TRADED FUNDS RANKED BY THE PERCENTAGE THE JANUARY AT-THE-MONEY SHORT STRADDLE IS PAYING AS A FUNCTION OF STOCK PRICE:
IWM (23/28/7.1%)
QQQ (20/27/6.3%)
DIA (15/21/5.2%)
SPY (12/20/4.8%)
EFA (17/24/4.4%)
Pictured here is a RUT January 22nd 1655/1705 short put vertical with the short option leg camped out at the 16 delta. Markets are showing wide in the off hours, but look to get at least 10% of the width of the spread out of any play, with the preference being to put something on in a down day with the accompanying rise in volatility and expansion of the "probability cone." A smaller alternative would naturally be in IWM, where I'd look to get at least .50 out of January 22nd 162.5/167.5 5-wide.
For those who like to swim naked, the IWM January 22nd 162.5 (15 delta) and was paying 1.91 as of Friday close (1.15% ROC at max as a function of notional risk; 8.93% annualized).
* * *
On the IRA/retirement account front, I'll be looking to programmatically deploy buying power in broad market over medium to long-term time frames over the next several weeks and then turn to focusing on shorter term plays, so you're likely to see some apparently oddball things in my ideas feed that won't make a ton of sense looked at in isolation and won't be for everybody not only due to buying power effect, but due to duration. I'm using SPY here, but one can certainly do something similar in another of the cheaper (a relative term) exchange-traded funds with high liquidity that will allow you to ladder out in time without giving up too much to lack of liquidity in longer duration.
Essentially, it will look like a short put ladder, but with the rungs put on over time in increasing duration in similarly delta'd strikes or in strikes which pay a certain ROC %-age relative to the strike price (e.g., the SPY February 19th 321 short put, paying 3.27; the March 19th 300 short put, paying 3.02; the April 16th 283, paying 2.87, etc.), after which the individual rungs will be separately managed.
Although this isn't particularly buying power efficient relative to defined risk spreads, I'm shooting for a setup that is relatively set and forget running into retirement where I don't necessarily have to pop my portfolio open on a daily (or even weekly) basis to manage trades, but can go for fairly lengthy periods of time without having to touch or manage rungs and with modest expectations as to ROC %-age.
As a "quasi-cash" option, I'll also continue to deploy idle buying power in things like HYG puts (See Post Below) just that I'm not earning 0% of 0 and where I'm comfortable taking on shares and selling call against. Point in fact, that is probably not a bad stand-alone setup for an extremely conservative investor who isn't keen on taking broad market bullish assumption positions at all-time-highs where a number of people are calling "bubble" week after week. That being said, even this type of setup isn't riskless, as we saw in the March "sell everything" dip. At some point, you will potentially have to take on shares ... .

Sector Winners and Losers week ending 12/4Energy ( XLE ) is now in its fourth week of leading the sectors list. It didn't look that way at the beginning of the week when it sold off off sharply amongst disagreements between OPEC members on future oil production. It rose back to the lead as those talks began getting better on Wednesday and OPEC finally had agreement on Friday.
Technology ( XLK ) and Health Services ( XLV ) nearly tied for second. They shared the lead on Tuesday. Health Services had a huge boost after the UK announced approval of the Pfizer vaccine. Both Health Services and Technology didn't move much after the progress on Tuesday, but it was enough to keep them in position for a solid tie 2nd place ending.
Communications ( XLC ) led for two days, before being overtaken by the top three and ending the week in fourth place.
Utilities ( XLU ) was the loser of the week. The defensive play wasn't needed by investors who seemed optimistic about vaccines, stimulus talks and oil agreements. That was enough optimism to ignore the unemployment data signaling trouble for the economy.

Long $USOIL $GUSH $XOPFrom the NYT : "Under the agreement, members of the Organization of the Petroleum Exporting Countries along with Russia and other countries will increase production by 500,000 barrels a day in January and, potentially, by a similar amount in the following months. The increase, less than 1 percent of the global oil market"
From WSJ : "The price rout has also laid low big, publicly traded oil companies like Exxon Mobil Corp. and Royal Dutch Shell PLC, triggering big losses and job cuts. Shell and BP PLC both recently cut their dividend for the first time in years to preserve cash. Chevron Corp. on Thursday said it was joining peers in slashing spending."
Oil companies are an important fixture in all of the most powerful countries in the world. While I fully recognize that the oil industry is a dying one, the financial stress that the majors are currently under is causing them to be undervalued relative to their integration, importance, and efficiency at this point in time.
Higher oil prices from where they currently are is in the best interest of every major economy. It is a perfect time to make this happen given the effectiveness of the almost-approved Covid-19 vaccines.
Just an idea!

Is the oil sector uninvestable? We don't listen to stories about a future no one knows we just simply trade reversals and continuation wave formations our model gives us. We highlighted the xle in late october and took the trade early november. Obviously the vaccine news was a huge boost and we had no idea it was coming but that's the beauty of markets- you don't know what you don't know. So we are uncertain if the sector will continue to move at this pace but until something changes we are staying long
Ingenuity Trading Model is an algorithm used in- Stock, Forex, Futures, and Crypto markets. The model is a Geometric Markov Model :
In probability theory, a Markov model is a stochastic model used to predict randomly changing systems. Markov Models are used in all aspects of life from Google search to daily weather forecast. The randomly changing systems we focus on are the equity, futures, and forex markets. The geometric element of the model is the fractal sine wave structure you can find on any chart you look at across any market and across all time dimensions.
Our model focuses on the current sine wave formation (current state)- geometric price formation along with its volume and volatility over a given time period and using that information to predict the future state- future price movement. For questions or more information feel free to contact me in the comment section or via private chat


THE WEEK AHEAD: XOP/XLE, GDXJ/GDX, KRE, EWZ, IWM/RUTEARNINGS:
It's a light week for earnings announcements, which means it's an even lighter week for options liquid underlyings, none of which meet my cut-off for 30-day implied >50%.
EXCHANGE-TRADED FUNDS RANKED BY PERCENTAGE THE JANUARY AT THE MONEY SHORT STRADDLE IS PAYING AS A FUNCTION OF STOCK PRICE:
XOP (18/59/15.8%)
GDXJ (16/42/13.2%)
XLE (26/46/11.6%)
KRE (24/40/11.4%)
GDX (17/40/11.4%)
USO (7/46/11.0%)
EWZ (15/39/10.6%)
SLV (25/38/10.3%)
Honorable Mention:
GLD (23.5/18.5/5.0%)
* * *
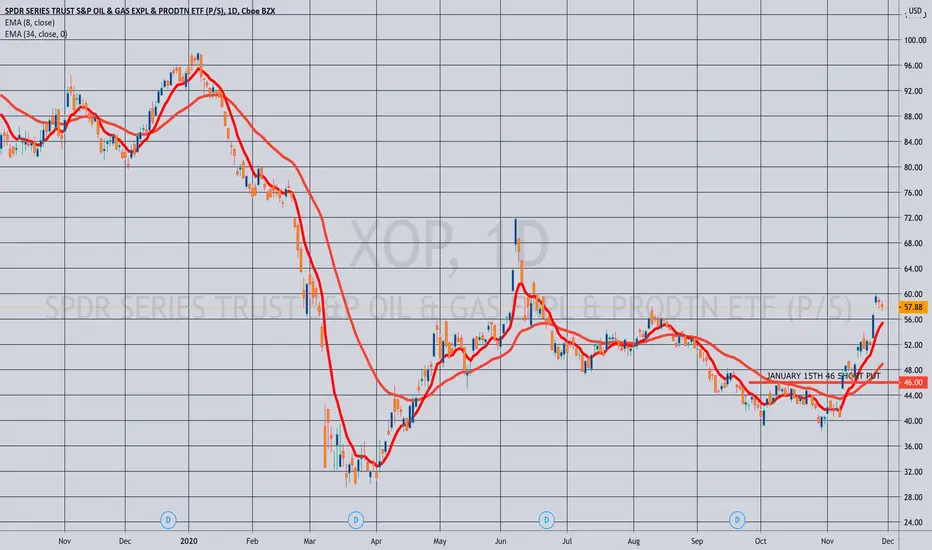
Pictured here is an XOP January 15th 46 short put, which was paying .92 as of Friday close (2.04% ROC as a function of notional risk at max; 15.5% annualized at max). I still like bullish assumption, pandemic recovery plays in the oil space, although implied volatility has bled out quite a bit here, and the break even (45.08) would be above the 2020 lows.
GLD gets an honorable mention here due to its being nearly 15% off of its early August highs with the January 15th strike nearest the 16 delta (the 157) paying .94 as of Friday's close (.60% as a function of notional risk at max; 4.6% annualized). The ROC %-age isn't great, however, but if you're looking to establish a gold position, now might be the time to consider starting one. I'm already working one here, (See Post Below), and will consider adding once December out-of-the-money's fall off or I manage them.
Alternatively, look to establish a position in SLV, GDXJ, or the more liquid GDX, all of which are more scalable due to size and provide more bang for your buck, with the GDXJ January 15th 42 paying .70 (1.7% ROC as a function of notional risk; 12.9% annualized), the GDX January 15th 30 paying .40 (1.4% ROC at max; 10.3% annualized), and the SLV January 15th 19 paying .30 (1.6% ROC at max as a function of notional risk; 12.9% annualized at max).
For those of a defined risk bent, the GLD January 15th 153/158 short put vertical was paying .54 at the mid as of Friday close (10.8% ROC at max; 82.1% annualized).
BROAD MARKET
IWM (23/29/7.8%)
QQQ (19/25/6.9%)
DIA (16/22/5.8%)
SPY (13/21/5.3%)
EFA (16/18/4.6%)
Volatility has pissed out mightily here, and the <10% the at-the-money short straddles are paying in the January cycle are reflective of that.
The IWM January 15th 157 short put was paying .94 (.6% ROC at max as a function of notional risk; 4.6% annualized) as of Friday close, which isn't exactly great. Here, defined is more compelling from a pure ROC %-age return perspective (it usually is), with the IWM January 15th 158/163 was paying .54 as of Friday's close (10.8% ROC at max; 82.1% annualized) and its cash-settled counterpart RUT, paying 5.10 for the January 15th 1610/1660 with similar ROC %-age metrics with the short option legs camped out at the 16 delta strike. Naturally, you can be more aggressive, bringing in the setup more toward the expected move.
Sector Winners and Losers week ending 11/27Energy (XLE) put in a third week of huge gains and topped the other sectors. The sector is up over 40% in the last three weeks. It did pull back a bit on Wed and Fri.
Financials (XLF) also sticks out as a winner for the week, far above the rest of the sectors.
The worst performing sectors were Real Estate (XLRE) and Utilities (XLU). Utilities briefly emerged as a leader for Wednesday afternoon as investors parked money in the safe haven sector for the holiday.
Technology (XLK) underperformed the index for a third week.

Short-Term Energy Long Might see a short-term jump here .
Just an idea. This oil pump could reverse in a flash with bad vaccine or lockdown news.

Trade Update: Sell 25-50% and move stop to breakeven Ingenuity Trading Model- Swing Trading Algorithm used in all markets- Stocks, Forex, Futures, and Crypto
The model is a Geometric Markov Model :
In probability theory, a Markov model is a stochastic model used to predict randomly changing systems. Markov Models are used in all aspects of life from Google search to daily weather forecast. The randomly changing systems we focus on are the equity, futures, and forex markets. The geometric element of the model is the fractal wave structure you can find on any chart you look at across any market and across all time dimensions.
Our model focuses on the current wave formation (current state)- geometric price formation along with its volume and volatility over a given time period and using that information to predict the future state- future price movement. For more information visit our website

THE WEEK AHEAD: GPS EARNINGS; KRE, XLE, EWZ, IWM/RUTEARNINGS:
Only one underlying makes my cut for a earnings announcement volatility contraction play: GPS (25/70/14.9%),* which announces on Tuesday after market close, so look to put on a play in the waning hours of Tuesday's session.
To me, it's small enough to short straddle, with the pictured setup paying 3.72 (.93 at 25% max). Alternatively, go short strangle: the December 18th 22/29 was paying 1.25 (.62 at 50% max).
Of a defined risk bent? Go iron fly with the December 18th 20/25/25/30 and get better than risk one to make metrics, with the setup paying 3.00 even as of Friday close (.75 at 25% max).
EXCHANGE-TRADED FUNDS RANKED BY BANG FOR YOUR BUCK (JANUARY 15TH EXPIRY):
KRE (22/40/14.0%) (Yield: 3.43%)
XLE (25/43/12.5%) (Yield: 6.15%)
EWZ (17/43/12.2%) (Yield: 2.89%)
GDX (13/37/11.7%) (No dividends)
SLV (22/37/10.8%) (No dividends)
BROAD MARKET RANKED BY BANG FOR YOUR BUCK (JANUARY 15TH EXPIRY):
IWM (24/30/8.5%)
QQQ (20/26/7.6%)
SPY (18/23/6.2%)
EFA (16/19/5.3%)
* -- The first metric is volatility rank/percentile (i.e., where 30-day implied volatility is relative to where it's hung out the past 52 weeks); the second, 30-day implied; and the third, what the December at-the-money short straddle is paying as a function of stock price ("Bang for Your Buck").

Sector Winners and Losers week ending 11/20Energy (XLE) was the big winner of the week for the second week in a row. Additional positive vaccine news signaled the possibility of several sectors recovering and driving demand for oil and gas.
After a poor performance last week, Technology (XLK) followed closely the performance of the S&P 500 index.
Utilities (XLU) performed the worst this week, although it was the best performing sector during Friday trading.
Health Care (XLV) also did not have a great week, spending much of the week as the worst sector until the honor was passed to Utilities.

Rotation hedge with Energy ETFOk boyz, so you guys are strong believer in momentum, you've ran your backtests on US Sectors and fund out that with a roughly 55% probability the best performers of last year will be the best performers of the next year. So you are still long tech like crazy and believe the FAANG stocks will keep rising. However what does financial professionals like to do? They hedge part of their risk, they maximize their sharp ratio by minimizing volatility with diversification in uncorrelated assets.
What is your biggest risk right now? With a new vaccine on the way? => A big rotation of smart money from leaders (tech, healthcare) to laggards (Energy, Financials, Transportation, REITS). It's already happening right now.
XLE US is down 45% year to date, it is the ultimate laggard ! And you know what? Historical probability of worst laggard to move to the top five leaders of next year is 65%, odds are in our favor.
The ETF showed strong momentum last week with a nice weekly hammer candlestick with strong volume, this is a bullish reversion pattern. Let's wait for confirmation on Monday's open, if it confirms, we are catching the first wave to a nice ride up ! up to recovery and post covid world. The vaccine wont be massively available and massively distributed before mid 2021 I believe, HOWEVER the stock market is merely the second order of the real economy, not the first order! It is the acceleration of the economy, so as soon as the vaccine is being shoot the first person, the widespread reopening will increase tremendously.
Option 101 => acceleration = second order = GAMMA, we want to be long gamma right now => buy calls 3 months on XLE. To save some carry cost, i would suggest a strike at 110% of the current spot, this translate to a roughly 35% Delta. This is quite out of the money but i believe the volatility on this sector is going to up with the spot.
my pick : call 31Mar2021 strike 37. Delta = 24%,
Remember: this strategy makes sense if your portfolio is globally long tech, and please do not risk more than 5% of your portfolio value with the premium. This is not WSB :D

Sector Winners and Losers week ending 11/13Energy (XLE +17.11% WoW) was the clear winner of the week. Straight out of the gait, Energy benefited from the news that an effective vaccine could be available soon. The Energy sector would benefit from the economic recovery of several of sectors including Transportation, Travel and Leisure.
Financials (XLF +8.29% WoW) followed in a distance second. Banks have a lot to benefit from an economic recovery including higher yields in bonds as investors move back into equities.
Those two sectors stood tall above the rest who all performed more closely to the S&P 500 performance.
Technology (XLK -0.31% WoW) was the only sector to end the week with losses. A clear metric of what we already knew - that investors rotated out of popular technology stocks that benefited from the pandemic lockdowns.


Nasdaq, What happened in October?Note: You can click the Yellow markers in the chart and read the Daily Updates for that day.
2) President Tests Positive for COVID, this announcement comes afterhours sending futures to the negative. Eventually he is checked into the hospital for close monitoring.
5) Just a few days after the COVID announcement, the president returns to the whitehouse touting the effectiveness of the drugs used to combat the virus.
6) After pushing for stimulus agreements from the hospital, the President abruptly declares they would no longer seek a stimulus agreement until after the election. This reverses an otherwise positive day for the market.
8) Some positive messages from the President and congress renew hopes for stimulus. This back-and-forth news on the stimulus becomes a hallmark for the month.
12) Although a positive day for the market, this is the pivot day, so it’s worth taking a look at some key signals from the day.
Positive
+Huge gain on increased volume.
+IBD Follow-thru Day for Nasdaq.
+All my daily update trend lines are on upward slope.
Negative
-ADVQ/DECLQ is downward trend last two days.
-T-Bond Yield Spreads peaked 10/5, trended down.
-Put/Call Ratio back near 0.60.
Interesting
* This is also pivot day where Biden/Trump polling starts to edge back to Trump.
* From this point XLK moves from the 2nd best sector (behind XLU) in the month to worst by end of month.
* XLU remains relatively strong thru October.
13) A sideways, inside day with poor closing range.
14) Still trading inside Monday’s range, but down on lower volume. FSLY surprise guidance announcement after hours tanks the stock price by 30%.
16) 4 out of 5 of my trend lines in my daily updates show a negative expectation
19) All sectors are negative with XLU performing best
20) From this point, daily volume shrinks except two big sell-off days. SNAP is up 30% after hours following earnings beat.
21) Growth favorites (PTON, DDOG, FVRR) are pivoting downward.
23) The week ended with a character change, two days of high closing range, lifting hopes for Monday.
26) Hopes are dashed with weekend news. Pandemic reaching new heights in Europe, and SAP revises guidance down impacting many Enterprise software stocks. This is the first close below 21d EMA since September.
27) Index is up, but there are more decliners than advancers. Growth stocks rotating winners/losers, as if investors are searching for strength.
28) Mega-caps (all companies above 200B) lose on the day. All sectors down. Ouch.
29) AMZN, AAPL, FB, SHOP offer positive earnings, but sell-off after hours as new lockdowns in Europe are announced overnight.
30) Ouch. Ouch.
So here are some broader observations as we close the month of October:
A) First the facts. -2.29% loss on the month (not as bad as September). The monthly candle has a tall upper wick, 33% red lower body and an 8% closing range.
B) The VIX went past the highpoint in September and reached the highest point since June.
C) XLU (Utilities ETF from S&P500) was defying gravity, holding up better compared to most sectors as well as the Nasdaq. However, this past week it has come down with the rest of the market.
D) XLE (Energy ETF from S&P500) propped up the market 3 times after oil announcements only to deflate again the following days.
E) The 21d EMA is still above the 50d MA for the Nasdaq. That 21d EMA is below the 50d MA for the other major indexes. It is also trending to go below on the Nasdaq in the first week of November.

$XOM - Exxon Mobile Daily ViewExxon posts lighter than expected Q3 loss, slashes 2021 capex plan - seekingalpha.com
Was thinking this might drop below $30 on this ER but its been holding up. Looking for a swing back up near $34-$38 range.

𝗖𝗿𝘂𝗱𝗲 𝗨𝗽𝗱𝗮𝘁𝗲: $CL_F Daily. Triangle BreakdownConsolidated into triangle in August/September, which has broken down. Failed to get a golden cross. Possible run towards 26-28 area which is major area
$USO $XLE $XOM $CVX $XOP $GUSH $DRIP $SPY #Oil #CrudeOil #OOTT 🛢️
