XLE

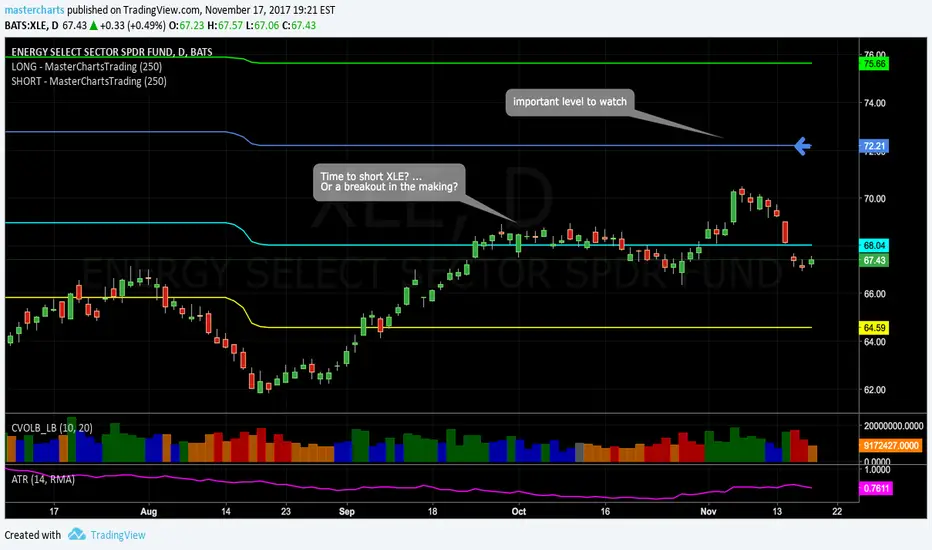
Strangle on XLE (58% probability)With the strong move to the upside, I am betting that we are starting a new auction between 78 and the 71 levels. So with an Implied volatility Rank of 37, I sold a Strangle at the 30 deltas for a $1.36 credit. As long as the price stays between $78.35 and $71.65, we will be making money.
The Trade:
Short 73 Puts
Short 77 Calls
Credit $1.36 per contract
58% Probability of profit


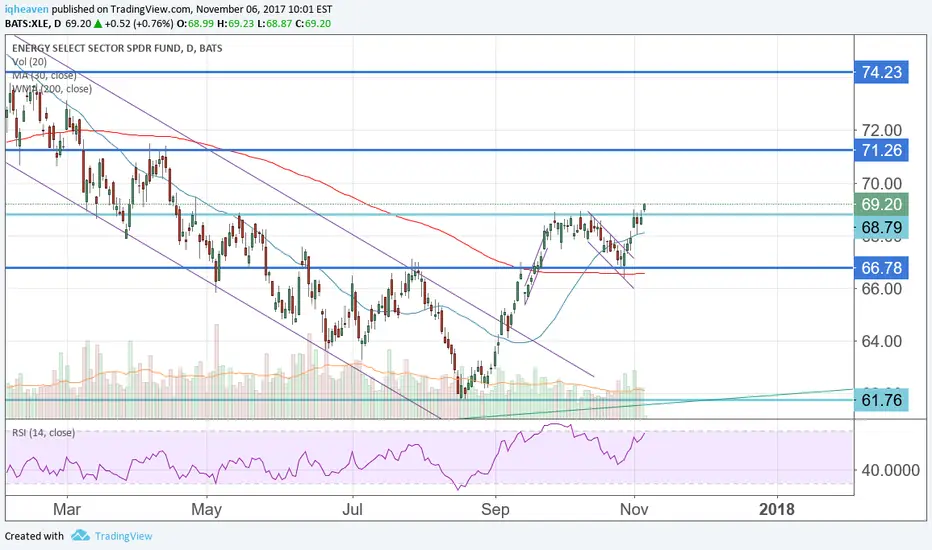
Long XLE & Long Energy for 2018Long term bear flag but it should rally til Q2 or end of 2018 before heading down.
Some other energy names that I longed already broken out to the upside. Energy stocks are going to outperform oil in 2018.


RIGTriple bottom at all time low. Similar pattern to $KOL (coal etf) and steel/mining stocks bottoming last year.


Despite #oil breaking higher, no breakout on #energy ..$XLE still has some work cut out before becoming bullish. $CVX $XOM $OXY $SLB


Long Energy to FinancialsXLE to XLF has done a 78.6% retrace, should at least outperform over the next few years here.


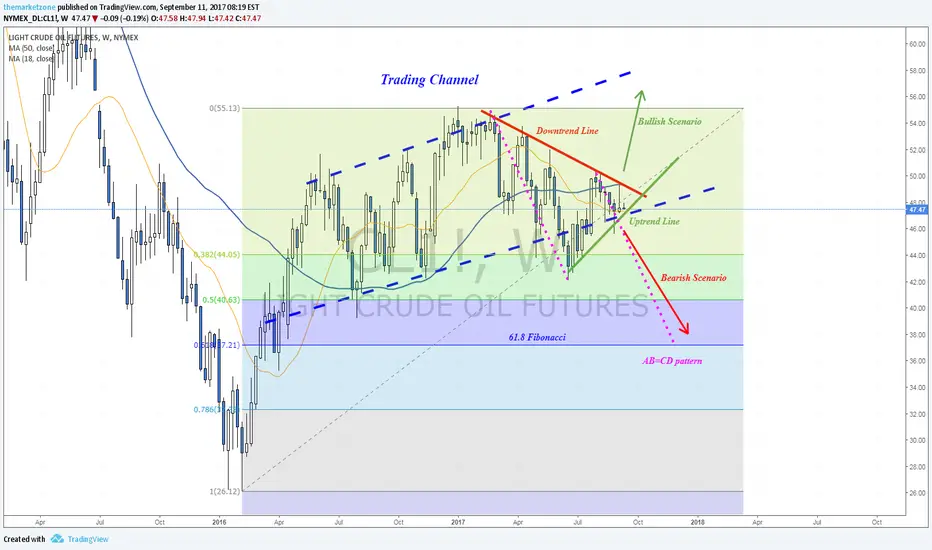
Oil's analysis towards OPEC meeting (September 22nd)Oil is trading inside a weekly trading channel.
The price is testing the bottom of the channel and a weekly uptrend line.
The price was rejected by a weekly downtrend line
Bearish Scenario - In case of a bearish breakdown, Oil can reach to the 61.8 Fib level to complete a bullish AB=CD pattern
Bullish Scenario - In case of a bullish breakout, Oil will probably climb towards the top of the channel.
More analysis? More Trading Scenarios?
@themarketzone on Twitter/Facebook/Instagram


IHS on CrudePotential rally breakout IHS in crude. Normally don't like IHS patterns but this one looks legitimate.


Short option for O&GERF has had a large run up relative to other companies in it's industry. There is a large wick with large volume, this is a sell signal to me. I'd pair this short off with some long XOP but either way I believe it should work.

Head and Shoulders Vs. Bearish BatXLE is slowly making its way towards a very interesting weekly support zone - 60-62$
Notice that this price zone is the 61.8 Fibonacci level from 2009 low and from 2016.
Also notice that it is the neckline of a weekly H&S pattern.
If it will break, XLE can fall to 55$ and maybe even 50$
If it will hold as support, the extremely bullish scenario is that it will climb all the way up to complete a bearish Bat near 95$
Obviously it will have to re-test the MA lines as resistance levels first
Agree or Disagree?
It's Sunday.. you can read more about this setup and others in the newsletter
#WeeklyMarketsAnalysis (search on Twitter)
