XLE and SPX Divergence Predicts Crashes?Whenever the price of XLE and SPX diverge, we seem to get a massive crash.
XLE creeps higher, but SPX makes new lows. Historically, what tends to happen next is that SPX falls off a cliff, as was the case in the 2000 and 2008 bear markets.
Today in 2022, XLE was creeping higher as SPX was making new lows. What happens next?
XLE

Energy XLE idea (29/08/2022)SPDR Select Sector Fund 1H Range In addition rise is expected in the XLE Energy Sector Index, targeting the third wave. Since prices are above the support Prise 70.59 in the long term, and the main support point at prices of 65.48. Currently, we expect the decline to correct since the prices are below 84.56

Energy XLE idea (26/08/2022)SPDR Select Sector Fund 1H Range Further rise is expected in the XLE Energy Sector Index, targeting the third wave. Since prices are above the support point of 70.59, we expect a rise in the near term and also in the long term, and the main support point is at prices of 65.48

8/24/22 OXYOccidental Petroleum Corporation (NYSE:OXY)
Sector: Energy Minerals (Oil & Gas Production)
Market Capitalization: 69.778B
Current Price: $74.91
Breakout price: $75.60
Buy Zone (Top/Bottom Range): $71.55-$65.95
Price Target: $85.50-$86.60
Estimated Duration to Target: 30-33d
Contract of Interest: $OXY 10/21/22 85c
Trade price as of publish date: $2.87/contract

8/24/22 CVXChevron Corporation ( NYSE:CVX )
Sector: Energy Minerals (Integrated Oil )
Market Capitalization: 319.434B
Current Price: $163.19
Breakout price: $164.35
Buy Zone (Top/Bottom Range): $156.20-$146.90
Price Target: $180.00-$182.70
Estimated Duration to Target: 48-50d
Contract of Interest: $CVX 10/21/22 170c
Trade price as of publish date: $5.60/contract

URAs breaking out on volumeUranium miners jumped over short-term resistance this morning (9 & 21 DSMAs). With strong volume at 11 am and support at 200 DSMA having held from two days ago, I'm looking for URA to maybe catch its breath at the 50 DSMA before pushing through and targeting 28 in September.

decision time for OILOil has run into overhead resistance at the 50 DSMA after an impressive 5 day run off the most recent lows. Does it now cower in the wake of a hawkish Powell at Jackson Hole later this week, or does it say Come and Get Me, Big Guy?!

Energy XLE idea (24/08/2022)SPDR Select Sector Fund 1H Range Further rise is expected in the XLE Energy Sector Index, targeting the third wave. Since prices are above the support point of 70.59, we expect a rise in the near term and also in the long term, and the main support point is at prices of 65.48

SPY Weekly review and forecast: August 22, 2022Last week brought the first sell side activity the markets have seen in nearly 6 weeks. The market digested comments within the FED minutes as being dovish, and was on track to extend the rally through most of the week. The tone changed on Thursday and Friday and the market was unable to hold the 4300 level. Most of the selling was precipitated by technology and the financials, while energy finished positive on the week. Volatility has also begun to expand as the VIX finished positive on the week. The weekly expected move in the SPY is also greater than last week's by almost a full point. SKEW closed flat-to-down week over week, but is still in an uptrend.
SPY -1.16% (+/- 8.3)
QQQ -2.28% (+/- 8.89)
IWM -2.85 (+/- 4.97)
____________________
Technology -2.5% (+/- 4.09)
Energy +1.26 (+/- 1.26)
Financials -1.69% (+/- 0.83)
____________________
VIX: +12.19% (23.07; ~50% IV Percentile)
_____________________
The rally we've seen since June has been impressive, so a pull back was going to come eventually. Its important to zoom out and look at the big picture perspective. The market may have re-entered the sideways channel I outlined at the beginning of the month. I'm looking for this week to have a mildly bearish bias, but most probably staying within the expected move in advance of the FED's Jackson Hole meeting (so think between 4150 - 4300 in SPX). I'm going to be keeping a close eye on the Bonds as well as Energy. If the Bonds continue to fall, it will be more fuel on the inflation fire. With regards to energy, stocks like XOM are at key inflection points on their Volume Profiles; selling in energy now would weigh heavily on the indices.

Energy XLE idea (22/08/2022)SPDR Select Sector Fund 1H Range Further rise is expected in the XLE Energy Sector Index, targeting the third wave. Since prices are above the support point of 70.59, we expect a rise in the near term and also in the long term, and the main support point is at prices of 65.48

OXY spiked and started to break outHighlighted previously a couple of weeks ago, OXY just spiked 9.88% on Friday.
The weekly chart shows some consolidation and then a two week bullish candle stack. The MACD crossed over in bullish territory and this bullish run has an upside projection target of >100, a good 30% from last trading close.
The daily chart similarly has technical indicators turning bullish with crossovers in the RPM, and in the MACD.
Clearly bullish... perhaps with some technical retracement, and then a relaunch and then a good break.
Wait and watch for it!
PS. in some ways, I wonder if this remotely has any indication that Crude prices might be spiking soon again... just wondering.

Bear Market - EvidenceThis descending triangle in the most "bullish" of sectors - energy - seems to prove that we are in a bear market. The descending triangle seems to trade with a bearish elliot wave pattern for descending triangles as evidenced here:
thepatternsite.com
Share your thoughts in the comments below.

SPY Weekly review and Forecast: August 8th, 2022This week's action was largely defined by two dynamics: Employment data, and sector rotation.
After initially selling off on Friday after the Employment data drop, the market reversed course and rallied much of the day before ultimately finishing slightly down on the session. Despite trade being predominantly sideways in an 80 point range, the market extended it's rally and finished up on the week. The range was the result of the aforementioned sector rotation. Tech moved into the leadership role as Eneregy, which had been leading the rally, sold off considerably. Stuck in the middle were the financials.
Before looking ahead, here's a snapshot of last weeks numbers, and expected moves for the upcoming week:
SPY +1% (+/- 8.81)
QQQ +2.6% (+/- 9.33)
IWM +2.7% (+/- 4.96)
____________________
Technology +2.8%
Energy -5.1%
Financials +0.8%
____________________
VIX: -0.84% (21.14; ~25% IV Percentile)
____________________
Heading into next week, the market is maintaining a fairly resilient - if not strong posture. There will be a smattering of earnings from small/midsized companies throughout the week, and a potential market moving event with CPI data being released on Wednseday. A natural question to ask is when volatility will find a bottom and make a return. Nevertheless, the market looks posied to finish Q3 strong. I've updated the SPY chart to include an intermediate upside target of 425, which is very much in play heading into September. There is reason to be cautious however, as SKEW is potentially throwing out warning signs as it finished the week with its highest print in nearly 3 months.

Crude Kaput-edSo... Crude appears to have kaput and broke down quite a bit. Changed outlook, and the triangle has been readjusted and immediate target at 84 for the week ahead; and lower to 70 if the downside momentum continues.
With the long weekly candles (momentum), slicing through the weekly 55EMA, breaking down the support ranges, and alignment between the weekly and daily technical indicators; and in addition, a trend change pattern breakdown as well. These, together with this past week's breakdown, and the breakdown of the earlier triangle, more downside can be expected, as far down as 70.
That is what the chart is telling right now...
A very interesting, and admittedly, unexpected outcome for an energy commodity. Perhaps the spectre of a recession is that overwhelming.

USOIL a classic Elliot Flat Correction?USOIL makes what looks like a classic Elliot Flat Correction. But where does it go from here? Is the correction a pause in upward prices? Or is the correction the change in direction from uptrend to downtrend?
Note that the bottom yellow dotted line is the 200day MA area. Haven't even bounced off that yet.

SPX Weekly review and forecast: August 1, 2022Last week, the markets saw a strong move to the upside with the SPX closing just shy of 4150 (4133). The move was largely fueled by FED chair Jerome Powell's comments, as well as strong earnings out of mega market cap stocks such as AAPL and AMZN. AMZN rallied +17.5% on the week and is up a whopping +32% from its low on June 13th. A similar story for AAPL, which is up +8.3% WoW and +25% since June 13. Joining the party, energy stocks like XOM reported very strong profits which vaulted the XLE higher. So far, the primary thesis of a bullish continuation being powered by energy (XLE) and technology (XLK) has come to fruition. The question, of course, is how long it will last - but first, a snapshot of last week's action:
SPX: +5.2%
Nasdaq: +6.8%
Russell: +4.5%
__________________
Technology (XLK): +7.5%
Energy (XLE): +9%
Financials (XLF): +3.9%
Looking ahead to next week, the SPX is poised to retest the price zone between 4100 - 4200 which proved to be considerable resistance back on early June. The probabilities suggest some range bound action here, before the next major move. Needless to say, there's a chance that we could see a forceful continuation, and an even smaller chance of an outright rejection. Regardless, given the improving conditions, 4300 and 4400 are very much in play as potential upside targets heading into Q4.
The expected moves for this week are +/- 81.30 (SPX), 8.81 (QQQ), 4.8 (IWM). The Nasdaq is clearly in the pole position for this rally, and is threatening to push back to 14,000, but with another busy week of earnings, as well as unemployment numbers, and more inflation data, there is still plenty of fuel to spark volatility (which has fallen off a cliff).
Best of luck this week. If you found this helpful, please let me know!

XLE: Commodities short if retestXLE: Commodities short if retest
As usual everything's on the chart. TP is the minimum target.

Looking ahead to next week in the S&P (July 25th, 2022)With things like housing statistics, employment data, and earnings from heavyweights such as GOOG, MSFT, and 3M, next week looks to be filled with potential market moving events. Most notably however is FED Chair Jerome Powell's press conference on Wednesday afternoon. While its no secret that we're headed into a world of higher interest rates, FED speak always has a tendency to move markets one way or another - but before we look ahead, here is a quick snapshot of last weeks action:
S&P500: +2.3%
Nasdaq: +3.3%
Russell: +3.3%
-------------------
Technology (XLK): +6.5%
Energy (XLE): +4.5%
Financials (XLF): +2.3%
Heading into next week, SPY is looking at an expected move of +/- 9.8 on 24%IV ... (QQQ +/- 10.3, 32%IV; IWM +/- 5.6, 30%IV).
SPY appears to be gaining steam on the shorter time frames (4HR, etc.), and I think the sectors driving the rally have more room to run, so my primary idea is for the rally to continue over the intermediate term. There may be some turbulence along the way, so perhaps a retest of the top of the previous range around 390 before ultimately heading toward 415. However, don't ignore the bonds. They have seen a solid rally off their lows in June. If momentum can continue, bond prices could accelerate up to 149"00, which would almost certainly lead to weakness in equities.
Please note: these are not predictions - they are just my ideas about how I'm seeing the markets and are to help me formulate my own trades. If you find this helpful, please consider liking, commenting, following, boosting, baking cookies, setting me up with your single friends, blah blah blah blah...

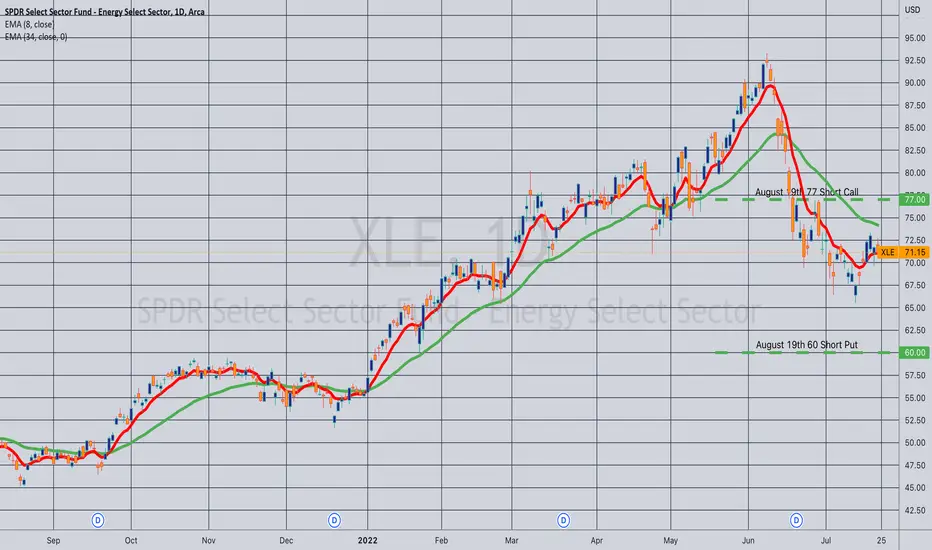
Closed (Margin): XLE August 19th 60/77 Short Strangle... for a 1.39 credit.
Comments: Collected a total of 2.49 in credit with this puppy with minimal fuss/muss. (See Posts Below). Closed today with 28 days to go for a 1.10 ($110) profit, which was basically 50% max of the original setup.
Energy stocks & commodities basing for coming reversal?Using XLE to represent the sector, it appears to be forming a "W" pattern, which could morph into an IH&S reversal pattern, but it still needs a little more time. Green zone is general support, and probable good intermediate term buying opportunity, maybe lasting into the end of the year. Pink boxes are gaps I would expect to be filled before reversal manifests.

OXY - another interesting proposition TAKENOXY was recently highlighted during the recent crude oil ease off retracement. A friend kept talking about it, and new about Berkshire (Buffet) accumulating this stock kept making headlines over the past couple of weeks.
It was in the radar screen as this was something I missed earlier and looked for ward to getting some position as the crude prices should be expected to rocket higher. So, as Crude bounced off the support level (in the other post), the daily chart was tracked for a possible entry.
Compared to SOXL, this was not as pretty, but it would do for now.
Support held, bounced off, technicals on the daily were supportive of a bullish rally, Crude oil just bounced, and overall this was considered a low risk entry, so a position was taken (white arrow).
Currently is resistance zone.
Let's see if it has the resolve to break above... it should.

Oil Though (comedy)Had an energy long last week, closed this afternoon. Little bit of humor on the roll here.
Maybe this is a good lesson in trading commodity linked equities and the volatility of contract turnover in a tight market, we'll see how this impacts the likes of XLE tomorrow.

Possible price paths for SPY over the next 4 - 8 weeks (2022)Forecast ideas for the week of July 18th, 2022
Here are my thoughts about where the market may be heading over the short-to-intermediate term, and how it may get there...
After selling off most of last week, the S&P has rallied about +4% off the July 14th lows. The rally was propelled mainly by tech stocks like AAPL and QCOM, as well as financials like MS and BAC. Despite this impressive move, the market has been stuck in a rather precarious 250 point range for about a month.
Another interesting sector has been the XLE (energy). It has seen spectacular moves in both directions, and is currently down about -30% off its June highs. However, XLE looks like its showing signs of a dead cat bounce. If this occurs, it would carry the S&P with it.
Heading into next week, I'll be watching XLE closely - and possibly shopping for some swing trades to the long side. As of now, I think the bullish pathways have a slightly greater probability of being realized over the next 1-3 weeks (referring to the break of the range), but I am lightly allocated, and very much in a "wait and watch" mode. If the market breaks the range to the downside (below 375), volatility and SKEW have nowhere it could but up, so get very ugly, very quickly.
Note that the pathways aren't predictions. They are just general, hypothetical guidelines. The price points are more important to the overall narrative. Good luck; lets see how it goes!
