Bearish XLFI may regret this, but damn does this look pig look ugly. There's a lot of Trump brand lipstick on it don't get me wrong, but this rally is just too far for me not to take a stab.
XLF

S&P 500 Index @ 1h Chart @ incl. XLF & XLE since Trump ElectionPerformance of the SPX, XLF & XLE - end of last month (November`16)
closed by 2034.5 SPX (round about +8,08% this Year & -1,505% year to year Nov`15 until Nov`16)
closed by 18.95 XLF (round about +18,79% this Year & 13,63% year to year Nov`15 until Nov`16)
closed by 60.16 XLE (round about +23,72% this Year & -6,752% year to year Nov`15 until Nov`16)
Both sectors had the worst performance the last years, while Obamas presidents time.
Aftermath is all clear, i also didn`t except an outbreak like this. But since this month - i am prefering to see the lows in some shares (even of both sectors) as an buying oppurtunity. Why ??? Let it me so explain ... Under president Trump i can`t imagine that our new president will make policy against both sectors - even forcing laws to shoot their expansion ambitions down. "The Occupy WallStreet Movement was aftermath the all-time high of all anti WallStreet Americans - in the review even maybe the bing gang of make american great again - from the top to the button ... even from wallstreet to every american consumer and tax payer"
How ever,
i am not an political analysis or even expert - but the chart is speaking fo itself.
From this point of views i am prefering the US Yields (Gold as hedge is useless), US Equities & even some sectors (even like Energy & Financials).
Take care
& analyzed it again
- it`s always your decission ...
(for a bigger picture zoom the chart)
Best regards
Aaron


Weekly Spread Ideas - 2016/11/28I'm going to start doing weekly price targets for a select few market sector ETFs each week.
Here are this weeks targets:
SPY: 220 ~ 225
XLF: 22.3 ~ 23.2
XLE: 72 ~ 75
XLV: 68.5 ~ 71.1
XLRE: 28 ~ 30.4
XLI: 60 ~ 63.7

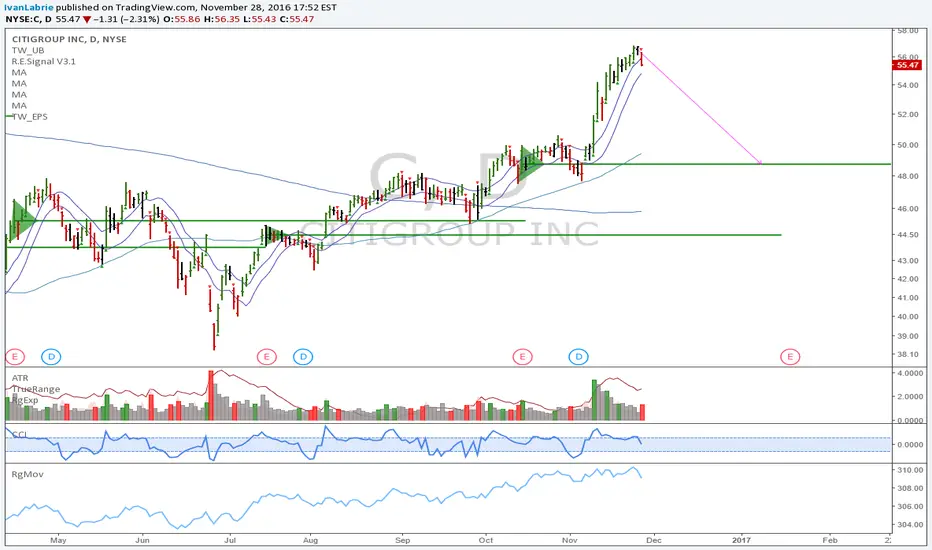
C: Systemic risk, extremely overboughtCitigroup shares might be poised for a retracement here, we can expect a selloff to take place, if we don't move back above 56.78. I'd reccomend either shorting it, or buying puts. You can buy out of the money puts and sell bear put spreads to reduce costs (vs buying at the money puts).
Good luck,
Ivan Labrie.
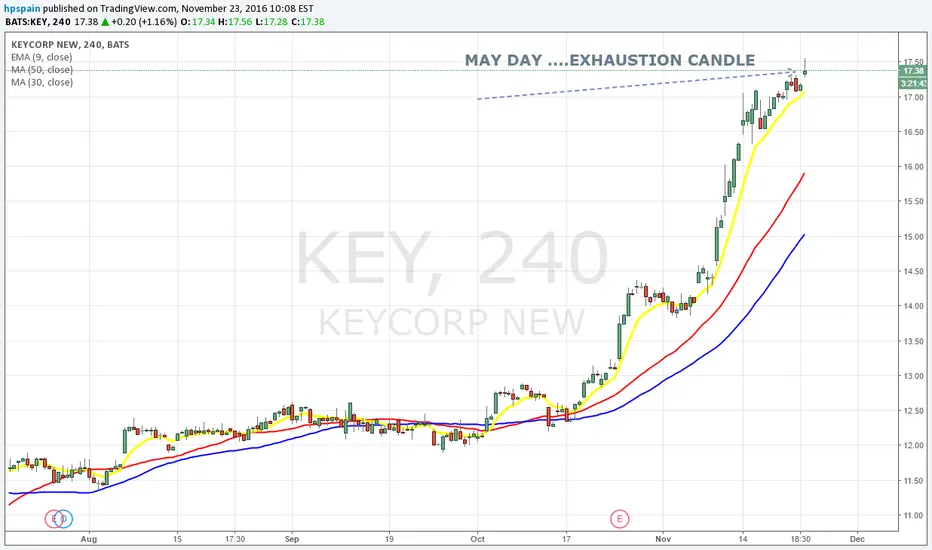
SAY Goodbye to KEYCORP LONG, Time FOR BEARSALL IN SHORTING KEYCORP
Exhaustion Candle at the top
Company is QUOTING 7 x Price To SALES¡
ABERRATION ENDS TODAY


SPY 11/04 SUB $209New down trend with black line as resistance line. Still it's down slope. Solid green line is still acting as support line but once it breaks after 11/04 we can go short fully. Looks like start of a new bear market.

YELP 3 HR CHARTwww.fool.com
yelp is a short candidature despite today's bounce up. Yelp is playing a triangle on minor degree. Its called dead cat bounce.

FIT BIT 30 min chartFITBIT LONG TERM CHART
GAP @ $16.60
GAP @ $15.70
Those gaps needs to fill. Plus green solid line is acting as support and also it broke the red bear line. So FIT is a buy.
FIT will go down a bit more like $12.06 and then it will be a buy for till it reaches $16.00 ish to fill the gap.

SPY ELECTION UPDATESPY ELECTION UPDATE:
SPY Still trading between red resistance line and the dotted black support line. Even though it tried to break several times the black line but slowly and surely its going down and will breach soon.
SPY upper limit is $214.71 and lower limit is $185.20 (even though it may not reach on pre/post election but the hype will be there)

QQQ HOURLY CHART ELETION UPDATEQQQ HOURLY CHART ELETION UPDATE:
Upper limit is $119.72 and lower limit is 109.12. Unlike SPY QQQ is very strong and doesn't show weakness sign yet in the price chart but technical are weak though. Need good options strategy heavy on the short side and less on the bull side. But looks like it will move either way in pre/post election days.

SPYSPY started going downhill from Aug 15 anyway. Even almost before 3 months. So don't blame election, or Billary or the elephant if stocks tank. It also broke the light green support trend line from 2016 Feb 11th after 2016 oct 13th on multiple occasions.

TDwww.bloomberg.com
TD Bank is same as AMTD. Td bought SCOTTRADE BANK but it will not help them to sustain as the stock already started to fall from 2014 April. The red line will act as a resistance. And the green line as support.

AMTDwww.bloomberg.com
AMTD still a short candidate. Nothing changed from the chart I published few months back. Just trading a triangle pattern between red and green line. Next support it @ $20ish.
Buying Scottrade will not help them in long term.

ELECTION SPY RANGE $214.71-$209.19***NOTE*** NOTHING HAS CHANGED FROM MY PREVIOUS CAHRT; SPY STILL RANGE TRADING BETWEEN THE RED LINE AND TWO BLACK LINES. CHOPPY SLOW MUSHY RANGE TRADING BUT BECAREFUL!!!
UPDATES:
ELECTION SPY RANGE $214.71-$209.19.
The upper limit is $214.71 and lower limit is $290.19. It will trade both ways on pre & post election so LODS of MULA u can make it by rolling out effective options strategy.
The thing is if it hits $209 range; that means new BREA MARKET is here. Doesn't matter who is the President a Bitch or a Elephant. Because in a greater weekly chart it will create a new trend line. And then Dotted black line will act as a resistance.

TIMES WARNERTWX TIMES WARNER IS A GOOD CANDIDATE to short. it is paying inside the triangle pattern and reached the upper red resistance line which means perfect time to go short. There are 3 support line. Dotted light green line, Solid light green line and solid deep green line.
Each of them breaks means Time for times warner to say bye bye.
www.washingtonpost.com

AT&Twww.washingtonpost.com
***WEEKLY CHART***
BUY FOR NOW (TEMP):On daily chart ATT is a buy as it is hitting the LIGHT green support line from 2015 Aug low.
SHORT (IN WEEKLY CHART). The upper limit is Two red lines Dotted one and solid one. Once it touches those lines re-evaluate the situation and then you CAN GO SHORT. The support line will be on weekly chart is from 1984 low the SOLID DEEP GREEN LINE AROUND $25-$30 ZONE.

SPX POST ELECTIONPlease look at the channel between Solid RED line and Solid Green line. The blue line is a temporary support.

SPY ELECTION TRADING*** 4 HOURS ONLY ****
You need a good option strategy. See the RED solid line and the Black solid line. that's is your range. RED SOLID LINE IS RESIATNCE LINE AND BLACK LINE IS SUPPORT. BUT ALSO BLUE LINE WILL ACT AS SUPPORT TOO.
FOR LONG STRATEGY:
If SPY breaks the solid red line then goes up then it will re-test the upper black dotted line first and then come down to re-test the red line for long strategy. once IT TOUCHES OR RE-TEST U CAN BE BIT SAFE TO GO LONG BUT NOT NOW.

SPX TRADING ZONE**** 4 HR chart only****
SPX is going to trade in a zone. You can expect trading options strategies for sidewise choppy trading. The zones are RED solid line and Black support zone. If black support line breaks then you can go SHORT.
