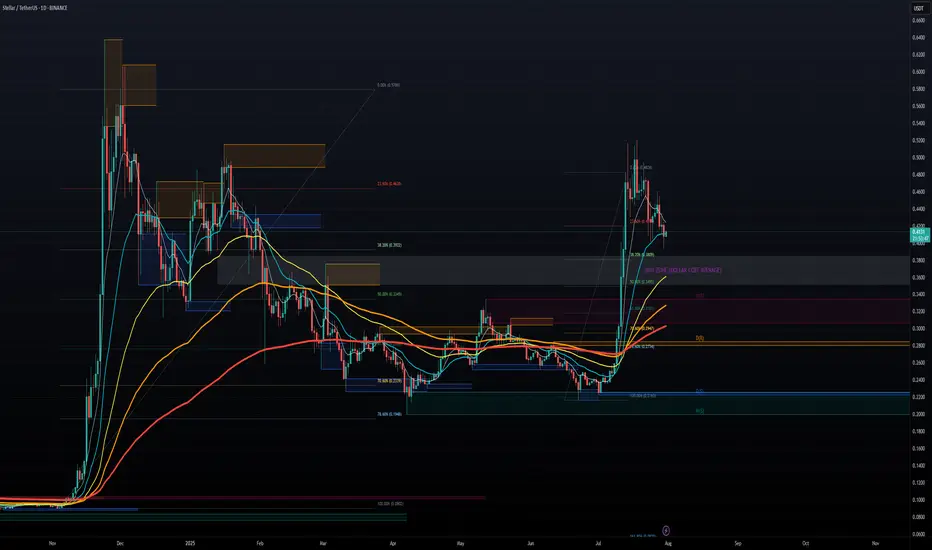
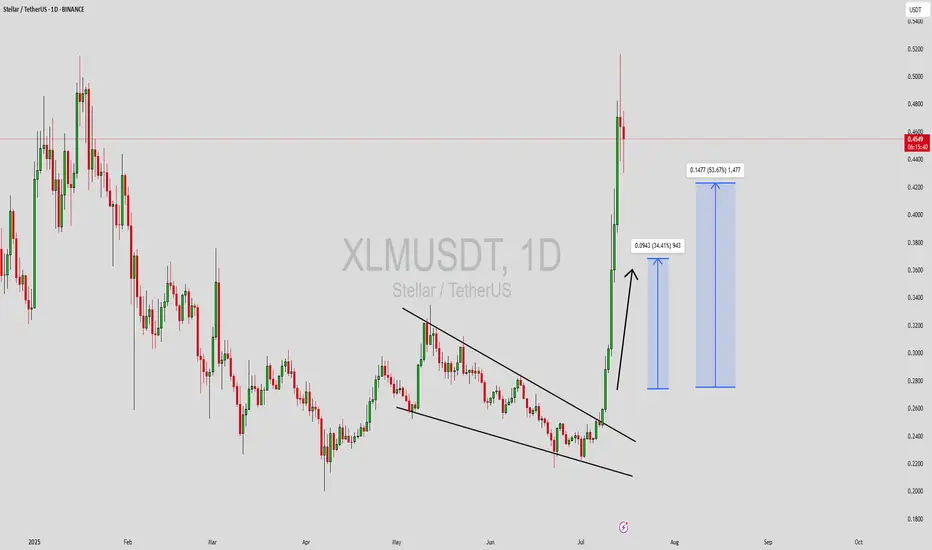
Xlm -Just hit my T2 target7/23- My first post
-Xlm was $.42
7/24- T2 (top of range) hit $.4
7/27-Pumped 15%
as anticipated
8/1 -T2 bottom Hit (WT)
Could go lower and hit WT Low...
But I love it when a plan comes together.
I hope my T3 doesn't get hit (after this bounce).
May the trends be with you.
XLM

XLM To $0.74I'm looking for XLM to continue to the downside followed by a move up. I will place a buy at the 50% fib level or in between the 50% and 61.8.

STELLAR LUMENS - DOLLAR COST AVERAGE FOR LONG TERM GAINSSTELLAR LUMENS (XLM) has taken off late 2024 from under .10 cents and now trading at .40 cents for a 400% Gain in 6 months so far, and there is much more upside to come potentially. It hit all time highs around .50 cents and now the token seems to want to test those highs in the near term 2025, we can easily see XLM approach $1.00 towards 2026 for a 100% gain and even higher longer term. Overall, XLM moves with XRP and we all know XRP is a blue chip project, it has all the funds and institutional backing, and so does XLM.
Both projects share a common creator in Jed McCaleb, however they have different focuses. Ripple, and its native token XRP, was initially designed to facilitate cross-border payments for financial institutions. Stellar, on the other hand, focuses on financial inclusion and aims to provide accessible financial services for individuals, including remittances and access to banking services.
CAN WE SAY BULLISH?! TO THE MOON!!!
XLMUSDT – Accumulation Phase or the Start of a Major Breakout?🔍 Market Overview:
Stellar (XLM) against USDT is showing a technically significant structure. After breaking above a long-standing consolidation zone, price is now in a mild corrective phase, retesting previous resistance as new support. This setup suggests a critical decision point — will XLM confirm a bullish continuation, or was it a false breakout before further decline?
---
📌 Key Price Levels:
✅ Strong Demand Zone (Historical Support + Fibonacci Confluence)
XLM recently surged from the zone between $0.32972–$0.36213, which coincides with:
Fibonacci retracement levels: 0.5 (0.36213) & 0.618 (0.32972) from the recent swing low
A multi-tested support/resistance zone, now acting as a major demand area
This zone is currently the most critical support region for bulls to defend.
❌ Layered Resistance Zones (Bullish Targets Ahead)
If upward momentum resumes, watch these key resistance levels:
0.45207 → Nearest resistance
0.50470 → Structural resistance
0.56108 → Mid-range psychological barrier
0.60000 → Historical resistance zone
0.63440 → Medium-term technical target
0.63724 → Local swing high
---
📈 Bullish Scenario:
> "As long as price holds above the demand zone without printing lower lows, the bullish bias remains valid."
1. Bullish continuation confirmed with a daily close above $0.45207, ideally supported by strong volume.
2. A bullish continuation pattern (e.g., flag or pennant) may be forming.
3. Short-term targets extend to $0.50470–$0.56108, with a mid-term outlook toward $0.63+.
4. Macro sentiment or altcoin market momentum could act as a breakout catalyst.
---
📉 Bearish Scenario:
> "A breakdown below the demand zone could trigger a bearish trend reversal."
1. Failure to hold $0.42 could trigger a deeper pullback to $0.36–$0.33 zone.
2. A confirmed breakdown below $0.32972 (Fibo 0.618) invalidates bullish structure, possibly starting a new downtrend (Lower Lows).
3. Watch for potential bearish divergence if price gets rejected around $0.45–$0.50 area.
---
📐 Chart Pattern & Market Structure:
Currently showing a developing Higher High & Higher Low (HH-HL) structure — a sign of early trend reversal.
Price may be forming a Bullish Rectangle or Ascending Triangle, depending on future break direction.
This pullback appears to be a healthy retest, not a trend reversal (yet).
---
🧠 Strategy & Trader Insights:
Swing traders may look to enter near $0.36–$0.38, with tight stops below $0.32.
Breakout traders should wait for a clear breakout and close above $0.45207 before entering.
Avoid chasing trades in the middle of the range — wait for confirmation or rejection at key levels.
---
💬 Final Thoughts:
This is a high-potential setup for XLM, provided the current support structure holds. The demand zone is acting as a critical foundation for any bullish continuation. However, risk management is essential as the market approaches a key decision point.
#XLMUSDT #Stellar #CryptoAnalysis #AltcoinSeason #PriceAction #SupportResistance #TechnicalAnalysis #FibonacciLevels #BreakoutSetup

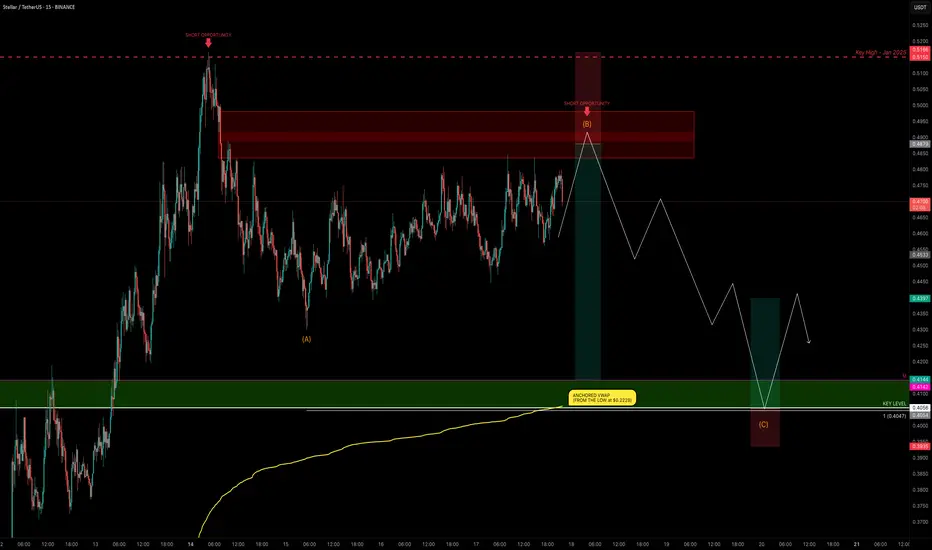
XLM Explodes +132% — Is the Party Over or Just Starting?XLM has been one of the top movers, sweeping the January 2025 swing high at $0.515 before stalling and moving sideways for the past 4 days.
Is XLM gearing up for another push toward the highs, or is a correction imminent?
Let’s dive into the details.
🧩 Market Structure & Fractal Pattern
XLM skyrocketed +132% in just 13 days, mirroring the explosive move seen back in November 2024.
If we apply the November fractal, the current price action suggests we could be setting up for an ABC corrective move.
📉 Key Levels & Confluences
FVG Zone: ~$0.49–$0.50 — likely to be swept before any major move down.
Monthly Support: $0.4142
Key Level / Liquidity Pool: $0.4056 — likely cluster of stop-losses.
Anchored VWAP (from $0.2228 start of trend): currently near $0.4056, adding strong confluence.
1.0 Trend-Based Fib Extension (ABC projection): If price pushes to ~$0.49 to complete wave B, the projected 1.0 TBFE for wave C lands right on the $0.4056 key level + VWAP, creating a perfect confluence zone.
➡️ Conclusion: The $0.4142–$0.4056 zone is a critical support and liquidity area with multiple confluences lining up.
Trade Setups
🔴 Short Setup:
Entry zone: $0.48–$0.50 (ladder in)
Stop-loss: Above $0.5166 (prior high)
Take-profit: $0.4142–$0.4056 zone
R:R ≈ 1:3
🟢 Long Setup:
Entry zone: $0.4142–$0.4056 (preferably near VWAP)
Stop-loss: Below $0.395
Take-profit: $0.44
⚡ Final Thoughts
Watch for a potential final push toward $0.49–$0.50 before a corrective wave unfolds.
The confluence at the $0.4142–$0.4056 zone — including monthly/weekly levels, VWAP, liquidity pool, and the 1.0 TBFE target — makes it a key area for decision-making.
Stay patient and wait for confirmation at these levels. Will post an update as things unfold!
_________________________________
💬 If you found this helpful, drop a like and comment!
Want breakdowns of other charts? Leave your requests below.
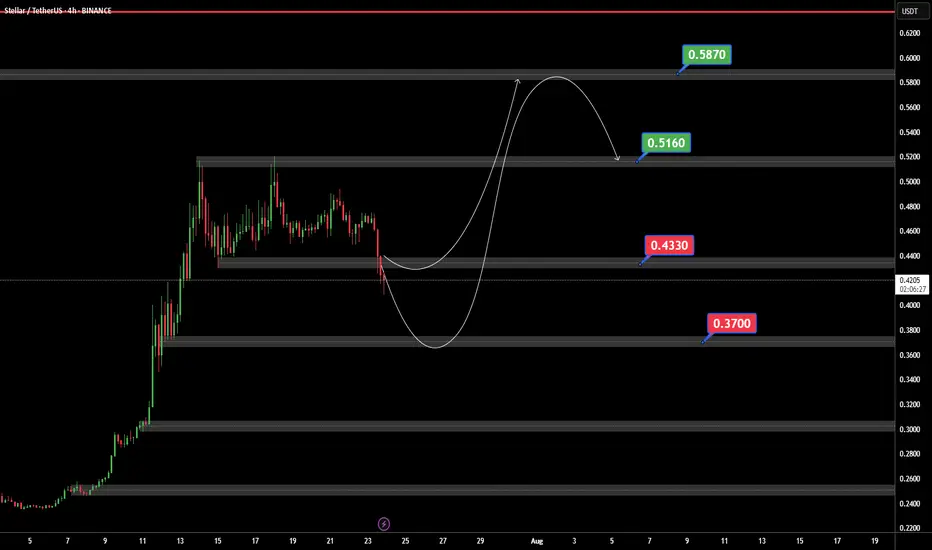
XLMUSDTIf BINANCE:XLMUSDT can support 0.4430 $ ready for jump to 0.5160 and best target in 0.5873 $.
But if XLM can price breaked 0.4330$ support we ready for a bear trend.
XLM/USD XLM is showing one of the strongest bullish setups right now.
A macro “Cup”, with a smaller “Cup with Handle” forming inside it — a powerful setup often leading to parabolic breakouts.
Before a true breakout, price may fake out to the downside, trapping longs.
This is classic market maker behavior — shakeouts followed by strong reversal and breakout. Stay focused on the reaction around yellow zone.
Currently in the final stages of the “handle” formation.
A breakout may confirm a move toward $4

Stellar Sitting Mid-Range — Patience Before the Pop?XLM has been stuck in a defined range, with both the top and bottom holding multiple times. Stoch RSI is resetting, and price is nearing the midpoint again. Breakouts from ranges like this often come when traders get bored — stay alert.

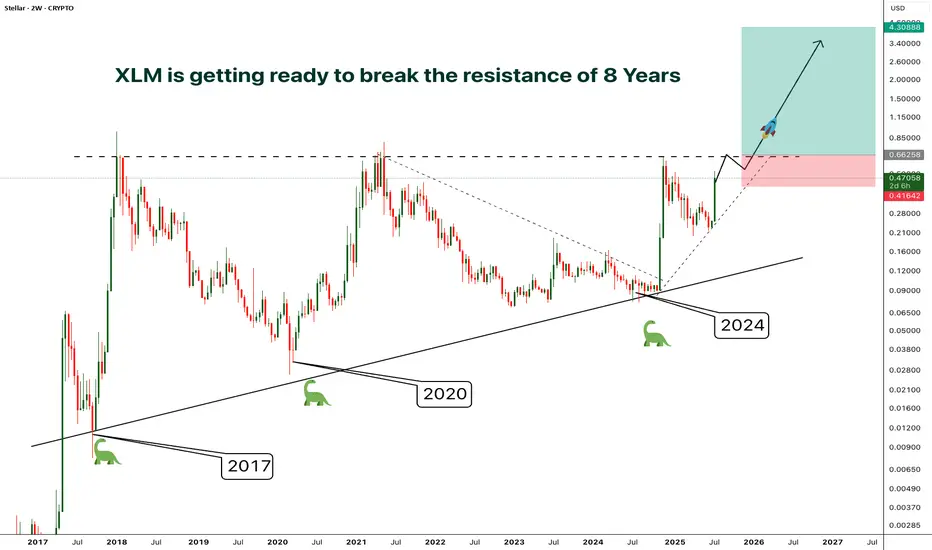
XLM - Resistance/Consolidation of 8 Years- Finally after 8 years of consolidation and getting rejected by the resistance at the same level around 0.65, XLM is preparing to break out from the almost decade old resistance
- A clear breakout from this resistance will phenomenal
- The price surge after the breakout will be unlike anything you've ever seen.
- I'm planning to enter after a confirmed breakout, entry before the breakout will be risky in case if the price gets rejected again.
Entry Price: Candle closeAbove 0.65
Stop Loss: Below 0.41
TP1: 0.88574
TP2: 1.21012
TP3: 1.92545
TP4: 2.68849
TP5: 4.27772
Don't forget to keep stoploss
Cheers
GreenCrypto
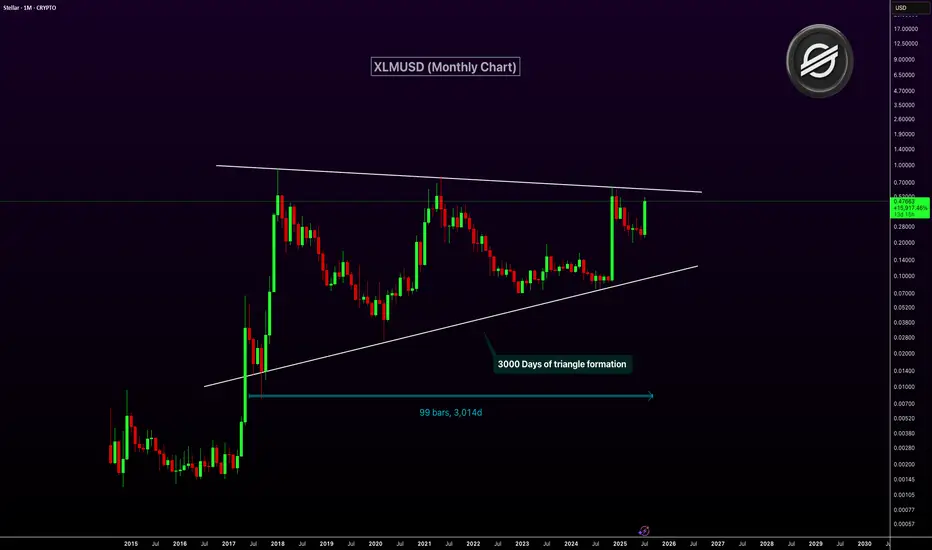
XLMUSD Nearing Breakout After 3,000-Day Triangle FormationXLM has been consolidating inside a massive symmetrical triangle for over 3,000 days. This long-term pattern on the monthly chart dates back to 2017. The price is now approaching the upper resistance trendline of the triangle. A breakout from this structure could ignite a major bullish rally.
The current monthly candle shows strong momentum with over 100% gains. A confirmed breakout above resistance could mark the start of a macro uptrend. This triangle is one of the most significant technical setups in XLM’s history.
Target 1: $1.00
Target 2: $2.50
Target 3: $5.00
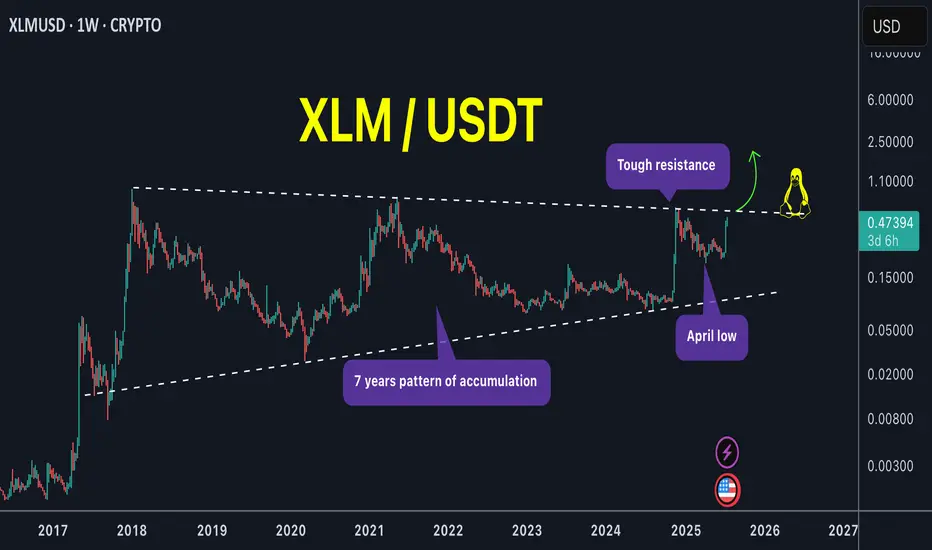
XLM is the pump over or just getting started !XLM / USDT
What a huge weekly candle! We catched its strong move very early around 0.29$ a week ago (75% profits locked in spot)
With a zoom out chart we can see price is setting up nicely with several tests of pattern boundary. Next test of the upper boundary can lead to huge breakout of this mega pattern !
NOTE: Price must not close below april low and should close above upper boundary unless that its just a range
Keep an eye on it closely !
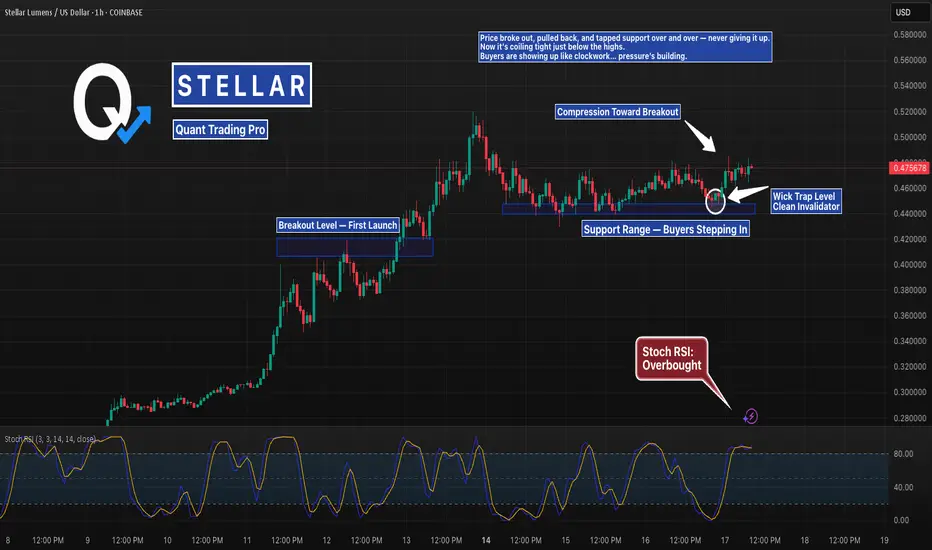
XLM Coiling at the Highs After Holding Support PerfectlyStellar broke out, then printed the cleanest support range you’ll find.
Wicks into demand, fast rejections, and now it’s compressing just under resistance.
If it breaks from here, there’s room to stretch.
But don’t forget — the longer it coils, the harder it snaps.
#XLM #StellarLumens #XLMUSD #SupportAndResistance #BreakoutSetup #CryptoCharts #TradingView #QuantTradingPro #BacktestEverything
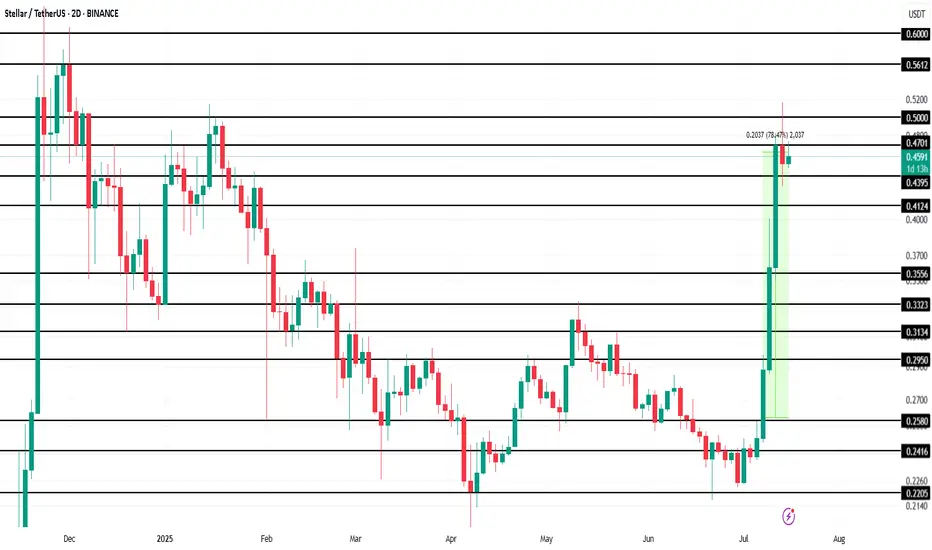
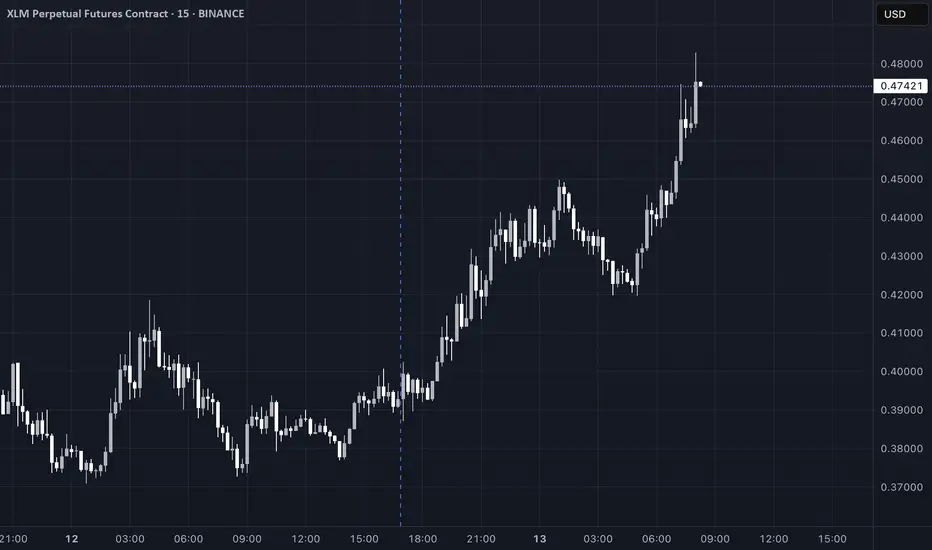
Stellar (XLM) Makes History Amid 78% Price Surge This WeekBINANCE:XLMUSDT is currently trading at $0.46, up 78.5% over the past week . However, the altcoin faces resistance at $0.47, a level it has struggled to breach in recent days. The ability to break this resistance is crucial for continued growth, as it will determine whether XLM can push higher.
BINANCE:XLMUSDT futures market activity has also surged, with Futures Open Interest hitting an all-time high of $520 million in the last 24 hours. This indicates that traders are increasingly interested in the asset's derivatives, which are capitalizing on its rise.
Given the strong sentiment from futures traders and the technical indicators, it is likely that BINANCE:XLMUSDT will push past the $0.47 resistance and target $0.50 in the coming days . A successful breakthrough could lead XLM toward its next target at $0.56, marking an eight-month high. This would signify continued strength for the asset.
However, if the broader market sentiment shifts or investors begin to sell their holdings, BINANCE:XLMUSDT could face a significant pullback. If the price falls below the key support levels of $0.43 and $0.41 , it could slide further to $0.35, which would invalidate the current bullish outlook.
XLMUSDT Forming Falling WedgeXLMUSDT (Stellar) has recently delivered an impressive breakout from a prolonged downtrend, indicating strong bullish momentum following the completion of a falling wedge pattern. This pattern, known for its high probability of signaling a bullish reversal, was confirmed as price exploded upward with increasing volume — a textbook breakout scenario. After a period of consolidation, Stellar surged sharply, catching the attention of both technical analysts and long-term investors.
Volume is playing a key role in this rally. The sharp rise in buying pressure is a strong sign that institutional and retail investors are accumulating XLM, possibly in anticipation of a sustained move. The breakout zone now acts as a major support area, and we may see price revisit this level briefly before resuming its next upward leg. If the bullish sentiment continues, we can expect gains in the range of 40% to 50%+ from current levels, with strong momentum and follow-through likely in the short term.
The broader sentiment around Stellar has been improving as well, with increased interest in its blockchain utility, particularly in the cross-border payments space. As investor confidence builds and momentum traders join in, the probability of another leg higher strengthens. Technical setups like this, combined with solid fundamentals and growing on-chain adoption, provide compelling opportunities in a recovering market.
✅ Show your support by hitting the like button and
✅ Leaving a comment below! (What is You opinion about this Coin)
Your feedback and engagement keep me inspired to share more insightful market analysis with you!
Stellar XLM price analysisToday, the price of CRYPTOCAP:XLM rose quite dramatically, doing so at a critically important moment, but trading volumes are slightly insufficient for final confirmation.
Now let's look at what we wrote for the OKX:XLMUSDT chart four months ago: “It would be ‘right’ to test $0.19-0.20 before the start of strong growth.”
👆
The minimum was $0.19976 — do we "check" and "done" that?
📈 If so, then the price of #XLM should not fall below $0.226 anymore.
And ahead lies only growth in the price of the #Stellar token to at least $0.50, or even $0.60.
🏆 Well, and about the global goal for #XLMUSD we wrote in the previous idea — read, analyze, and turn information into profit!
_____________________
Did you like our analysis? Leave a comment, like, and follow to get more

XLM/USDT;FREE SIGNALHello friends🙌
Given the good price growth, you can see that the price has entered a channel, which has caused the price to form a flag...
Now, with a strong channel breakdown by buyers and their entry, you can enter the trade with risk and capital management and move with it to the specified targets.
🔥Join us for more signals🔥
*Trade safely with us*

XLM Crypto Analysis Summary (2025-07-13)XLM Crypto Analysis Summary (2025-07-13)
Comprehensive Summary of Each Model's Key Points
Grok/xAI Report
Technical Analysis: Current price at $0.47, significantly above all moving averages, indicating a short-term uptrend but overbought conditions as indicated by an RSI of 89.93. Price is outside Bollinger Bands, signaling a likely correction. Market Sentiment: Positive sentiment due to altcoin rallies, but technical overextension suggests potential for profit-taking. Conclusion: Modestly bearish outlook with a strong probability (>70%) of a pullback. Recommend entering a short position at $0.47 with a stop-loss at $0.50 and take profit at $0.40. Claude/Anthropic Report
Technical Analysis: Similar findings with price at $0.47, overbought RSI (89.93), and significant distance from the upper Bollinger Band at $0.40 highlighting significant risk of pullback. Market Sentiment: Euphoric sentiment but warns of imminent reversals due to overextension. Conclusion: Aimed for a short position as well but with a different target and stop-loss placement. Proposes entry at $0.47, stop-loss at $0.52, and take-profit at $0.38. Gemini/Google Report
Technical Analysis: Affirms the bullish trend due to price above all MAs but highlights overbought RSI and Bollinger Bands indicating a need for caution. Market Sentiment: Positive altcoin movement correlating with Bitcoin, suggesting potential for continued growth but also warns of speculative dynamics. Conclusion: Encourages waiting for a pullback to $0.40 for a long entry. Proposed stop-loss at $0.38 and take-profit at $0.50, though leaning towards caution. DeepSeek Report
Technical Analysis: Price maintains a position significantly above moving averages, and the high RSI and Bollinger Band readings indicate potential price reversion. Market Sentiment: Euphoric market sentiment, though devoid of fundamental backing. Warns of the "dumb money" effect. Conclusion: Strongly bearish for shorting at $0.47, with a risk/reward ratio emphasizing potential gains from a mean reversion. Llama/Meta Report
Technical Analysis: Confirms high prices and overbought conditions similar to others, but suggests a cautiously optimistic bullish outlook. Market Sentiment: Positive sentiment detected, yet overbought conditions imply revisiting support before new longs are advisable. Conclusion: Proposes a long trade if a pullback to $0.40 occurs, but acknowledges an overall risk assessment opposing current long entries.
Areas of Agreement and Disagreement
Agreement:
All reports recognize the overbought conditions based on an RSI above 89 and significant price movements above key moving averages. Each model finishes with a recommendation for a bearish or cautious position acknowledging the likely impending correction. Disagreement:
The nature of the recommended trade (short vs. long) varies; Grok, Claude, and DeepSeek recommend shorting, whereas Gemini advocates waiting for a long position upon a pullback, and Llama suggests a similar cautious long entry. The specifics of stop-loss and take-profit levels also vary across reports, reflecting differences in perceived market volatility and risk management style.
Conclusion
Overall Market Direction Consensus: The market is broadly seen as moderately bearish due to extreme overbought conditions, despite the bullish price trends observed.
Recommended Trade:
Trade Direction: Short Entry Price: $0.47 Stop Loss Level: $0.50 Take Profit Level: $0.40 Position Size Recommendation: 1 lot (approximately 2,128 XLM contracts at 50x leverage, given a $10,000 account). Adjust based on personal risk tolerance. Confidence Level in Recommendation: 70% Key Risks and Considerations: Potential continued upward momentum due to market sentiment, volatility causing sharp movements, and correlation with major cryptocurrencies like Bitcoin. Strong monitoring during trade execution due to high slippage risk. Trade Entry Timing: Enter at market open.
TRADE_DETAILS (JSON Format) { "instrument": "XLM", "direction": "short", "entry_price": 0.47, "stop_loss": 0.50, "take_profit": 0.40, "size": 1, "confidence": 0.70, "entry_timing": "market_open" }
📊 TRADE DETAILS 📊 🎯 Instrument: XLM 📉 Direction: SHORT 💰 Entry Price: 0.47 🛑 Stop Loss: 0.5 🎯 Take Profit: 0.4 📊 Size: 1 💪 Confidence: 70% ⏰ Entry Timing: market_open
Disclaimer: This newsletter is not trading or investment advice but for general informational purposes only. This newsletter represents my personal opinions based on proprietary research which I am sharing publicly as my personal blog. Futures, stocks, and options trading of any kind involves a lot of risk. No guarantee of any profit whatsoever is made. In fact, you may lose everything you have. So be very careful. I guarantee no profit whatsoever, You assume the entire cost and risk of any trading or investing activities you choose to undertake. You are solely responsible for making your own investment decisions. Owners/authors of this newsletter, its representatives, its principals, its moderators, and its members, are NOT registered as securities broker-dealers or investment advisors either with the U.S. Securities and Exchange Commission, CFTC, or with any other securities/regulatory authority. Consult with a registered investment advisor, broker-dealer, and/or financial advisor. By reading and using this newsletter or any of my publications, you are agreeing to these terms. Any screenshots used here are courtesy of TradingView. I am just an end user with no affiliations with them. Information and quotes shared in this blog can be 100% wrong. Markets are risky and can go to 0 at any time. Furthermore, you will not share or copy any content in this blog as it is the authors' IP. By reading this blog, you accept these terms of conditions and acknowledge I am sharing this blog as my personal trading journal, nothing more.
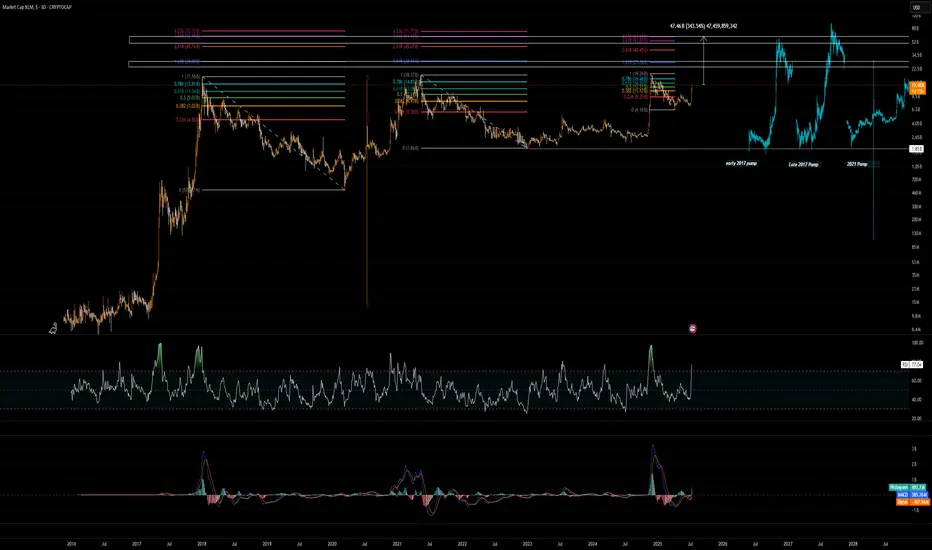
XLM potentialXLM shows a great performance this cycle so far and it finally show some independency from XRP and lead without XRP getting pump.
Some might think it will go for ever, I am sorry to break your heart it won't be more than $70B market cap. best case scenarios.
Around $15B to $19B there will the first resistance.
1.618 fib in all timeframes will be the next, which will be $20B - $28 Market cap I think safe bet for final exit will be $53B market cap which is 350% from here.
XLMUSD inv h&s at the threshold of the necklineNo confirmation yet but market currently feeling very bullish here. Likely to breach this neckline in the next few candles. *not financial advice*

XLMBTC To Enter Its Biggest Bull Market Ever · 4,855% In 2017Stellar. No bull market vs Bitcoin in 2021. You know what this means? We are due an ultra-strong bull market for XLMBTC in 2025 (and beyond).
The 2017 bull market lasted 308 days. Total growth reached 4,855% within this period. The bear market that followed was brutal. From January 2018 until November 2024. A total of 2,499 days of bearish action.
A bottom was hit 4-November 2024 and the proceeding week we saw a major advance. This was a 400% bullish wave. Now this wave is over with a correction and the correction ended in a classic higher low. This week we have a new bullish breakout and this is the continuation of the uptrend, the first time XLMBTC goes bullish since 2017. It seems this pair will continue bullish even after Bitcoin peaks. Who knows, maybe even years going up.
The chart is solid and supports additional growth. We are due a strong rise, the biggest ever for this pair.
Thank you for reading.
Namaste.

#XLM/USD - SHORTI won't specify the timing and goals here, but I think it's enough to take precautions and avoid becoming food.
At this stage, there is a hidden bearish divergence and a global extended bearish divergence, and neither of them has even started to develop.
At this stage, the decline is caused by approximately 7 factors, one of which is the Gartley butterfly pattern.
I'm sure no one on the Internet has noticed that the asset has no bullish factors for growth, but there are many bearish factors.
The ratio is:
11 bears vs 0 bulls.
(I have provided 2 out of 11)
If anyone has any bullish factors that they have heard of or know about, please let me know in the comments, but please avoid using hamster triangles or anything similar, as it does not make sense in this game.
(Not an investment recommendation).

Stellar Lumens Looks Ready for Blast-Off!There is a very similar trend happening with the technology of the internet and computing as what we’re seeing now with AI and crypto. The early accumulation cycle for Nvidia would have shaken out many investors simply because of how long it took before going parabolic. Stellar Lumens is showing the same pattern—but the wait could be over. I see a large parabolic run coming for Stellar Lumens very soon, one that could take us to new all-time highs and spark a mass adoption cycle similar to what happened with internet and computing technology.
As always, stay profitable.
- Dalin Anderson

XLM – Bottom In, Eyes on $1+
XLM looks bottomed—hard to ask for a better setup than this.
Invalidation is clear: new lows. But as it stands, this is a clean weekly block retest that looks ready to launch.
From here, I’m expecting the move to begin.
See you above $1 CRYPTOCAP:XLM $XLMUSDT.
