XLM is Most Likely Ready For a Correction | Stellar Analysis💎 Paradisers, turn your focus to XLM/USDT! The asset is presently traversing a clear descending channel and seems on the brink of a potential downward breakout.
💎 If this breakout materializes, brace yourselves for immediate correction in the XLM's price.
💎 It’s imperative to spotlight the two authenticated order blocks in a shorter timeframe. Given the prevailing liquidity, these areas are likely destinations for the Stellar.
💎 Reviewing historical movements, a shift from demand to supply has been observed, culminating in a notable decline in LSE:XLM 's price and aiming at the preceding Order Block (OB).
💎 In the dynamic realm of crypto, maintaining alertness and flexibility is paramount. Ensure your charts are up-to-date and stay connected for further insights!
XLM

XLM Looking Bullish On The DailyThis is a daily chart of XLM and price appears to be making a double bottom with money flow rising from the red and divergence nearly confirmed on the daily.
Current trading plan is long entry from current price with a 1-3% stop loss invalidation area.
Target 1 will be a 1/3 retrace of the last swing for approximately 5% and the second target will be the center of the golden pocket of the swing at .124 10% higher than the current price.
Trade Well.....

XLM/USDT 1DAY UPDATE BY CRYPTOSANDERS !!Hello, welcome to this XLM/USDT update by CRYPTO SANDERS.
CHART ANALYSIS:- Stellar (XLM) was also in the green in today’s session, after two consecutive days of price declines.
XLM/USD peaked at 0.1154 earlier in the day, which comes less than 24 hours after falling to a low of 0.1122.
As a result of the decline, bulls continued to push the token away from a recent floor at 0.1100, and back on course toward resistance at 0.1320.
Today’s rebound was helped by the RSI reaching a floor of its own at 37.00, and it is now tracking at 39.87.
A ceiling at 44.00 now awaits bulls and could be the main hurdle preventing further gains this weekend.
I have tried to bring the best possible outcome to this chart.
Hit the like button if you like it and share your charts in the comments section.
Thank you.

xlmusdthello bro... this is just an idea, actually this is just a scenario in analyzing future movements, so don't ever use this as a reference for buying or selling in the market... or just call it a prediction. ..

XLM bear trying so hard to get out of that bear flaghi traders, im spotting a bear flag in play for xlm, she is trying really hard getting out of it but bulls may get tricked in this one, lets see how it plays i wil post a short position in here just for fun and educational pourposes

XLM/USDT 1DAY UPDATE BY CRYPTOSANDERS !!hello, welcome to this XLM/USDT update by CRYPTO SANDERS.
CHART ANALYSIS:- On the other side of the spectrum was stellar (XLM), which dropped by over 8% in today’s session.
XLM/USD bottomed out at 0.1195 on Wednesday, less than 24 hours after residing at a high of 0.1318.
This drop in price saw the token fall for a third consecutive day, falling below a floor of 0.1200 in the process.
It appears that today’s sell-off coincided with the RSI failing to remain above a point of support at 49.00.
Price strength is now tracking at 44.53, with the next visible zone of stability around the 37.00 region.
In the event that this level is reached, XLM will likely be trading under 0.1100.
I have tried to bring the best possible outcome to this chart.
Hit the like button if you like it and share your charts in the comments section.
Thank you

XLMUSDTThis is a 1D frame analysis for XLMUSDT As we can see, we can observe a double bottom pattern which after the failure and the uptrend is currently heading towards a support line and after the slow patterns we can take from the market in a stepped manner for higher numbers. Keep in mind that there is a possibility that the price may start a movement from the first support line to the second support line after the drop, so keep an eye on both zones.

xlm, abc analysis, c pointIt seems that our Stellar is actually like this if we also consider the analysis of btc, bnb, xrp.
First a small drop and then a big rise.

IS ELLIOT WAVE THEORY REAL? STELLAR LUMENS XLMHello Traders,
Here is the monthly chart of Stellar Lumens looking at this purely from an Elliott Wave perspective. I know little about the technical details of the protocol/token etc.
From an EW perspective price looks to be inside a bullish wave 3 with the target at the 1.618 extension.
Lets see what happens.

$XLM to 32¢ CRYPTOCAP:XLM Presenting a pretty Stellar Setup
CUP N' HANDLE
FLAG/PENNANT
GODD FIBONACCI CONFLUENCE

Stellar 50% profit targetStellar trap inside sideways channel for 23 days, and it's still trying to break classic support and resistance level at 0.1334.
This Classic support and resistance become a new bullish confirmation, and if it breaks up bullish target at 0.14745 as fibonacci resistance, and maximum target at 0.17089 as previous high.
The best strategy to enter this market is wait for stellar to reach 0.112460 as sideways support and aim for previous high at 0.17892 with 52% profit.
Good luck, may profit be with you.
If you have any questions about this analysis, do not hesitate to contact me.

Stellar has insane potential in the price patternAugust seems to be calm, but at the beginning of September we are up
xlm and xrp are big competitors to each other and we will soon see a strong rise in both
I will let you know when I participate because I will probably buy a large amount of Stellar since the profit seems to be hundreds of percent
If you have any questions, I will be happy to answer them
and you may also be interested in any other coin analysis you want to see then you can leave comment

XRPUSD - dump 199\888Run a parallel channel on a line chart and you will see how bad things are with xrp. It doesn't matter what its fundamentals are, those fundamentals have been there for a long time, but the price is driven by money, not news and cooperation with banks etc. So the only time to buy xrp is already in spring 2024 and globally after 28.

XLM: Pullback in UptrendStellar (XLM) technical analysis:
Trade setup : Following a breakout from a Falling Wedge pattern, price spiked up to $0.19 where it got very overbought (RSI > 75) and traders took profits (selling pressure). Now it’s pulled back to support of $0.12, which could be a swing entry level. Fibonacci retracement levels are $0.12 (78.6%) and $0.13 (61.80%).
Trend : Neutral on Medium-Term basis and Uptrend on Short- and Long-Term basis.
Momentum is Bullish (MACD Line is above MACD Signal Line and RSI is above 55).
Support and Resistance : Nearest Support Zone is $0.12, then $0.10. The nearest Resistance Zone is $0.13, then $0.19.

XLM/USDT 1DAY UPDATE BY CRYPTO SANDERS !!hello, welcome to this XLM/USDT update by CRYPTO SANDERS.
CHART ANALYSIS:- Stellar (XLM) rose to a three-day high today, as bulls continued to target a key price ceiling.
XLM/USD hit a high of 0.1271 earlier in the day, less than 24 hours after trading at 0.122.
The move comes as the 10-day (red) moving average approaches an upward crossover with its 25-day (blue) counterpart.
This is the closest that stellar traders have come to taking the price over a resistance zone of 0.1300 since Tuesday.
Today’s surge came as the 14-day RSI broke free of a ceiling at 49.00, moving to a current level of 51.08.
earlier gains have marginally eased, with XLM now trading at $0.1253.
I have tried to bring the best possible outcome to this chart.
Hit the like button if you like it and share your charts in the comments section.
Thank you

XLM/USDT 1DAY UPDATE BY CRYPTO SANDERS !!hello, welcome to this XLM/USDT update by CRYPTO SANDERS.
CHART ANALYSIS:- Stellar (XLM) also hovered in the green, as the price remained near a resistance level of 0.1300.
XLM/USD rose to a peak of 0.1243 earlier in the day, which comes following a low of 0.1178 the day prior.
The move comes as the 10-day (red) moving average approaches an upward crossover with its 25-day (blue) counterpart.
the RSI is on the cusp of breaking out of a key resistance level of 50.00, which has been held for close to a month.
Bulls will potentially aim to penetrate this point in the coming days, taking the price near a ceiling of $0.1400.
I have tried to bring the best possible outcome to this chart.
Hit the like button if you like it and share your charts in the comments section.
Thank you

XLM/USDT 1DAY UPDATE BY CRYPTO SANDERS !!hello, welcome to this XLM/USDT update by CRYPTO SANDERS.
CHART ANALYSIS:- XLM was one of the biggest movers, as the cryptocurrency rose by as much as 7% in today’s session.
After trading at a low of 0.1147 on Sunday, XLM/USD moved to an intraday peak of 0.126 earlier in the day.
This surge sees a stellar climb higher for a second consecutive day, following a rebound from a floor of 0.110.
Earlier gains have already begun to ease, which comes due to the relative strength index (RSI) colliding with a ceiling of 49.00.
the index is now tracking at 49.48, with the next point of resistance around 54.00.
Overall, bulls seem to have set their sights on the 0.135 level.
I have tried to bring the best possible outcome to this chart.
Hit the like button if you like it and share your charts in the comments section.
Thank you

xlm getting ready for massive bullish rally seems like correction is over and xlm looks ready for decent recovery
falling wedge breakout has already confirmed in h4 timeframe expecting 45 to 50% bullish rally
expecting move towards 0.17$

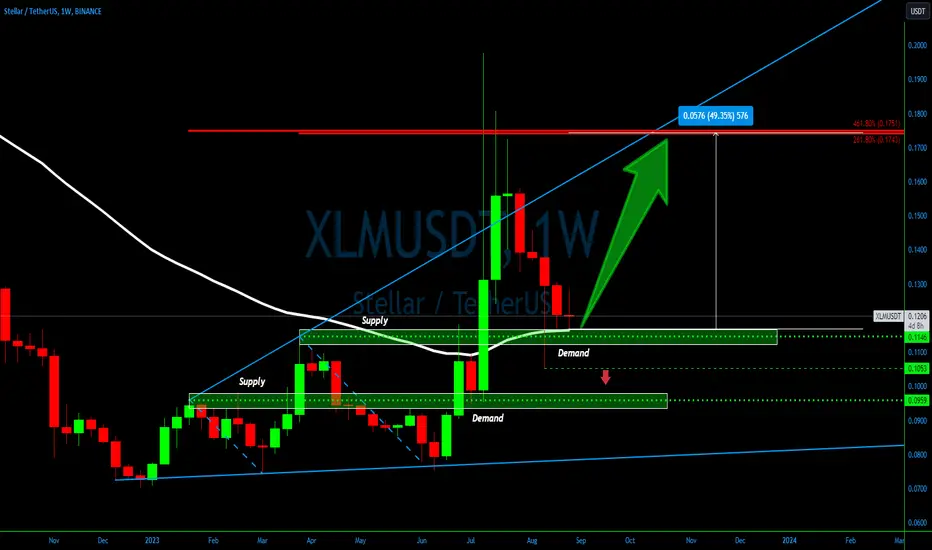
Unpacking XLMUSDT Price Patterns💎 Diving into #Stellar's long-term price trajectory, we spot some captivating patterns. The weekly #XLMUSDT chart reveals the price nestled in a robust demand zone, a magnet for buyers. Moreover, the 200 Exponential Moving Average has been consistently rebuffed in the past weeks.
💎 The bullish uptrend is evident with the formation of LLs and LHs. Given #XLM's position at support, it hints at a promising risk-reward scenario for bullish traders. As long as the price hovers above the current demand zone and crucially, remains north of the recent low at $0.1053, the scales tip towards an uptrend continuation.
💎 Eyeing the upside, a formidable resistance looms at $0.1750, marking a 50% surge from the present rate. This resistance's potency is amplified by a dual Fibonacci level, specifically at 261.8% and 461.8%. We could witness either a swift rally or an extended consolidation before #XLMUSDT ascends. In this volatile dance, patience and discipline remain our steadfast partners.
Stellar Lumens - A Hidden OpportunityStellar Lumens - A Hidden Opportunity
I cover the chart first and then some positive fundamental's and tokenomics.
The LSE:XLM Chart
I located and plotted trigger points, boundaries and of course a time structure.
There is a clear bull/bear time pattern. Open the chart and see the months and see how they move in similar increments both by month and by number for Bull and Decline periods.
Three positive price action triggers are marked on the chart and are confirmed by the following:
1. Break above 10 Month SMA, combined with
2. Confirmed MACD Cross, combined with
3. Both occurring in the bull pattern time window
All three have just occurred as of July 2023. IN ADDITION
4. This time we have broken above the POC, and
5. We have broken out of the OBV resistance line.
All of the above is extremely bullish for Stellar Lumens XLM for the long term.
The risk/return is ideal as a price just under the bottom of the ascending triangle can act as a stop loss for you and the upper end can act as a first main point to take profit.
Undesirables:
- If we close a weekly candle outside of ascending Triangle, Exit trade.
- If we fall below the POC or 10MSMA, reduce position size or hold off until this happens and increase position size.
This chart is another fine example of how timeframes can help us structure a trade. Please note that this is a long term 12 - 18 month trade minimum. You could be exiting at any stage over those months depending on the trigger events mentioned above, ideally closing the majority of the position at the first trigger point 0.60c (lock in your stake and some profit). Furthermore, you have to be able to withstand the volatility within the ascending triangle without capitulating your position. There is currently some room to the downside but a lot more to the upside, you need to be prepared for both.
Positive XLM fundamentals:
Stellar is already being onboarded as a potentially compliant global payments system:
Stellar (XLM) like Ripple Labs (XRP) is intending to be a layer 2 international global payments remittances provider and enabler, albeit while Ripple Labs is targeting big business and institutional networks/transactions, Stellar has an incredibly varied pipeline from on/off ramps, asset tokenisation, moneygram conversion and access, and much more. Stellar appears to be targeting the developer, the retailer, the consumer, the international payments community in their transfers/remittances, and the unbanked. The Stellar Blockchain is a decentralized consensus protocol making it very quick and very efficient with a distributed ledger updating globally every 2 to 5 seconds.
ISO 20022 is an International Organization for Standardization (ISO) standard for exchanging electronic messages on payments data between financial institutions. They set the international payment standards through the likes of the SWIFT system and for the likes of CITI Bank, HSBC, J.P Morgan and Deutsch Bank.
Currently cryptocurrency’s that are ISO Compliant or in the process of becoming compliant include Ripple CRYPTOCAP:XRP , Xinfin Network TSX:XCD , Algorand EURONEXT:ALGO , IOTA and Stellar Lumens $XLM.
Why is this so important? Well because ISO compliant payment networks will be the most likely to be called upon for the distribution or enablement of Central Bank Digital Currencies (CBDC’s) and other secondary payment protocols.
Private Partnership from the likes Ripple & Stellar will likely be called upon to develop, enable and distribute a new CBDC:
We are aware that most governments are in the process of developing CBDC’s and cannot complete this task without private partnerships.
For example as early as 2019 the Official Monetary and Financial Institutions Forum (OMFIF) outlined the following observations:
“Practically, the operation of a CBDC is likely to rely on some sort of public-private partnership. Central banks could outsource the distribution of the CBDC to private financial institutions, which could also be involved in the onboarding of users”
“most central bank respondents suggested they would outsource many of the public facing tasks involved in CBDC management to third parties.”
“Some central banks noted that certain functions – such as ‘onboarding and overlay services’, or the actual distribution of the currency itself – could be ‘outsourced’ to private sector participants.”
“Among respondents, 64% said ‘intermediation’ functions, such as customer onboarding, which could be ‘outsourced’ to private sector participants, would be important in CBDC implementation”
In more recent news the Bank for International Settlements (BIS) AKA the Bank for Central Banks published a report based on surveys and data collection called “Making Headway”, they advised that:
o 86 central banks took part in the survey (including the largest)
o 15 CBDC’s would be up and operational by the end of the decade 👀
o Confirmed that Central Banks can hold up to 2% of their balance sheet in cryptocurrencies from the January 2025.
Considering the BIS is usually very anti crypto this news is significant.
Positive Tokenomics Vs competitor XRP:
XLM is currently 21st largest cryptocurrency in the world with a market cap of €3.4 billion.
XRP by comparison has a market cap of $27.8 billion and is ranked 5th, thus XRP would have a harder time of it in terms of multiplying its larger market cap and price.
In November 2019, the overall XLM supply was reduced. Now there are about 50 billion lumens, total, in existence, and no more lumens will be created.
So XLM has a max token supply of 50 billion whilst XRP has a max supply of 100 billion making it a more price dilutable token than XLM. At present XLM have released 51% of their 50 billion max token supply to the market whilst XRP have released 50% of their 100 billion tokens - 52.9 billion tokens (equating to number greater than the full supply available in XLM). XLM’s price will be greater impacted by demand than XRP due to the lower max token supply, smaller market cap and the fact no more new Lumens can be created, it is a fixed supply.
The more participants that join the network and use the network the less Stellar Lumens are available thus creating a demand. From Jan 2020 to present Stellar Lumen accounts have increased from about 4.2 million to 6.7 million. In the same period total transactions increased from <250,000 to almost 1 million.
All in this 12 – 18 month trade comes with a lot of positive upside and limited downside. XLM has a reasonable fundamental narrative backing it that could make it central to future payment networks and the XLM tokenomics provide a lot more upside potential than those of its close competitor Ripple (XRP). I am a fan of both offerings however it seems reasonable to have an XLM position if you have an XRP one. Maybe we can be the X-Army and support one another…. Maybe “X” will use both for its payment platform. One can dream. Please have a look at my XPR chart which is similar to the this XLM one, you may find that beneficial too.
Hope all of the above helps frame XLM in your minds eye and also provides you with a structure for an XLM trade.
PUKA

XLM\XRP - I Told You This Was A Fake Out... Who Listened?Back once again to highlight some key points about what most herders have been thinking over the last couple of months. Nothing new, just some hard facts about how ridiculous these sheep like creatures appear to me when they speak nonsense garbage.
A lot of these people that doubted my predictions are just useless nobodies that never invested 2 seconds of their time to learn anything about how markets operate.
I spent over 8 years creating the AriasWave methodology and have become an expert at reading these waves as a result. I no longer need to bother wasting my time preaching my views to people. I do however like to go against these fools every now and then to rub salt in their wounds.
Most importantly there are still some good followers out there that still appreciate my work and those people are these reason why I decide to come back and post. So if you are one of those people and want me to start producing more content then start showing your support by doing the needful.
We all use social media these days, so you know what to do.
Currently there is not enough of a clear pattern for me to label the start of the third-of-a-third wave down but it's coming, so perhaps stay tuned and I may post something sooner rather then later.

Keep an eye on $XLM/USDTThis chart specifically pertains to a projected extended period of rising prices and positive market sentiment, often referred to as a "bull run." It focuses on forecasting favorable market conditions over a significant time frame.
Did you find this crypto market analysis helpful? Stay updated about the latest crypto market update.
Please continue to follow my analysis and feel free to ask any queries, you may have. I am here to assist you.
TradingView: @FarmanBangashh

XLM | It About That Time | LONGStellar (XLM) is a peer-to-peer (P2P) decentralized network created in 2014 by The Stellar Development Foundation or Stellar.org. The network officially launched in 2015 with the purpose of connecting the world's financial systems and ensuring a protocol for payment providers and financial institutions. The platform is designed to move financial resources swiftly and reliably at minimal cost. Stellar links people, banks, payment processors and allows users to create, send and trade multiple types of crypto.
