Stellar #Bullishwe saw a significant breach through a really strong trendline since yesterday and #XLM can, in optimistic scenario, indicate such bull run in the near future
XLM

✴️ Stellar Enters Bullish Cycle | 5-Steps PatternStellar (XLMUSDT) is moving ahead of the pack and just hit a 5 months high.
Let's see what this chart has to say.
First, let's focus on the 5-Step Pattern we've been looking at today.
This pattern consists of #1, the Dec. 2022 low.
#2 | January's 2023 bullish breakout.
#3 | The correction that ended mid-March (10-March).
#4 | The resumption of the bullish trend and #5 the new high, in this case we are aiming at $0.18 based on the Fib. extension numbers.
This is the same pattern we saw with Cardano, ChainLink, Terra, etc.
Now, let's review some of the classic signals.
- Really high buy volume in the past few days. The highest buying pressure since 2021.
- Very strong indicators. RSI and MACD... The rest is history.
What one does, the rest follows!
Expect for the rest of the market to grow as well.
You can find XLMBTC in the "Related Ideas" below.
Thank you for reading and for your continued support.
Namaste.

XLMUSD finally validating the inv h&sStellar’s XLM looks like its finally gonna trigger the inv h&s pattern it had previously done a fakeout or 2 above the neckline of. We can see before on its first trip above the neckline the original right shoulder was extremely small…it then went back under the neckline and has since created a much more robust right shoulder before now finally breaking back above the neckline with the type of authority that gives me confidence that it will reach the measured move target this time. In doing so it should also take price action above this descending trendline its currently testing the resistance of which if it can do so and then flip that trendline to solid support should also trigger a breakout from a triangle pattern its been in for quite sometime that can then eventually lead to much higher breakout targets than just this inverse head and shoulder target allows for. *not financial advice*

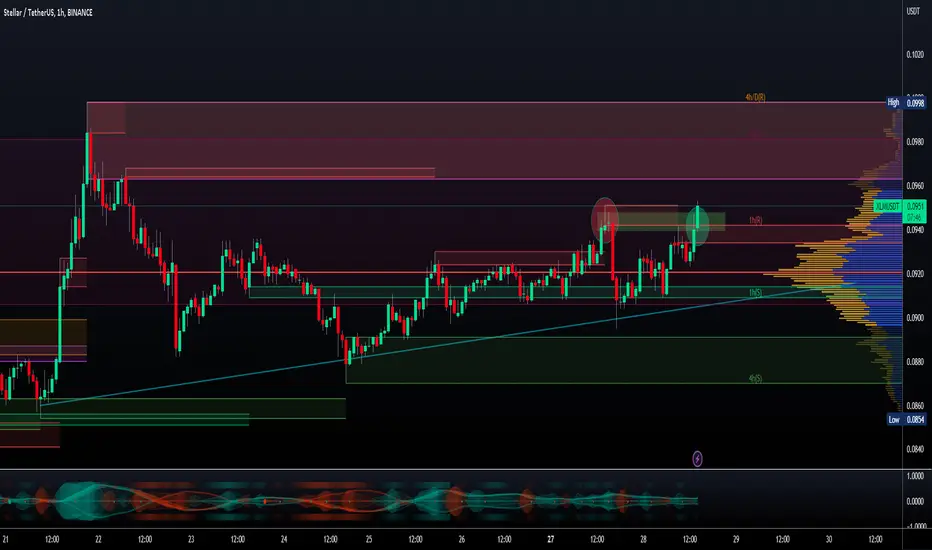
XLM/USDT - Stellar: Resistance_Breakout_Confirmation◳◱ A Resistance Breakout and Confirmation has been detected on the $XLM / $USDT chart. The price has broken above a key resistance level and has been confirmed by a strong candle, indicating a potential bullish trend. The next resistance key levels are located at 0.0993 | 0.1067 | 0.1211, and the major support zones can be found at 0.0849 | 0.0779 | 0.0635. Consider entering a trade at the current price zone of 0.0951 and targeting higher levels.
◰◲ General info :
▣ Name: Stellar
▣ Rank: 28
▣ Exchanges: Binance, Kucoin, Bybit, Huobipro, Gateio, Poloniex
▣ Category/Sector: Payments - Currencies
▣ Overview: Stellar is an open-source payments network that serves as a distributed intermediary blockchain for global financial systems and circulates a native asset, Stellar Lumens (XLM). The Stellar blockchain allows anyone to issue new assets in the network and exchange for other assets via built-in asset exchange features. Assets on Stellar are issued and redeemed by anchors, who are trusted entities that issue digital credits on the Stellar network in exchange for deposits of the asset with the trusted entity. Anchors enable real world assets to be exchanged on Stellar by leveraging a distributed exchange that maintains an order book for every asset pair. Stellar supports the issuance of any type of asset including stocks, currencies, cryptoassets and more.
◰◲ Technical Metrics :
▣ Mrkt Price: 0.0951 ₮
▣ 24HVol: 9,909,925.430 ₮
▣ 24H Chng: 0.955%
▣ 7-Days Chng: -2.29%
▣ 1-Month Chng: 6.01%
▣ 3-Months Chng: 31.73%
◲◰ Pivot Points - Levels :
◥ Resistance: 0.0993 | 0.1067 | 0.1211
◢ Support: 0.0849 | 0.0779 | 0.0635
◱◳ Indicators recommendation :
▣ Oscillators: BUY
▣ Moving Averages: STRONG_BUY
◰◲ Technical Indicators Summary : STRONG_BUY
◲◰ Sharpe Ratios :
▣ Last 30D: 0.97
▣ Last 90D: 1.76
▣ Last 1-Y: -0.78
▣ Last 3-Y: 0.74
◲◰ Volatility :
▣ Last 30D: 0.64
▣ Last 90D: 0.54
▣ Last 1-Y: 0.73
▣ Last 3-Y: 1.13
◳◰ Market Sentiment Index :
▣ News sentiment score is N/A
▣ Twitter sentiment score is 0.62 - Bullish
▣ Reddit sentiment score is 0.47 - Bearish
▣ In-depth XLMUSDT technical analysis on Tradingview TA page
▣ What do you think of this analysis? Share your insights and let's discuss in the comments below. Your like, follow and support would be greatly appreciated!
◲ Disclaimer
Please note that the information and publications provided are for informational purposes only and should not be construed as financial, investment, trading, or any other type of advice or recommendation. We encourage you to conduct your own research and consult with a qualified professional before making any financial decisions. The use of the information provided is solely at your own risk.
▣ Welcome to the home of charting big: TradingView
Benefit from a ton of financial analysis features, instruments and data. Have a look around, and if you do choose to go with an upgraded plan, you'll get up to $30.
Discover it here - affiliate link -
XLM|USD on Daily BreakoutI've been watching this one for days waiting for a breakout and boy did it breakout. My take profit area is at $0.11. What a great set up, the view from the RSI, MACD and price action is just beautiful! I'm placing an order to buy more at $0.89 encase we wick back real quick and a stop at $0.85.
Happy Trading!

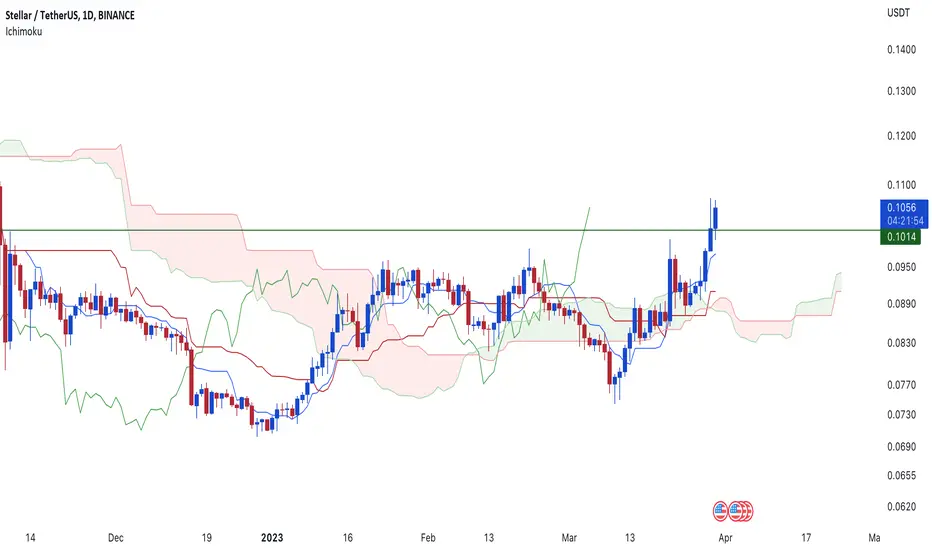
Ichimoku Analysis for XLMWill long $XLM if closes above 0.1043 today. SL will be closing below tenkan support.
XLM .088Let's see if we get a third bounce off the trend line...
That trend line is easily in play from now until the end of the year.
We also have good confluence with the .786 fib extension from the ATH in January 2018, to the low in March 2020, and to the high in May 2021.
A touch of .086641 at the .786 fib extension has a good probability.

XLM Lights Out on April Fools 2023Don't be fooled...
XLM to .017
XLM Lights Out on April Fools 2023?

an update on XLM's Bullish trendPrice finally managed to break the triangle.the price can easily reach the target(0.13) after a little correction.
Previous Analysis:
✅Access trading ideas, build strategies with drag and drop, backtest, and automate your trading for passive income with our Sponsor's platform Vestinda. check it out using the link in the Description.
_ _ _ _ _ _ _ _ _ _ _ _ _ _ _ _ _ _ _ _ _ _ _ _ _ _ _ _ _ _ _ _ _
🌍Thank you for seeing idea .
Have a nice day and Good luck.

XLM Swing Long SetupIt is a perfect time for all of us to zoom out, and get into long position and most of alts for second leg of this mini bull run.
My price entry is based on weekly chart and its price entry on first leg.
Also, I see a LL on BTC pair+Its making a double bottom.
I am expecting a god candle after reaching my entry point, so its better to make a stop limit order.
Lets see

$XLM/USDT 12h (#Bybit) Falling broadening wedge breakoutStellar Lumens looks good for bullish continuation from here after pulling back to 100EMA support.
⚡️⚡️ #XLM/USDT ⚡️⚡️
Exchanges: ByBit USDT, Binance Futures
Signal Type: Regular (LONG)
Leverage: Isolated (5x)
Amount: 6.2%
Current Price:
0.09070
Entry Targets:
0.09060 - 0.08800
Take-Profit Targets:
1) 0.09625
2) 0.10150
3) 0.10670
Stop Targets:
1) 0.08350
Published By: @Zblaba
$XLM #XLMUSDT #StellarLumens
Risk/Reward= 1:1.2 | 1:2.1 | 1:3.0
Expected Profit= +38.9% | +68.3% | +97.4%
Possible Loss= -43.2%
Estimated Gaintime= 1 month

Xlm Breaking Falling Wedge Seems Like Xlm Has Already Bottomed Out And Looks Ready for Massive recovery In coming Weeks
Breaking Falling Wedge In 3 days Tf Incase Of successful Breakout expecting 400 to 450% bullish Move

Stellar Lumens Flipping Trends Weekly MACD and RSI beginning to turn bullish suggesting a great opportunity for bulls to take a long trade
First target .35-.40

🔥 XLM Bear-Market Ended: Preparing For The Next Bull-RunOver the course of ~6 years, XLM has been trading inside the pattern drawn on the chart. With the price reversing from the bottom support early January, we can make a good case for the idea that the bottom is in.
At the moment, we're likely going to see a long period of accumulation, maybe a year or more. The top resistance will function as the main target for the next bull-run, which could net in some decent long-term gains.
For better readability I've copied the previous bull-run in yellow. This is not my prediction, but merely an indication.

XLM accumulation LONG term opportunityHello everyone.
With XRP being bullish, why not be bullish in XLM too ? Targets provided above.

XLM SHORT SETUPHi, dear traders. how are you ? Today we have a viewpoint to SELL/SHORT the XLM symbol.
For risk management, please don't forget stop loss and capital management
When we reach the first target, save some profit and then change the stop to entry
Comment if you have any questions
Thank You

XLM trying to breakout.XRP has been pushing in the past few hours. XLM looks like it's trying really hard to breakout of the pattern above. If XRP continues north, XLM may follow.

XLM setup looks a little familiar.XLM looks to be setting up almost identically to a previous pattern seen previous to the last bull-run. If this pattern repeats, expect the next move to be much bigger than the previous move overall.

XLMXLM technical analysis:
Friends, according to the ascending harmonic pattern and the golden cross, the fifteen-minute time frame of ascending targets has been determined.
Analysis based on Satoshi is suitable for friends who work on the margin.
Good luck
Karim Heydari

XLM TRADE STARTED.Long position of 25,000 XLM opened at .089. Due to the market manipulation during and after the FED meeting, I decided to start a new position in XLM with no stop currently.

XRP needs to break the green trend line.Interest in XRP has been growing steadily the past few years. After the amazing run on Wednesday there is no doubt that many are plotting their entry points for the growth to come. With today's pullback we need to see XRP's price break the green trend line.

XRP owners don't care what the FED says, or does!Since the FED was created in 1913 the US Dollar has lost it's gold and silver backing, is printed out of thin air and has lost over 98% of its value. No matter what these shysters attempt to do, it doesn't make any difference at all because XRP holders know that the Dollar is going to "ZERO... ZERO!"

Watch Wednesday into Thursday with XRP.A big move came this morning. Resistance at .466 and .555. I think we will see the biggest moves heading into Thursday the 23rd and possibly continuing into the end of the week. (Sunday)
Fasten your seatbelts.
