XLM

XLM/USDT 4H chartXLM/USDT 4H chart
wait for pullback till 0.108 dollar and wait for rejection then it can continue his but run

Stellar Lumens waiting for a pullbackAfter breaking through a diagonal resistance line, the price is testing another diagonal mini resistance.
I would expect a return on the support in red for a good entry, unless it gives indications that it won't go back there anymore.

What is happening and what is going to happen
The table shows that the trading behavior of cryptocurrency whales is, in general, heterogeneous. As a result, it can be difficult to interpret big players' behaviour.
Appendix:
Whales:
1- Institutions: money centre banks, hedge funds, Grayscale, Tesla ...
2- Exchanges: (6.7% of Bitcoin in circulation was held on exchange wallets),
3- Individuals: Elon Musk (Dogecoin- BTC- ETH- ETC).
4- Satoshi Nakamoto: first 1.8 million or so BTC first created, have never been spent.

what do you think about my position???hello guys
i got this position last few days ago, and free risk it now but i have a long tp zone about 0.085
what do you think about my reward zone? it is too much?

XLM not looking goodXLM picked up no steam on ETH pump, ETH sentiment looks bad now XLM could drop to .07 from here, as sad as it is this is the time to be selling, ill be selling ATLEAST half of my positions on this small supportive bounce, I think this support will be invalidated and we could test lower to levels of .09 first then to .065. A move above the supportive red line would invalidate the bearish scenario
XLMUSDT Short-term upward movementHello guys
This currency has stop-hunt that level and confirmed a possibility of a short upward movement to the bearish trend line, but as you can see in the weekly timeframe image, it needs to downward to the price range of 5.7-8.5 cents, and that area has potential to start the growth of this currency.
In the future, this analysis will be updated.
follow me please and like this post.
thanks for your attention!

Stellar XLM short Entry Range, Take Profits and Stop LossXLM/USDT short
Entry Range: $0.110 - 120
Price Target 1: $0.098
Price Target 2: $0.0.092
Price Target 3: $0.080
Stop Loss: $0.129
previews short

Stellar 0.618 RecoveryStellar has formed its early break out structure (falling wedge)
0.618 is a strong level of support and a likely point for price breakout of the falling wedge in white
A larger symmetrical triangle can also be drawn

XLMUSDT
This is an article, not financial advice, always do your own research.
If you have any questions, you can write it in comments below, and I will answer them.
And please don't forget to support this idea with your like and comment, thank you.

Stellar Bulls Surging, XLM Prices May Retest $0.13Past Performance of Stellar Lumens
Stellar Lumens prices are rallying and syncing with the broader market. The coin is stable on the last trading day but trending above a multi-month resistance trend line traced to April 2022. As the XLM prices bottom up, traders may find opportunities to ramp up in lower time frames.
#Stellar Lumens Technical Analysis
XLM prices plunged 88 percent after peaking at $0.75 in May 2021. Currently, the coin is up 16 percent from 2022 lows, and buyers are in control, reading from the candlestick arrangement in the daily chart. As price action takes shape to favor buyers and prices break higher above the critical resistance level, traders may search for entries on dips, targeting $0.13 in the medium term. This preview, however, is only valid if prices are steady above $0.10. Any breach below this reaction point may force XLM towards $0.09 or worse in a bear continuation formation.
What to Expect from #XLM?
The bounce to spot rates is refreshing for token holders and may find the base for another leg up towards $0.17 and Q1 2022 lows. Still, the rapidity of the uptrend will highly depend on if there is confirmation of July 18 gains and the level of trader participation. Any expansion in trading volumes with rising prices could signal strength and buyers taking charge after months of lower lows.
Resistance level to watch out for: $0.13
Support level to watch out for: $0.10
Disclaimer: Opinions expressed are not investment advice. Do your research.

XLM Trade SetupMarket has been green over the past three days ! so good to see these kind of rallies after a long time.
Moving to the XLM chart ! here's the thing, the pattern you are looking in the above chart is known as cup and handle pattern. As we all know BTC had broken
it's range high in which it had been traded from the past 28 days, adding to this XLM had broken this cup and handle pattern and coming back to retest the breakout area.
Here's what i think, my final target calling is 11% up from hereon therefore target price falls under $0.119 to $0.123, when can you enter the trade? Ofc you can enter right now as it is trading at the local support but one thing to keep in mind is observe the volume if not you can wait for it to come towards the breakout zone, but make decisions accordingly and also not to mention that my stoploss is below the breakout area, i hope you know trade management so that if the breakout fails you can cut your losses.
Note : Anything provided here is not a financial advice, trade upon your own risk.

The direction of price movement will be towards lower support!Hello to all members of TradingView and my followers.
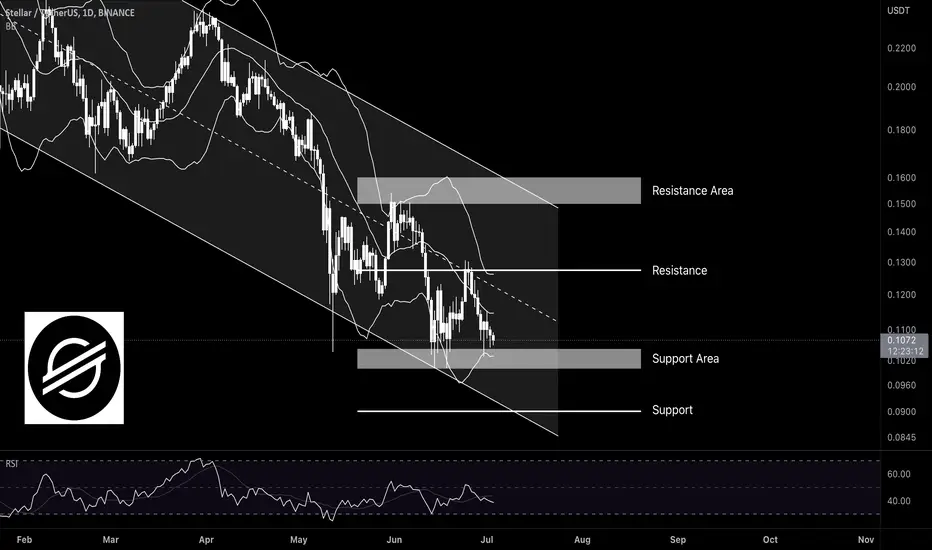
XLM experienced a price drop last week. Since the main trend in the daily time frame is bearish, the price has negatively reacted to the resistance range of 0.12 to 0.13 dollars. On the other hand, the downward movement and selling pressure has brought the price to the previous floor. Therefore, if the reaction to the support range of 0.100 to 0.105 dollars is observed, we expect to see the return of the price and the continuation of the range trend in the range of the current support and resistance of 0.15 to 0.16 dollars.
Also, if we see another drop in the market, the price will be expected to hit the support floor of the $0.087 range. For this month, as long as the price is below the $0.12 level, the direction of price movement will be towards lower support.
If it is helpful to you, please like it. If you have a comment, I'll be happy to know. Respectfully.
XLM has continued its range trend in the support rangeHello to all members of TradingView and my followers.
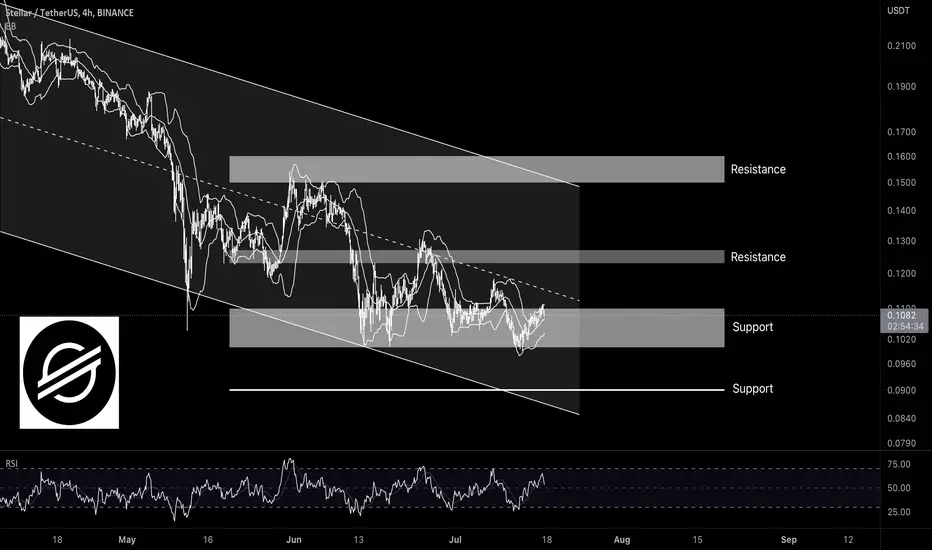
During the last week, XLM has continued its range trend in the support range of $0.11 to $0.10. The price is still in an overall downtrend, and even the midline of the descending channel is still acting as resistance. Unlike other currencies in the market, Stellar made a lower bottom again last week. Still, the previous bottoms were temporarily broken, and the candles returned above this support area. The 4-hour time frame shows that the resistance drawn on the chart is in the range of $0.123 to $0.127 until it becomes support. In the best case, if the support of $0.10 is maintained, the range trend can continue.
If it is helpful to you, please like it. If you have a comment, I'll be happy to know. Respectfully.
XLM BROKE INTO NEW TRADING RANGE!! XLM just did a S/R flip and since it is trading above resistance, i can see a strong pump coming. Manage your risk and this can be a fruitful LONG! Lets just hope btc doesnt dump....
Every day the charts provide new information. You have to adjust or get REKT.
Love it or hate it, hit that thumbs up and share your thoughts below!
Don't trade with what you're not willing to lose. Safe Trading, Calculate Your Risk/Reward & Collect!
This is not financial advice. This is for educational purposes only.

Stellar falling wedge can be broken soon
XLM can break its falling wedge and after pullback to its supply level, Long position can be very good here

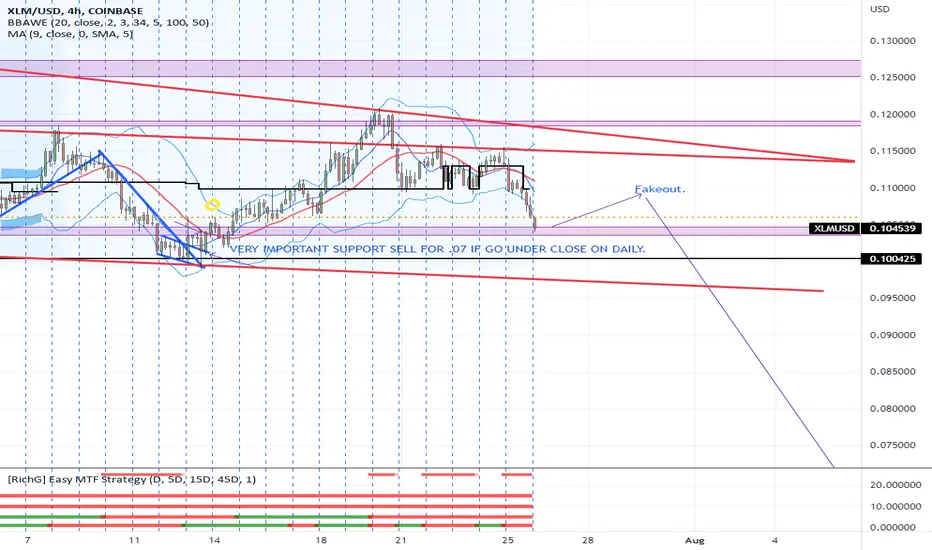
#Stellar #XLM #Cryptocurrency daily logarithmic time-frame:
A triangle formed with lower highs and and same level lows known as support area.
meanwhile with eye on 4h time-frame, If today's price candle closes under the support area go for short with 0.12 as Stop loss and 0.067 as first TP. Trail the second TP, if there is!

BTCUSDT - read to people with IQ over 100🧠
To begin with, you don’t see all this, because you rested on your indicators, on the thoughts of opinion leaders who themselves don’t really understand anything about trading and earn only on you.
On this platform, I have a lot of ideas related to numbers, check them out. It is very important for me that you guess what these or those values mean.
Try to simply see how many references to 33 leave Elon Musk and NASA, even every launch and spacewalk of an astronaut is accompanied by an impulse in one direction or another on the chart not only of BTC but also of the stock market. All this can be analyzed because it is all done for the sake of profit and the direction of the process in the right direction.
Let's start with what does 33/13 mean? This number means a new beginning, the start of something new - numerology is not a stereotyped understanding that was imposed on you so that you are not specifically interested in it, namely, from the mathematical side of Gann, Fibonacci is all numerology, all great mathematicians were numerologists, but some then the dudes who sell their courses talk about how it's all nonsense. All numbers have certain meanings that were created by ancient civilizations such as Maya.
You are wrong, the author, maybe you can add the Sumerians here?
I will attribute all astronomy, calendars, star maps, how many days in a year and hours in a day were studied thousands and thousands of years ago.
I also pointed out many examples of practicing the number 14 - directing energy towards resistance or support, balance. Which brought a large% profit, just trading from the levels that were formed by large players in the order book or there were marks on the chart. How 888 means the price goes in the opposite direction by a step more than 2%, which you can easily pick up with a stop of 0.4%, but you don’t see it. Open your eyes, wake up and for God's sake stop reading and listening to the opinions of those who direct the crowd, because that's how they cut you like hamsters.
in plotting I used arc system and degree system, you can find all the information on this great platform. The bottom line is to take trend lines and draw lines along them using cycles in parallel. In general, you can see this on the chart.
a similar system can be applied to any liquid instrument such as the stock market, raw materials, gold, metals, indices, currency pairs, etc. Even on low-liquid shieldcoins. Depends on your imagination and understanding of the process.
Notice how cycle 333 indicates the next BTC low or high. Subscribe here a lot of interesting things, like the idea

XLM 25% or 50% Gain Bullish Set-Up!XLM is at major support and right now is looking like a perfect place to enter a long position! You can enter now or wait for the diagonal line to be broken and retested to enter a long position. If both targets are hit 50% gain incoming.
Every day the charts provide new information. You have to adjust or get REKT.
Love it or hate it, hit that thumbs up and share your thoughts below!
Don't trade with what you're not willing to lose. Safe Trading, Calculate Your Risk/Reward & Collect!
This is not financial advice. This is for educational purposes only.

XLM | Stellar Close To The Support AgainXLM | Stellar Close To The Support Again
When the price reached 0.11789 price area it looked like the price was going to increase
faster.
For the time being the price made a fast movement by deleting all the profits.
Now it looks like the perfect time that we can buy again.
The first target will be our previous support area where the price changed
the direction during the previous time.

XLM/USDTesting/tracking elliot wave theory. Please do not trade off idea without S/L. Not financial advice.
The bottom looks like it's in. I can still see another leg down tho (C) wave shows another leg down to 0.05 area. This scenario is not likely to come, but never say never.
How I would trade this: Buying now and adding on the way down if it goes. We call this method laddering down or dollar cost averaging.
Once again, not financial advice.
Risk/Reward: 17.5
People say never go in on trades if RR ratio is not around 3...
This is huge.

Stellar 100% Potential Mid-Term (Weekly Timeframe)We have strong signals coming out of this chart in favor of the bulls, let's look at those.
This is XLMBTC (Stellar) on the weekly timeframe; aka. Long-term.
First, notice the broken downtrend-line.
This trendline marked a bearish trend that lasted more than a year.
This bearish trend has been broken.
Second, we have a long-term higher low, since December 2020.
1.5 Years and the old support wasn't even tested, this is a strong signal in favor of the bulls.
Trading volume continues to increase week after week.
Above 9-May's low (0.00000391), we are strongly bullish and expect additional growth.
Below this level, we stop any trading at a loss.
Namaste.

#Stellar Lumens Bearish, XLM Primary Support at $0.10Past Performance of Stellar Lumens
Like the rest of the crypto market, Stellar Lumens remains within a bear trend. Despite recent gains, there are clear lower lows in the daily chart. At spot rates, XLM is down roughly five percent as bears reverse last week's gains.
#Stellar Lumens Technical Analysis
The XLM coin is bearish at spot rates, with upsides limited at $0.13, last week's highs. Notably, prices are below the June 23 and 24 trade range with rising trading volumes over the past few days suggesting increasing liquidation pressure. Still, XLM bulls are optimistic about recovery if prices are above $0.10, June's 2022 lows. Risk-averse traders can wait for a clean, high volume breakout above $0.13 to load on dips targeting $0.15. Conversely, deep losses below $0.10 may see XLM slide deeper towards $0.09, a February 2020 reaction point.
What to Expect from #XLM?
At spot rates, XLM is retesting Q3 2022 highs, and price action is skewed for sellers. If bears take charge, further losses below $0.10 may see the coin slip to print multi-month lows.
Resistance level to watch out for: $0.13
Support level to watch out for: $0.10
Disclaimer: Opinions expressed are not investment advice. Do your research.
