RSR weekly chart looking still intact to move up RSR CHART: On this weekly chart you can see
that there is a Hidden Bullish divergence set
up, along with most of the Market.
When Price has a higher low and
RSI has a lower low,
Thats HIDDEN BULLISH DIVERGENCE.
I loaded in the green circle at the
bottom of the wick. I believe we will see another
breakout past the $.12 mark...do the math.
XLM

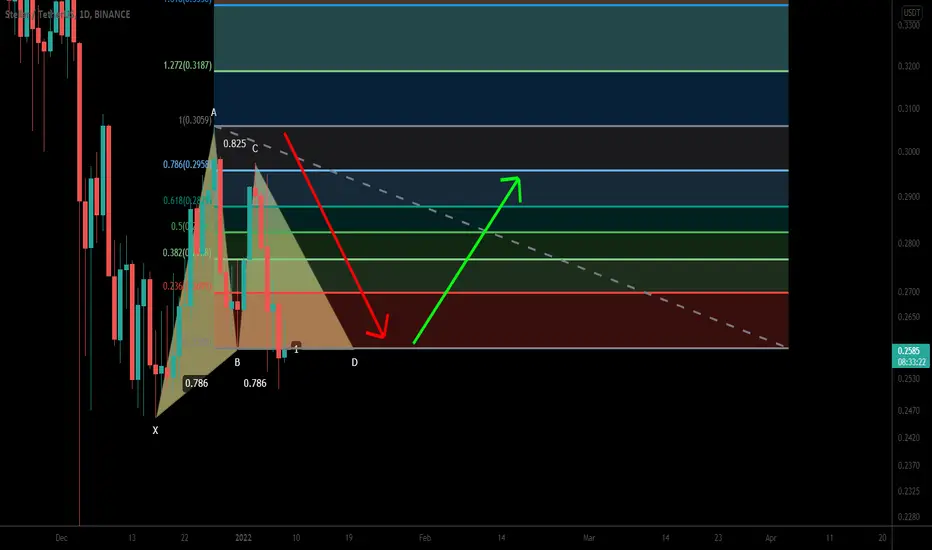
Stellar (XLM) formed bullish Gartley for upto 20% moveHey friends, hope you are well, and welcome to the new trade setup of Stellar ( XLM )
Previously I shared a harmonic trade of XLM which is still in play:
Now on a daily time frame, XLM has formed a bullish Gartley.
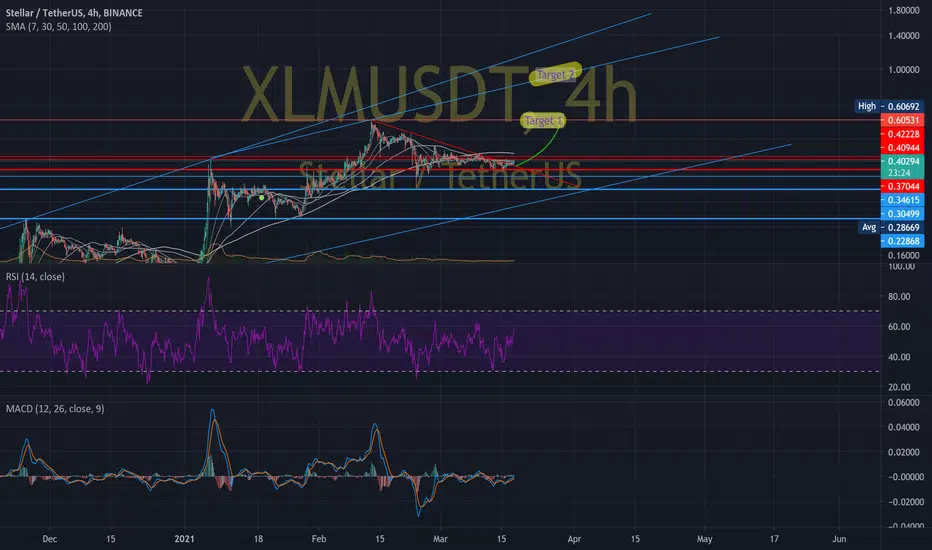
XLM - Potential Bullish Reversal!Hello everyone, if you like the idea, do not forget to support with a like and follow.
XLM is approaching a strong support in green so we will be looking for buy setups.
on H4: XLM is forming a trendline in red but it is not valid yet, so we are waiting for a new swing high to form around it to consider it our trigger swing. (projection in purple)
Another scenario would be if the bulls take over from here by breaking above the current high. (projection in blue)
Trigger => Waiting for that swing to form and then buy after a momentum candle close above it (gray zone)
Meanwhile, until the buy is activated, XLM would be overall bearish can still trade lower till the lower.
Good luck!
All Strategies Are Good; If Managed Properly!
~Rich


XLMBTCXLM shows a very good chart and I think we can trust XLM and publicly we see a positive movement in the coming days

BTC/USD: Bitcoin set to deliver 80% this year.The rising wedge can be one of the most difficult chart patterns to accurately recognize and trade. While it is a consolidation formation, the loss of upside momentum on each successive high gives the pattern its bearish bias. However, the series of higher highs and higher lows keeps the trend inherently bullish.


XLM CUP(date) ON THE HANDLE - THE NEW(est) ANGLEXLM CUP(date) ON THE HANDLE - THE NEW(est) ANGLE
An update to my CUP & HANDLE ideas for XLM
These are just my angles on the pattern...
By no means the final survey...

XLM's Break out will Determine The Trend Soon.Hello every one
STELLAR / TETHERUS
XLM is In a Symmetrical Triangle. The Pattern Has not Been Broken By The Price Yet. Depending on The Incoming Break out, We can Expect The Price to move Upward or Downward as Much as The Measured Price Movement (AB=CD) The Incoming Break out will Determine The Trend For XLM. The Support & Resistance are Shown in The Picture.
💎Traders, if you liked this idea or have your opinion on it, write in the comments, We will be glad.
Things can change...
The markets are always changing and even with all these signals, the market changes tend to be strong and fast!!
Thank you for seeing idea .
Have a nice day and Good luck

XLM Stellar Lumens Expected Move - XLMBTC XLMUSD XLMUSDTXLM Stellar Lumens Expected Move - XLMBTC XLMUSD XLMUSDT

XLMUSDT 1HrXLM seems to have completed an impulse wave A or 1 here. The larger direction looking upwards. A 'C' or wave '3' likely in progress.

xlmusdt is good for quick profit xlm didn't run last few months and it's now at a good point where you can buy and hold for the next few days I am expecting the coming month xlm could test 1$ easy
buy and sell targets are on the chart
if you like this idea please like and share thank you

XLM CUP(date) ON THE HANDLE - THE NEW(est) ANGLEXLM CUP(date) ON THE HANDLE - THE NEW(est) ANGLE
An update to my CUP & HANDLE ideas for XLM
These are just my angles on the pattern...
By no means the final survey
Sorry to spam the idea so much, i mess up alot before posting... i think i handle arc right now..jeesh

XLM CUP(date) ON THE HANDLE - THE NEW(est) ANGLEXLM CUP(date) ON THE HANDLE - THE NEW(est) ANGLE
An update to my CUP & HANDLE ideas for XLM
These are just my angles on the pattern...
By no means the final survey

XLM CUP & HANDLE - A NEW(er) ANGLEXLM CUP & HANDLE - A NEW(er) ANGLE:
Here is my new(er) angle on an XLM Cup & Handle
This is a revision of my previous idea "XLM CUP & HANDLE - A NEW ANGLE"
Which is:
A revision of my previous idea "XLM - ISHS to CUP & HANDLE"

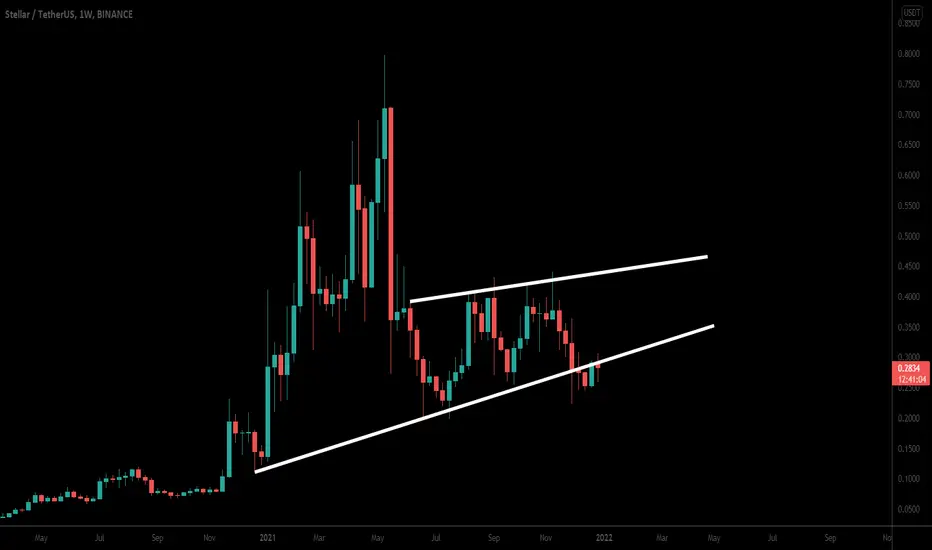
XLM long term target for bullsXLMUSD analysis based on fib levels.
We expect XLM to hit 2 $ in 2022.
However, if the price breaks below critical support, it may get ugly for bulls.
XLM is one of those coins that didn´t do much in comparison to new coins such as Solana, AVAX, CRV and many more.
We believe that older coins such as XLM , BCH , EOS, XRP will shine soon. They say: Every dog has its day.
XLM bright days are coming
Good luck
Drop a comment if you find this analysis useful
No financial advice!

Stellar (XLM) Buy ZoneStellar (XLM) Buy Zone
--------------------
BIAS
Mid-Term : Bullish
Risk : Medium
On 4 hours timeframe Stellar have formed the bullish pattern where the price has touched down the its potential reversal zone which is at the low entry zone.
--------------------
$XLM/USDT LONG SETUP
Leverage : x3 - x5
Entry Price : 0.275 - 0.2875
TP 1 : 0.2925
TP 2 : 0.3
TP 3 : 0.308
TP 4 : 0.32
TP 5 : 0.3333
TP 6 : 0.3425
TP 7 : 0.3575
TP 8 : 0.378
Stop Loss : 0.2565
*Maximum 3% of Portfolio.
*Unload 12.5% at each TP. Whenever TP 2 hits, Move stop loss to entry.
--------------------

XLM PREDICITIONLet's wait and see how the market reacts. It seems etc/usdt have some small bearish move.


XLM/BTC has broken out. The 8 month correction is over.This is going to lead to a large rally in XLM/USD which could see the price hit old highs of $0.80.
I anticipate once it reaches this level, it will likely break higher. Third time is charm.

This Is Why Jan 2022 Will Be Bullish For Stellar Lumens XLMHi friends, hope you are well, and welcome to the new update on Stellar ( XLM )
Big wedge:
On weekly, after getting bounced by 100 simple moving average XLM is still struggling to re-enter the big wedge. The stochastic is also indicating that the market of Stellar is oversold.
4hr channel:
Recently on 4-hr priceline has broken out a down channel.
Daily breakout and accumulation:
On daily time frame, priceline is still accumulating above the $0.255 support after breaking out the channel. There is also a bullish divergence flashed on the daily time frame. Therefore soon another move towards the upside is expected
Note: Above idea is for educational purpose only. It is advised to diversify and strictly follow the stop loss, and don't get stuck with trade
XLMXlm currency has been suffering in these areas for a long time. If bitcoin conditions are good and bitcoin dominance is broken, this currency can grow well.
