[XLM] Possible BreakoutAccording to my chart theres a wedge that has been broken leading to an increase in buying pressure. Not only that but the Oscillator displays that there has been a change in momentum leading to a higher buying volume. Cheers!🥂
XLM

XLM StellarHI !
On weekly time frame we can identify the cup and handle pattern. BULL SIGN in a BULL trend
On a Daily time frame we have a nice ascending triangle. Bull sign
Also, we can see the ending of the 2 Fibonacci retracement wave .
The targets are mentioned with a purple line .
Happy trading everyone !

Stellar vs USD - next move to $0,5Local flat structure may be complete (abc).
Most often flats are in the wave B (corrective patterns) or wave 4 of the impulse.
From this assumption I think that we are still in middle of a large wave B after the May 2020 crash. But short-term trading opportunities always exist, with decent risk to reward.
Trade safe!

#3 XLMEUR - 3D support in 50MAXLM is probably close to its bottom in 3D chart.
3D 50MA resistance has turned to support.
1D 200MA retesting going on after Golden cross (50/200)
1W correction is near its end. Its momentum is turning up again.
Hold your seats...
Not Financial Advice. Do your own research.


Who Wouldn't Buy This?WEEKLY TIMEFRAME
Not everything has to be complicated. Sometimes simple is the best option, XLM bulls holding the line strong, i suspect this week and the weeks to come would be crazy! TO THE MOON BOYS!!


XLM MY NEXT TARGET >> 0.455I'm not a fan of XLM but based on the TA for short investment XLM can reach 0.455
For long xlm going to reach 0.9 (JAN-FEB) 2022
what's your thoughts ?

XLM Retesting highsOnce we see a drop of the price to the support level on the fib, I expect up from here retesting highs.

XLM high volatilityXLM for a year now, has seen many price fluctuations, but the price is still at the same similar level, this shows how strong and stable this cryptocurrency is now, the silence around XLM should only be a sign for long term investors

$XLM on $XLM charts looking the perfect cup and handle pattern.
we been consolidated for 3 years since January 2018
and very sooon it will blow off the top since its altseason right now

Stellar vs Tether Also Going BullishWe just looked at XLMBTC and this one is going bullish.
Now we have XLMUSDT.
XLMUSDT is not as strong as the XLMBTC pair but we have some early signals that look good.
First, its price remain trading above EMA300.
MA200 trending down tend to push prices up.
Last, we have this falling wedge pattern, each time it shows up prices tend to jump.
Quick & simple.
I hope you that you enjoyed.
Namaste.

Stellar About To Pick Up Speed...(125% Can Happen)I can tell you that XLMBTC (Stellar) is about to pick up some speed.
Today we have a "volume breakout"; the highest volume daily since May, and the day is not over yet.
High volume while moving above EMA50 is a very strong signal.
The MACD on the bullish zone and a strong RSI support this move.
We can see XLMBTC picking up speed.
The price of this Altcoin pair is set to increase.
Namaste.

XLM is clearly in somebody's golden pocketThe worst case scenario as it relates to my previous idea:
We could just head to .29....like now


XLM breakout 2Stellar broke up this triangle 📐 and I think there is chance for run to 0.96 and even higher. Buying now. XLM let's make it!🚀
ENTRY : local high @ 0.4024
SL : local low @ 0.3083
TARGET : height of the triangle projected from midpoint of the local range (RANGE HIGH - SL) @ 0.96
RRR : 6
INVALIDATION : when SL level hit
Check my other stuff in related ideas.
Please like👍, comment🗣️, follow me✒️, enjoy📺!
⚠️Disclaimer: I'm not financial advisor. This is not a financial advice. Do your own due dilingence.

$XLM Head & Shoulders+ Reversal Head & Shoulders
+ bulllish pattern (if breakout)
+
Targets :
TP1 : 0.5095 (30%)
TP2 : 0.6374 (60%)
TP3 : 0.77-ATH (100%)
SL : Daily close below 0.3300

XLM - Good Opportunity (Target $2-2.75)Hi, this is my new update for XLM. We have been in correction mode for 192 days and I think the bullrun for XLM is not done yet. Now we are in one of the most beautiful parallel channels in the history of cryptocurrencies and we have tested both trendlines multiple times. I expect we have one more push in XLM, that will give us more than 500% gains and I found the target $2-2.75 from both the parallel channel and the 4.236 Fibonacci extension. We are now fighting with 50, 100 and 200 day moving averages at the same time and we have a big resistance around $0.42, but I expect once we break it we are ready to takeoff. So be patient and don't panic. Good things take time ;)

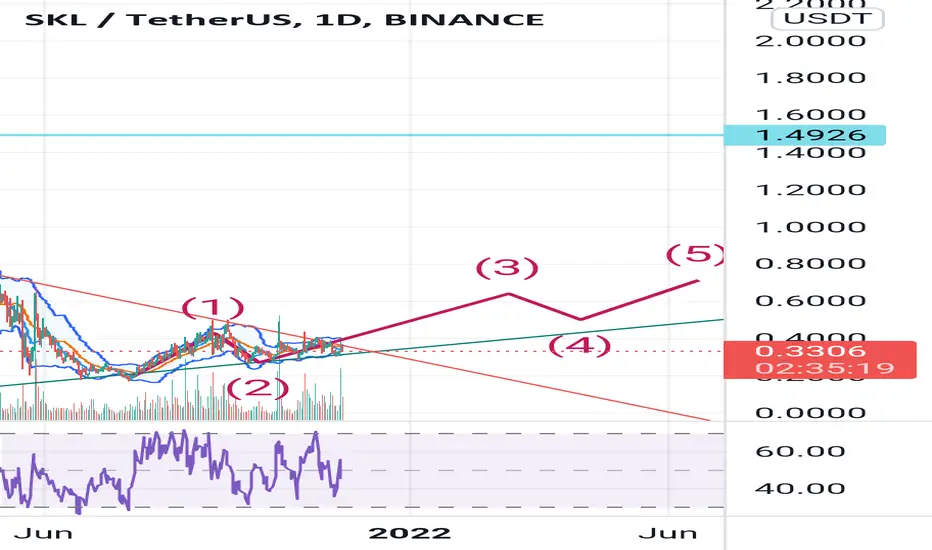
Skl bitcoin faultAs you can see in this analysis, SKL went down because Bitcoin ABC correction ( link )
I'm showing you the possible 3th Elliot Wave.
XLMUSDT-ShortFutures XLMUSDT XLM Stellar
🔴Short Now or set on Key Level 0.3544
🟢Target 1 0.3323
🟢Target 2 0.3125
❌Stop loss 0.3600
#K_Level

$XLM road to $0.385Hello cryptofolks
We can see weakness in indicators which can expect some more correction till bitcoin consolidation
After that we can expect a quick raise in altcoins specially those who still didn't hit their previous ATH as XLM
-Goodluck

Potential Ascending triangle on XLMFresh Post Monday Fun
In trading it is very important to have several mental models in mind. You can not be biased and in love towards 1 scenario you WANT to happen.
we have a beautiful ascending triangle which can be recognised by a ceiling and a sequence of higher lows.
Important to note is that patterns occur on every timeframe. What happens on a smaller timeframe is less significant than what happens on a bigger timeframe. So if we see an ascending triangle on the weekly chart ( high timeframe ) you could be thinking about a semi long term bullish run for xlm.
But like I said , you can not fall in love with that scenario so you have to make mental models if something else happens. Outlined are 3 scenario's that can happen and you need to plan in advance how you are going to adjust your strategy if you were right / wrong about your model.
Which model do you like best ?
Nova

Stellar Analysis XLMUSDAn analysis for XLMUSD using Gann and Fibonacci circle
The fib circle shows a clear passage through 2.618 following a previous rejection at this level (red arrow), this could lead to a breakout
The gann portrays the length of the bear and current bull run
Price is also sitting right above 0.618, which is established from the previous ATH
We still have some steam (steem) left in the tank for the bull run
Happy trading
